Nasdaq 100 Analysis: Tech Stocks Face Sell-OffsNasdaq 100 Analysis: Tech Stocks Face Sell-Offs
As the chart shows, the Nasdaq 100 index fell by approximately 1.6% yesterday.
According to media reports, bearish sentiment has been fuelled by the approach of key events:
→ the release of the FOMC meeting minutes (today at 21:00 GMT+3);
→ Jerome Powell’s speech at the Jackson Hole symposium on Friday. Market participants are preparing for remarks from the Fed Chair on the trajectory of interest rates.
Notably, the S&P 500 declined less significantly, while the Dow Jones remained virtually unchanged. This suggests that:
→ tech stocks are heavily overvalued due to AI-driven hype;
→ capital shifted yesterday from risk assets (including cryptocurrencies) into so-called safe havens.
Could tech stocks continue to decline?
Technical Analysis of the Nasdaq 100
Analysing the Nasdaq 100 index chart on 5 August, we plotted the main upward channel (shown in blue). It remains valid, as since then the price has:
1→ reached the upper boundary, which (as often happens) acted as resistance;
2→ retreated to the median line, where volatility decreased (a sign of balance between supply and demand), but only briefly.
Yesterday’s low coincided with the lower boundary of the channel.
From a bullish perspective, buyers might rely on:
→ a resumption of the uptrend from the lower boundary (as was the case in early August);
→ support at the 50% retracement level after the A→B impulse (located around the current price area);
→ a rebound from the oversold zone indicated by the RSI;
→ support at the 7 August low of 23,250 (a false bearish breakout remains possible).
On the other hand: the price has confidently broken through the channel median and then accelerated downwards (a sign of imbalance in favour of sellers). This imbalance zone (which, under the Smart Money Concept methodology, is considered a bearish Fair Value Gap) could act as resistance going forward.
Given the pace of yesterday’s decline, we could assume that sellers currently hold the initiative. Should we see weak rebounds (in the style of a dead cat bounce) from the channel’s lower boundary, the likelihood of a bearish breakout could increase.
This article represents the opinion of the Companies operating under the FXOpen brand only. It is not to be construed as an offer, solicitation, or recommendation with respect to products and services provided by the Companies operating under the FXOpen brand, nor is it to be considered financial advice.
Nasdaq100trading
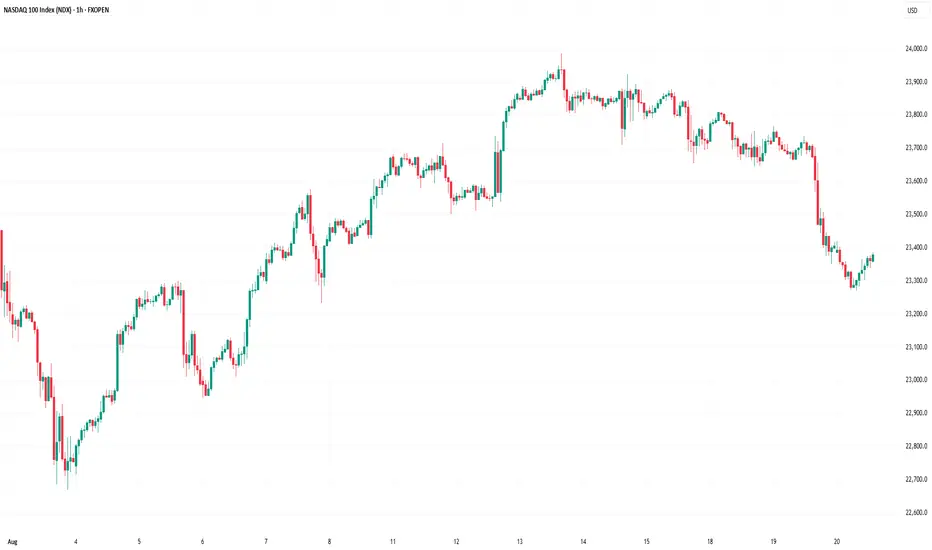
Nasdaq 100 Analysis: Index Rebounds After Friday’s DeclineNasdaq 100 Analysis: Index Rebounds After Friday’s Decline
The release of disappointing US labour market data on Friday unsettled both stock market participants and the President of the United States:
→ Donald Trump promptly dismissed Erica McEntarfer, Commissioner of the Bureau of Labor Statistics, accusing her of falsifying employment data.
→ Stock indices accelerated their decline, with the Nasdaq 100 Index falling below its 16 June low.
However, US stock indices staged a strong recovery on Monday. According to Reuters, yesterday marked the largest daily percentage gain since 27 May.
Why Did Stock Indices Rise?
Possible reasons include:
→ Buyers were attracted by the falling share prices of companies that, for the most part, had delivered strong quarterly earnings;
→ Market participants are betting on a potential rate cut by the Federal Reserve in September (a move strongly advocated by Trump), which could support both the economy and the stock market.
Technical Analysis of the Nasdaq 100 Chart
In our earlier analysis of the Nasdaq 100 Index, we:
→ Identified a primary ascending channel (marked in blue);
→ Highlighted that the price had risen above the upper boundary of the channel (a sign of excessive optimism);
→ Anticipated a potential correction towards the 23,020 level.
However, the correction turned out to be more substantial than initially expected.
As a result of the price movements on Friday and Monday:
→ The blue channel was widened twofold;
→ The price found support at its new lower boundary and reversed upwards;
→ As of today, the Nasdaq 100 index is trading near the median line.
This can be interpreted as the market aggressively digesting recent corporate earnings reports and the prospects of a rate cut in light of a deteriorating labour market. Demand and supply may reach a new equilibrium, potentially leading to a consolidation phase around the median of the widened channel.
It is also possible that the area marked in orange—where the price previously rallied strongly, indicating a buyer-driven imbalance—may now act as support. Resistance levels might include:
→ Former support at 23,320;
→ 23,440 – the level at which bears broke through the purple channel.
This article represents the opinion of the Companies operating under the FXOpen brand only. It is not to be construed as an offer, solicitation, or recommendation with respect to products and services provided by the Companies operating under the FXOpen brand, nor is it to be considered financial advice.

Stock Markets Rise Amid US–China Trade Deal ProgressStock Markets Rise Amid US–China Trade Deal Progress
As the chart shows, the Nasdaq 100 index (US Tech 100 mini on FXOpen) formed a bullish gap at Monday’s market open and, as of this morning, is trading at its highest level since early March.
This is driven by the announcement from the Trump administration of progress in securing a trade deal with China, following weekend negotiations held in Switzerland. Treasury Secretary Scott Bessent described the two-day talks with Chinese officials in Geneva as “productive”, adding that more detailed information would be shared on Monday.
As a reminder, the US imposed tariffs of 145% on Chinese goods, to which Beijing responded with a 125% levy on American imports.
Technical Analysis of the E-mini Nasdaq 100 Chart
The chart is showing bullish signals:
→ The downward trendline (shown in orange) was broken around the 19,666 level, which has since acted as support (indicated by the blue arrow).
→ Today, the Nasdaq 100 has moved above last week’s resistance near the 20,175 level.
→ Market fluctuations are forming an upward channel (shown in blue) from the April lows, with the price currently sitting in the upper half of the channel—typically a sign of strong buying pressure.
Further updates on the US–China trade deal may reveal key details, potentially reinforcing the current bullish sentiment in the equity markets.
This article represents the opinion of the Companies operating under the FXOpen brand only. It is not to be construed as an offer, solicitation, or recommendation with respect to products and services provided by the Companies operating under the FXOpen brand, nor is it to be considered financial advice.

NASDAQ100his could be a break to the upside of 12127.00
If this goes up, it could break the next price of 13000.00
My crazy prediction is the price hitting 13721.8.
Let me see how it goes. SKILLING:NASDAQ

Nasdaq100 what now episode 13In this video, I marked my levels. A summary is, the market has given us valid structures at 14200 and 14,000. As long as the market trades below 14,200.. We're looking to take sells but---as soon as it's past past there; Buys!
Similarly, if the nasdaq100 trades above 14,000 without breaking, we can expect the bulls but if below 14,000---more sells. Hope this helps some-one.
Do me a huge favor: smash the like button, comment, and follow me.
Love,
Lazyluchi

Nasdaq 100Nasdaq 100 - 4h analysis
Resistance Levels: 12041.1, 12260, 12463.1
Support Levels: 11776, 11442.2, 11200
#JustTradeFxOnline
Thanks for your love and support.
Don’t forget to like and comment for more.


Nasdaq100 Emini - 4hr. - Ongoing SHORT....We (and you??) have been short this thing since 11500.
See this post:
and this post:
This is just a reminder where we are going and to look for fresh SHORT Entries.
