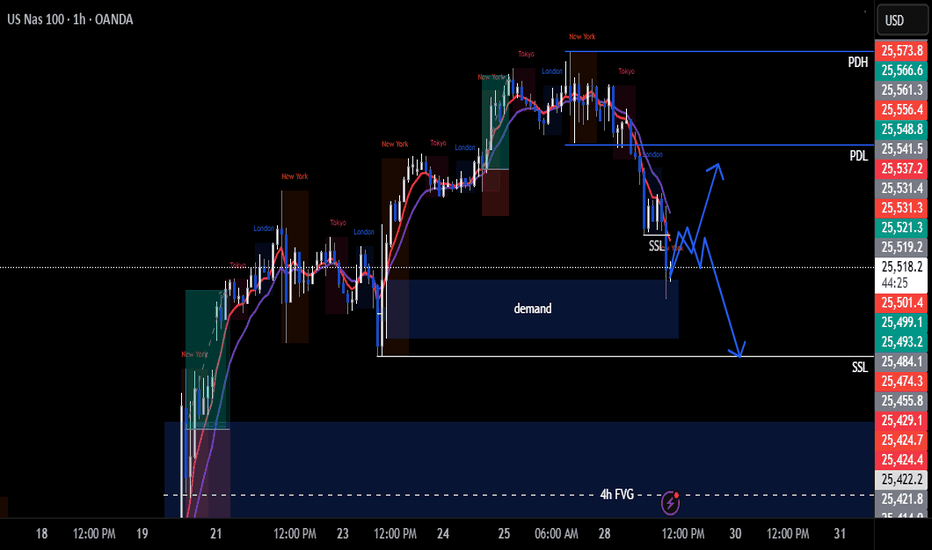
Can NQ1! Push Through $25K+ Resistance Zone?🎯 The Great NQ Heist: Layered Entry Strategy for E-Mini NASDAQ-100 Futures
📊 Market Overview
**Asset:** NQ1! (E-Mini NASDAQ-100 Futures)
**Strategy Type:** Swing/Day Trade - Wealth Accumulation Map
**Bias:** 🐂 **BULLISH**
🎭 The "Gentleman Thief" Layering Strategy
💰 Entry Philosophy: Layer Like a Pro
This setup uses a **sophisticated layering approach** - think of it as strategically placing multiple limit orders to capture the best average entry. You're not going all-in at one price; you're building your position like a chess master.
📍 Suggested Layer Entry Zones:
- 🎯 Layer 1: **24,800**
- 🎯 Layer 2: **24,900**
- 🎯 Layer 3: **25,000**
- 🎯 Layer 4: **25,100**
Note: You can scale in at ANY price level using this layering method. Add more layers based on your position size and risk tolerance. The beauty of this strategy is flexibility - enter where the market gives you opportunity! 🎪
🛡️ Risk Management
Stop Loss Zone: **24,700**
⚠️ **Important:** This is MY stop loss level based on technical structure. However, trading is a personal journey - YOU decide your own risk parameters. Protect your capital first, profits second. Your SL should align with YOUR risk tolerance and account size.
🎯 Profit Target
Target Zone: **25,600** 🚀
This level represents a confluence of:
- 💪 Strong resistance zone
- 📈 Overbought conditions
- Potential bull trap area
**Smart Exit Strategy:** As we approach this zone, consider scaling out of positions. Don't get greedy - take profits when the market offers them!
⚠️ **Reminder:** This is MY target projection. You're the captain of your own ship - take profits when YOU feel comfortable. Trail stops, scale out, or hold for moon - your money, your rules! 🌙
🔗 Related Pairs to Watch
Keep your eyes on these correlated instruments
- SEED_ALEXDRAYM_SHORTINTEREST2:NQ =F** - NASDAQ-100 Futures (spot reference)
- NASDAQ:QQQ - Invesco QQQ Trust (ETF equivalent)
- NASDAQ:AAPL , NASDAQ:MSFT , NASDAQ:NVDA , NASDAQ:GOOGL ** - Top NASDAQ-100 components
- NASDAQ:NDX - NASDAQ-100 Index (cash)
- CME_MINI:ES1! - E-Mini S&P 500 Futures (broader market correlation)
📌 Why these matter:** The NASDAQ-100 is tech-heavy, so major tech stocks drive NQ movement. Watch QQQ for retail sentiment and ES for overall risk appetite. When big tech moves, NQ follows! 💻
🎓 Strategy Breakdown
This "layering" or "scaling-in" approach offers several advantages:
- ✅ **Better average entry** - Dollar-cost averaging into position
- ✅ **Reduced timing risk** - Not dependent on perfect entry
- ✅ **Psychological comfort** - Builds confidence as position develops
- ✅ **Flexibility** - Adapt to market conditions in real-time
📢 Final Thoughts
The market rewards patience and discipline. This layered entry strategy is about working WITH the market, not against it. Whether you're a swing trader holding for days or a day trader scalping ticks, the principle remains: **Control your risk, let profits run.** 🏃♂️💨
✨ **If you find value in my analysis, a 👍 and 🚀 boost is much appreciated — it helps me share more setups with the community!**
**⚠️ DISCLAIMER:** This analysis represents a "gentleman thief" style layered trading strategy intended for educational and entertainment purposes only. This is NOT financial advice. Trading futures involves substantial risk of loss and is not suitable for all investors. Past performance is not indicative of future results. Always trade with risk capital you can afford to lose. Make your own trading decisions based on your personal risk tolerance, account size, and market analysis. 🎭📊
#NQ1 #NASDAQ100 #NASDAQFutures #EminiNQ #FuturesTrading #DayTrading #SwingTrading #TechnicalAnalysis #LayeringStrategy #ScalingIn #TradingSetup #FuturesMarket #TechFutures #NDX #QQQ #RiskManagement #TradingStrategy #MarketAnalysis #BullishSetup
Nasdaqfutures
Nasdaq Is About to Choose: Melt Up or MeltdownNasdaq E-minis (NQ1) are coiling at a key inflection point.
-If 24,874 breaks, a push into 25,100 looks likely.
-Clear that level, and bulls can stretch to 25,300–25,385 for a solid run.
-But if we lose 24,782, pressure builds toward 24,689… and a break there exposes 24,439.
Here’s the part most traders miss: these levels aren’t just numbers; they’re liquidity traps. One side of the market gets baited in, then the other side runs with it.
👉 Smart money already knows which pockets matter most. Retail will find out the hard way.
How are you positioning if NQ1 breaks either way?
NASDAQ 100 (NQ1!): Bullish! Buy The Dip!Welcome back to the Weekly Forex Forecast for the week of Sept 15 - 19th.
In this video, we will analyze the following FX market: NASDAQ (NQ1!) NAS100
The NASDAQ is bullish. No reason in the world to start looking for shorts! Let the market pullback to Internal Range Liquidity (IRL), a +FVG or +OB, and look for valid long setups on the lower timeframes.
Enjoy!
May profits be upon you.
Leave any questions or comments in the comment section.
I appreciate any feedback from my viewers!
Like and/or subscribe if you want more accurate analysis.
Thank you so much!
Disclaimer:
I do not provide personal investment advice and I am not a qualified licensed investment advisor.
All information found here, including any ideas, opinions, views, predictions, forecasts, commentaries, suggestions, expressed or implied herein, are for informational, entertainment or educational purposes only and should not be construed as personal investment advice. While the information provided is believed to be accurate, it may include errors or inaccuracies.
I will not and cannot be held liable for any actions you take as a result of anything you read here.
Conduct your own due diligence, or consult a licensed financial advisor or broker before making any and all investment decisions. Any investments, trades, speculations, or decisions made on the basis of any information found on this channel, expressed or implied herein, are committed at your own risk, financial or otherwise.
Classic tug-of-war NASDAQBias: Still broadly bullish on the daily—no true downside displacement, and price hasn’t closed below the last impulse up. But… we failed to close above recent 2-month highs and are sitting right at weekly equilibrium.
Where we are: Price is coiling around the 4H BISI low ≈ 23,790.50, which also aligns with ~50% of the weekly range. Nested inside is a 1H BISI with a bullish 1H OB just beneath. Classic tug-of-war spot.
Areas of Interest:
Above: 23,929 → PDH 23,962.75 → 24,000 BRN → 24,040–24,080 (upper imbalance).
Below: 23,713.50 (50% of 1H OB) → 23,596 → 23,501 → swing magnet 22,684.75 (D1 SIBI high).
Tell: The last “new low” on 1H needed two candles to actually close below and did so weakly. That shows sell-side lacks displacement unless we break structure decisively.
What flips the switch (clear invalidation logic)
Bullish reclaim: 15–60m close back above 23,790–23,804 (ETH close 23,796.5 / RTH close 23,804) and hold on a retest → long side favored.
Bearish break: Clean 1H close below 23,713 (and acceptance under it) → short side favored; you’re below the 1H OB and the nested BISI.
Two actionable trade plans
(Use your 5m/1m execution: wait for displacement through the trigger, then take the FVG or OB retrace inside the HTF level.)
A) Reclaim-and-go LONG (higher-probability if we hold above weekly EQ)
Trigger: 15–60m close above 23,790–23,804, then a controlled retest that holds (wick below, body close back above).
Entry zone: 23,790–23,804 (retest of 4H BISI low / prior close cluster).
Invalidation (stop): Below 23,713 (under the 1H OB mid) or tighter under the swing that forms your 5m/1m FVG entry (your call on risk).
Conservative SL: 23,690–23,705 (below the OB body).
Profit targets:
T1: 23,929 (first buy-side pools / inefficiency fill)
T2: 23,962.75 (PDH)
T3: 24,000 (round-number magnet)
T4 (runner): 24,040–24,080 (upper imbalance)
Trade management: Partial at T1, move stop to BE after M5 market structure shift in your favor or after T1 prints. Keep a runner if displacement expands.
B) Breakdown-and-acceptance SHORT
Trigger: Clean 1H close below 23,713 and a retest rejection (can use a 5m FVG inside 23,713–23,730).
Entry zone: 23,713–23,730 (failed reclaim of 1H OB mid / underside of the 1H BISI).
Invalidation (stop): Above 23,790–23,804 (back inside/above the 4H BISI low and prior closes).
Tighter intraday SL can sit above the 5m swing that breaks down.
Profit targets:
T1: 23,596
T2: 23,501
T3 (optional intraday): 23,440–23,460 (prior 1H demand base, if visible on your feed)
T4 (swing only): 22,684.75 (D1 SIBI high)
Trade management: Take partial at T1, trail above last M5 LHs. If New York lunch compresses, be quick to pay yourself.
Why these are the right spots
23,790–23,804 is a decision box: 4H BISI low + ETH/RTH prior close cluster + weekly EQ. Acceptance above = trend continuation likely; rejection = continuation of the rotation lower.
23,713.50 is the line in the sand intraday: it’s the 50% of your 1H OB and sits just beneath the 1H BISI. Lose it and you’ve removed the nearby bullish sponsor, opening the path to 23,596/23,501.
The lack of downside displacement on the last “new low” keeps a bullish continuation on the table—until we get that decisive 1H break/acceptance below 23,713.
Execution tips
Time-of-day: favor NY AM session for your displacement signal; Monday often ranges → reduce size until one side wins (as you noted).
Trigger discipline: do not anticipate the reclaim/break. Wait for the 15–60m close, then execute on 5m/1m FVG back into the level.
Risk: if trading the same idea across multiple accounts, stagger entries (one at level, one at 50% of the M5 FVG).
Quick reference (levels)
Bullish above: 23,804 → 23,929 → 23,962.75 → 24,000 → 24,040–24,080
Neutral box: 23,790.5 (4H BISI low / weekly EQ) ± a few ticks
Bearish below: 23,713.5 → 23,596 → 23,501 → 22,684.75
NASDAQ: Time For A Pullback?In this Weekly Market Forecast, we will analyze the NASDAQ for the week of July 14 - 18th.
The NASDAQ had a strong week, until Tariff Tensions Friday arrived.
This by itself doesn't mean we should start looking for sells. Just like the S&P 500, I'm expecting short term bearishness, as price goes from ERL to IRL.
With Tuesday CPI Data coming, this short term consolidation is to be expected until the news is announced.
Let the markets pick a direction, and flow with it.
Have a plan of action in place so you can react to the price action promptly!
Enjoy!
May profits be upon you.
Leave any questions or comments in the comment section.
I appreciate any feedback from my viewers!
Like and/or subscribe if you want more accurate analysis.
Thank you so much!
Disclaimer:
I do not provide personal investment advice and I am not a qualified licensed investment advisor.
All information found here, including any ideas, opinions, views, predictions, forecasts, commentaries, suggestions, expressed or implied herein, are for informational, entertainment or educational purposes only and should not be construed as personal investment advice. While the information provided is believed to be accurate, it may include errors or inaccuracies.
I will not and cannot be held liable for any actions you take as a result of anything you read here.
Conduct your own due diligence, or consult a licensed financial advisor or broker before making any and all investment decisions. Any investments, trades, speculations, or decisions made on the basis of any information found on this channel, expressed or implied herein, are committed at your own risk, financial or otherwise.
Is The Nasdaq Bullish? Moving Higher Tomorrow...?In this video, we will analyze the NASDAQ futures for Friday, May 2nd.
Markets are looking tradeable again.
NQ has swept an old high, and retraced today. I like the location of the bullish FVG right below... which price has just tapped into a little while ago.
Look for the reaction from that +FVG, and trade accordingly.
Enjoy!
May profits be upon you.
Leave any questions or comments in the comment section.
I appreciate any feedback from my viewers!
Like and/or subscribe if you want more accurate analysis.
Thank you so much!
Disclaimer:
I do not provide personal investment advice and I am not a qualified licensed investment advisor.
All information found here, including any ideas, opinions, views, predictions, forecasts, commentaries, suggestions, expressed or implied herein, are for informational, entertainment or educational purposes only and should not be construed as personal investment advice. While the information provided is believed to be accurate, it may include errors or inaccuracies.
I will not and cannot be held liable for any actions you take as a result of anything you read here.
Conduct your own due diligence, or consult a licensed financial advisor or broker before making any and all investment decisions. Any investments, trades, speculations, or decisions made on the basis of any information found on this channel, expressed or implied herein, are committed at your own risk, financial or otherwise.
Possible NQ Bounce Starting Monday 3/10/25Monday and the rest of the coming week could be the start of the NQ making a bounce. If not, it's look out below with a break of 20,000 going to 19,000 rather quickly. Price will dictate how we go but a good bounce is not out of the question. Watch the video for more details.
Feel free to leave your comments.
Thanks for watching.
Intraday Levels for Nasdaq 100 Futures - 01/22/2025This analysis focuses on the Nasdaq 100 Futures, aiming to identify potential support and resistance levels where the price could experience intraday bounces or trend reversals, as well as zones where the price might potentially break higher or move lower.
Considerations
The range used in this analysis serves only as a reference for broader-level insights.
For intraday operations, it is advisable to utilize a lower timeframe to refine entry and exit points more accurately.
To confirm the validity of these levels, it is essential to evaluate real-time conditions as the price approaches these zones. Factors such as pressure, trading volume, and Order Flow will play a critical role in determining whether these supports hold or are likely to be broken.
Intraday Levels for Nasdaq 100 Futures - 01/21/2025This analysis focuses on the Nasdaq 100 Futures, aiming to identify potential support and resistance levels where the price could experience intraday bounces or trend reversals, as well as zones where the price might potentially break higher or move lower.
Considerations
The range used in this analysis serves only as a reference for broader-level insights.
For intraday operations, it is advisable to utilize a lower timeframe to refine entry and exit points more accurately.
To confirm the validity of these levels, it is essential to evaluate real-time conditions as the price approaches these zones. Factors such as pressure, trading volume, and Order Flow will play a critical role in determining whether these supports hold or are likely to be broken.
Intraday Levels for Nasdaq 100 Futures - 01/16/2025This analysis focuses on the Nasdaq 100 Futures, aiming to identify potential support and resistance levels where the price could experience intraday bounces or trend reversals, as well as zones where the price might potentially break higher or move lower.
Considerations
The range used in this analysis serves only as a reference for broader-level insights.
For intraday operations, it is advisable to utilize a lower timeframe to refine entry and exit points more accurately.
To confirm the validity of these levels, it is essential to evaluate real-time conditions as the price approaches these zones. Factors such as pressure, trading volume, and Order Flow will play a critical role in determining whether these supports hold or are likely to be broken.
SL HIT ON NASDAQAs I post my winning trades, I'm going to post my losing one, so people, especially beginners know that trading isn't always wins and wins, and no strategy always brings back profits for you.
Every strategy has downsides and upsides, this is the first thing I teach to my students who fully understands it.
In case you wondered how I trade, I'm a reversal based trader. hich means I trade reversals, ans as every strategy it works 80% of the time and having a losing day of the week, but the unforgivable thing is to let your emotions take over your trading and lose all the profits you made.
The first thing I teach is don't let your emotions take over your trading, and don't make more than 2 losing trades a day. STICK TO THE PLAN.
Follow for more!