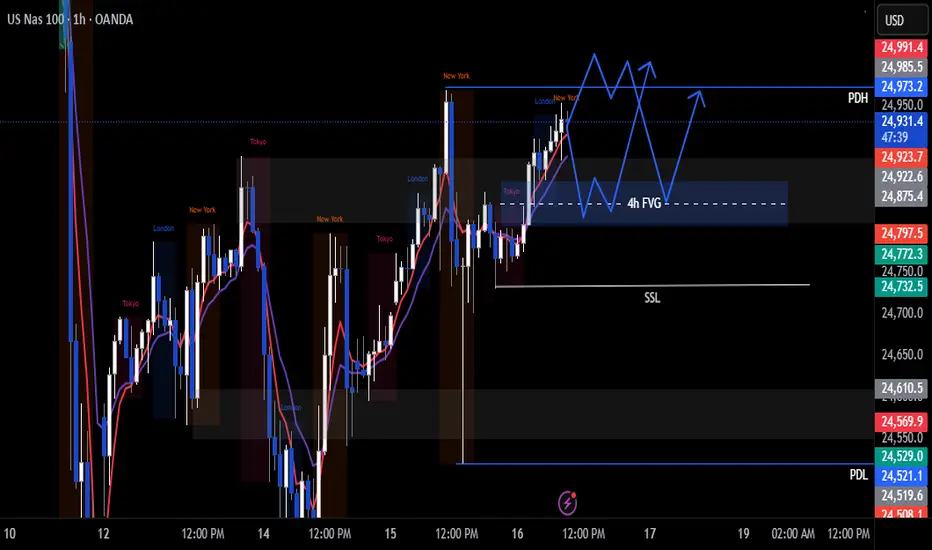
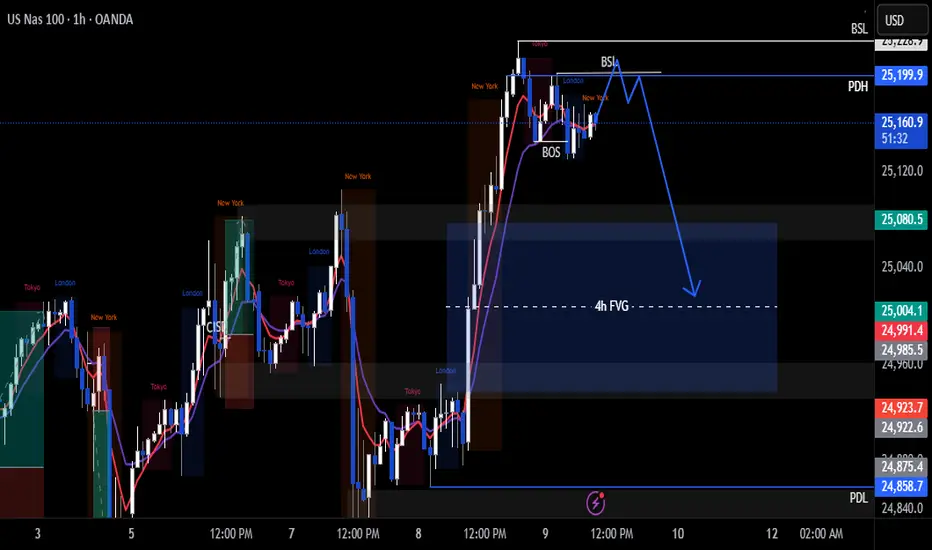
Nas100 Trade Set Up Oct 21 2025Price took PDH and is currently failing to break out of a strong daily resistance area so i will be looking for sells towards 4h FVG and SSL
Nasdaqsignals

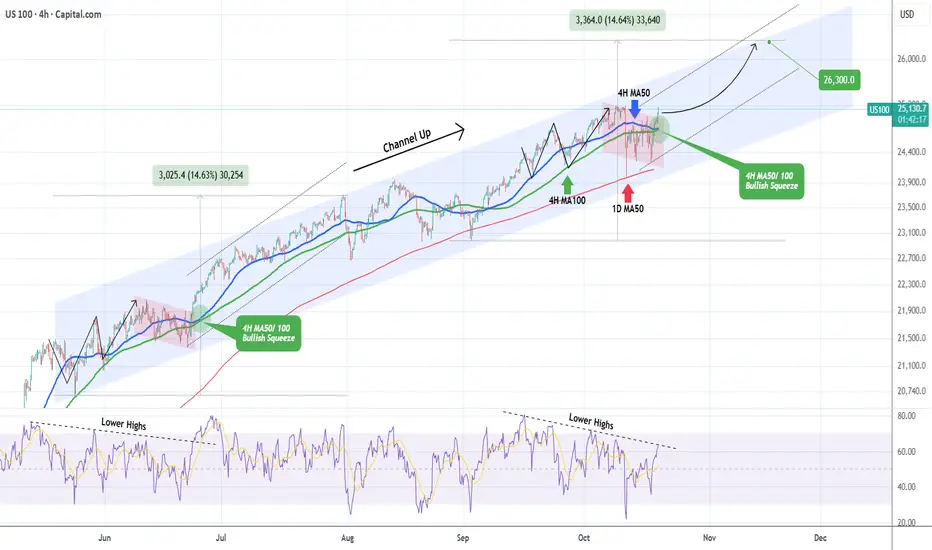
NASDAQ This bullish squeeze can push it to 26300.Nasdaq (NDX) has been trading within a Channel Up since the May 23 Low on its 4H MA100 (green trend-line). It appears that the index is getting out of the red Bearish Leg, which on the whole pattern serves as a Bull Flag for the next rally (Bullish Leg). Once the 4H RSI breaks above its Lower Highs trend-line, it will confirm the new Bullish Leg.
The last such RSI Lower Highs break-out was on June 23 when a similar 4H MA50/ 100 Bullish Squeeze took place. That was almost in the middle of a +14.63% rally in total before the index pulled back to its 1D MA50 (red trend-line).
As a result, once the 4H RSI break-out is finalized, we expect this run to reach at least 26300 (+14.63%).
-------------------------------------------------------------------------------
** Please LIKE 👍, FOLLOW ✅, SHARE 🙌 and COMMENT ✍ if you enjoy this idea! Also share your ideas and charts in the comments section below! This is best way to keep it relevant, support us, keep the content here free and allow the idea to reach as many people as possible. **
-------------------------------------------------------------------------------
💸💸💸💸💸💸
👇 👇 👇 👇 👇 👇
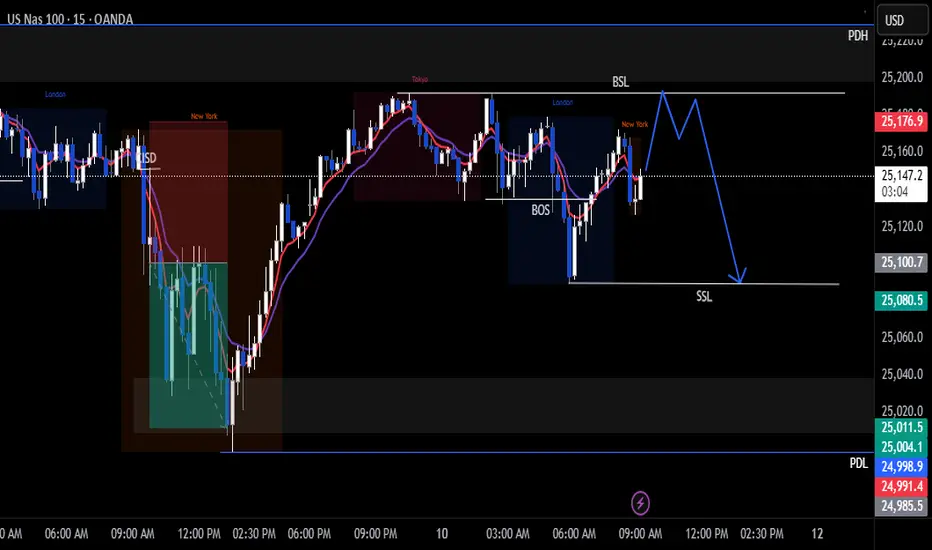
Nas100 Trade Set Up Oct 20 2025I want to see price sweep BSL/London highs then make internal bearish structure on the 1m/5m forming a IFVG and CISD to take sells toward SSL/Asia lows

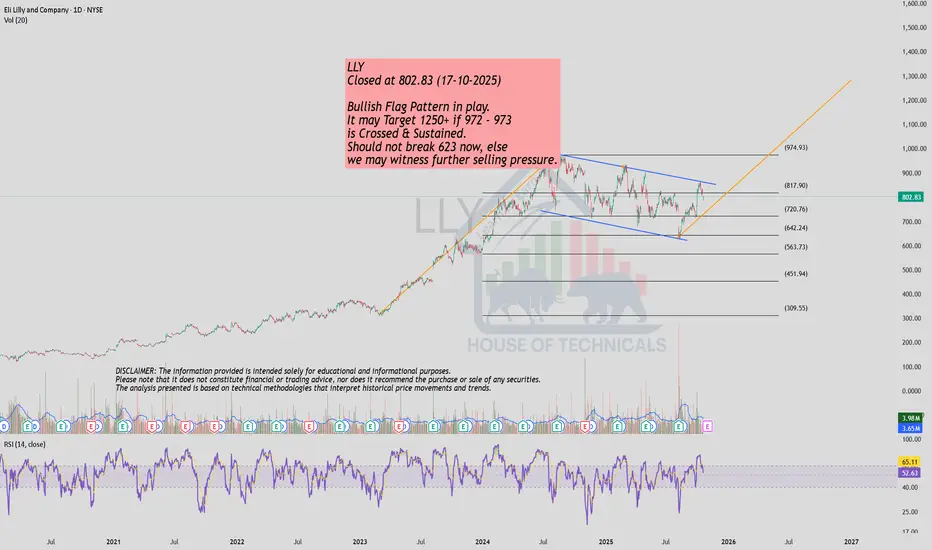
Bullish Flag Pattern!LLY
Closed at 802.83 (17-10-2025)
Bullish Flag Pattern in play.
It may Target 1250+ if 972 - 973
is Crossed & Sustained.
Should not break 623 now, else
we may witness further selling pressure.
Nas100 Trade Set Up Oct 17 2025I am overall still bearish so i want to see either a sweep of BSL/Asia highs followed by internal bearish structure to take sells down to SSL/London lows or a BOS of 15m low to then sell to SSL

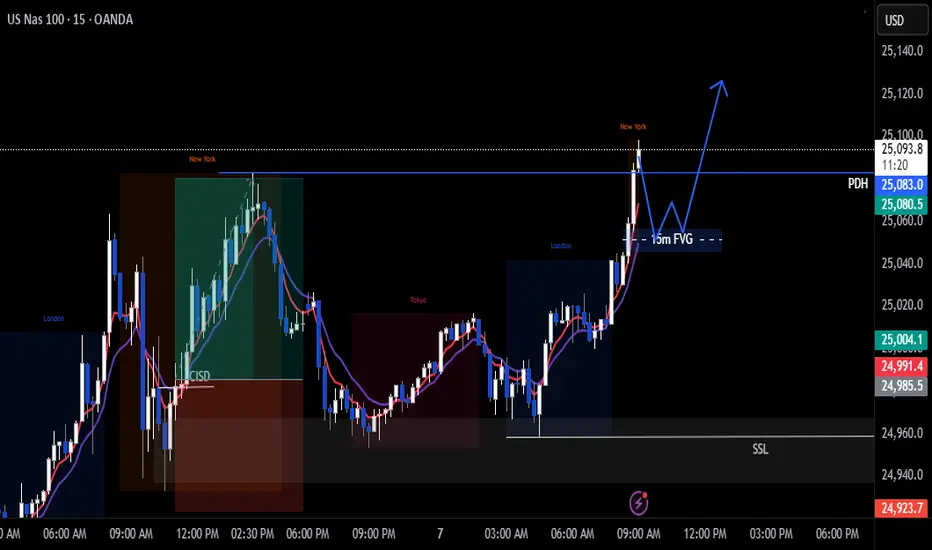
Nas100 Trade Set Up Oct 16 I want to see a see sweep of PDH to then get a push down to 4h FVG before continuing up or a push down to 50% of the 4h FVG first to then buy to PDH
Nas100 Trade Set Up Oct 15 2025i want to see price sweep PDH, make internal bearish structure and target 4h FVG and possibly Asia lows as SSL before continuing bullish

Can NASDAQ100’s Retest Turn Into a Full-Fledged Rally?⚡ NASDAQ100 — “The Wall Street Engine” Trade Opportunity Guide (Swing / Day Trade)
Plan:
📈 Bullish confirmation awaited at the Hull Moving Average retest.
When price respects that dynamic zone and momentum aligns, the Thief layers up — ready to stack positions like a pro!
💰 Thief Strategy Playbook:
Thief’s weapon? Layering entries — the art of scaling in like a patient hunter.
Multiple buy limit orders are placed around:
🔹 24,400 🔹 24,500 🔹 24,600
(You can adjust or add more layers based on your own trading structure and capital.)
🛡️ Stop-Loss:
This is the Thief’s SL → @24,200
🕵️♂️ Note to all Thief OGs:
I’m not recommending that you copy my SL — risk management is your call.
Remember: Make money, then take money at your own risk.
🎯 Target Zone:
@25,300 — where the POLICE BARRICADE (resistance) stands tall!
⚠️ The zone aligns with overbought levels + liquidity trap potential, so don’t overstay your welcome.
Escape with profits like a smart thief before the market cuffs you! 💨
🕵️♂️ Note again to Thief OGs:
Targets are flexible — adapt based on your execution and structure confirmation.
🔍 Correlated Assets to Watch:
SP:SPX (S&P500) — often mirrors NASDAQ’s overall direction.
TVC:DJI (Dow Jones) — gives early risk-on/risk-off sentiment clues.
TVC:US10Y (US Treasury Yield) — rising yields can pressure tech stocks.
TVC:VIX (Volatility Index) — watch for volatility spikes; they often precede reversals.
Correlation Key Insight:
When the dollar weakens and yields cool, NASDAQ tends to fly 🚀 — liquidity rotation favors growth stocks and tech-heavy indices.
⚙️ Quick Recap:
✅ Bias: Bullish (with retest confirmation at Hull MA)
💸 Entry Zone: 24,400 → 24,600 (Layered limits)
🧱 SL: 24,200 (risk-controlled zone)
🎯 TP: 25,300 (liquidity + resistance zone)
⚠️ Risk: Adjust position size and trail stops as structure evolves
✨ “If you find value in my analysis, a 👍 and 🚀 boost is much appreciated — it helps me share more setups with the community!”
📜 Disclaimer:
This is a Thief-style trading strategy — designed for entertainment, education, and market storytelling. Trade responsibly; it’s just for fun, not financial advice.
#NASDAQ100 #US100 #IndexTrading #HullMA #PriceAction #MarketStructure #SwingTrade #DayTrade #TechnicalAnalysis #SmartMoneyConcepts #TradingCommunity #ThiefTrader #ChartArt #EditorPickCandidate

Nas100 Trade Set Up Oct 14 2025Price has swept both PDH and PDL and formed a 4h bearish FVG so i will be trading with the bearish trend waiting for price to sweep London highs as BSL to look for sells to SSL

NASDAQ NAS100 Trade Plan: VWAP & Volume Profile StrategyI’m currently watching the NASDAQ #100 (#NDX) 📊. After a strong correction due to geopolitical turmoil 🌍, the market rebounded just as aggressively. Right now, price is trading above VWAP 📈. If it stays above VWAP, I’ll be looking for a long opportunity.
In the video, we zoom into a 30-minute timeframe ⏱️, using VWAP and Volume Profile to plan the trade. If price respects these levels, we can take a long. If it falls below the support level ❌, we abandon this idea.
⚠️ Disclaimer: This is for educational purposes only and not financial advice.

Nasdaq - Clearly heading to $30.000!🎉Nasdaq ( TVC:NDQ ) points much higher:
🔎Analysis summary:
Yes, we witnessed a short term correction over the past couple of days. But no, this does not mean that the bullrun is now entirely over. In fact, looking at the longer term rising channel pattern, the Nasdaq can still rally higher until it will retest the upper trendline.
📝Levels to watch:
$25.000, $30.000
SwingTraderPhil
SwingTrading.Simplified. | Investing.Simplified. | #LONGTERMVISION

Nas100 Trade Set Up Oct 13 2025Price is still in a strong downtrend from last week. We got a 4h bearish FVG and a 1h gap that need to be filled. I will wait to see which one gets filled first to target the other one

NASDAQ Did the 1D MA50 just save the day??Nasdaq (NDX) suffered a historically strong daily sell-off on Friday following President Trump's tariff threats and touched (and closed on) its 1D MA50 (blue trend-line).
Last time it hit that trend-line was on September 02 and that was a technical Higher Low on the 5-month Channel Up. Friday's Low was also very close to the bottom of this pattern. At the same time the 1D RSI hit and rebounded on its Lower Lows Support trend-line.
With the market rebounding and opening considerably higher today, it is more likely technically that we have started the pattern's new Bullish Leg. With the last two such sequences rising by at least +11.00%, we expect a new similar uptrend, which as long as the 1D MA50 holds, could hit at least 26000 within a 40 day horizon.
-------------------------------------------------------------------------------
** Please LIKE 👍, FOLLOW ✅, SHARE 🙌 and COMMENT ✍ if you enjoy this idea! Also share your ideas and charts in the comments section below! This is best way to keep it relevant, support us, keep the content here free and allow the idea to reach as many people as possible. **
-------------------------------------------------------------------------------
💸💸💸💸💸💸
👇 👇 👇 👇 👇 👇

Nas100 Trade Set Up Oct 10 2025Price broke structure to the downside on the 1h and 15m so i am expecting price to sweep BSL at Asia and London highs then look for 1m IFVG/CISD to take sells down to SSl at London lows and possibly down to PDL
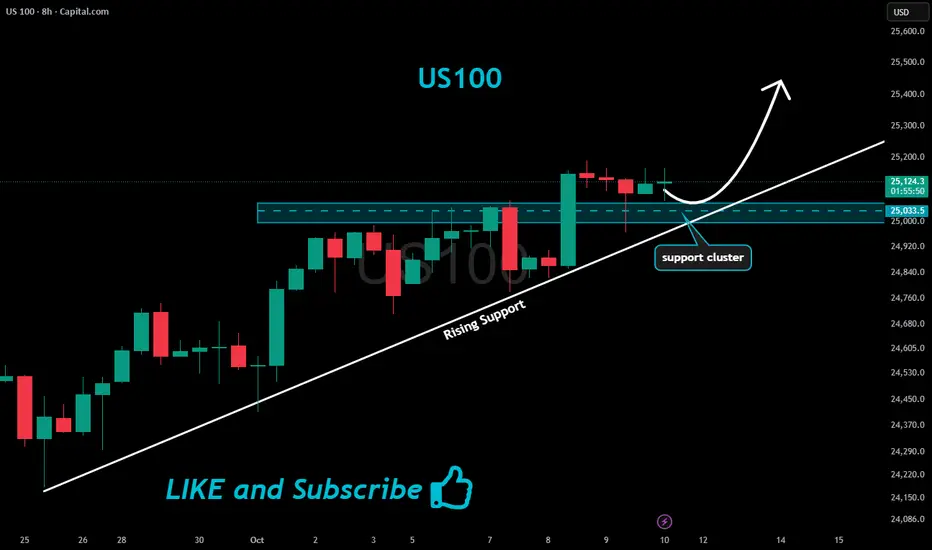
US100 Will Keep Growing!
HI,Traders !
#US100 is trading in an
Uptrend and broke
The key horizontal level
Of 25033.5 and the breakout
Is confirmed so after a potential
Retest of the support cluster
Of the rising and horizontal
Support lines below we will
Be expecting a bullish continuation !
Comment and subscribe to help us grow !
Nas100 Trade Set Up Oct 9 2025Price is currently making LH and broke structure so i want to see a sweep of BSL followed by a 1m IFVG/CISD to target 50% of the 4h FVG
www.tradingview.com
Nas100 Trade Set Up Oct 8 2025Price has made a LL indicating bearish structure so i will look for sells when BSL/London highs are swept to target PDL
www.tradingview.com

NAS100 Analysis: Trend, VWAP, Three-Drive Pattern, and Fibonacci📹 In this video, we take a detailed look at the NASDAQ/NAS100, which is currently in a strong bullish trend 📈. While the momentum is impressive, price may now be overextended, so caution is important ⚠️.
🔎 I share how I incorporate the VWAP, three-drive patterns, and the Fibonacci retracement tool to help plan high-probability trades 🎯.
📊 We also cover trend analysis, price action, and market structure, giving you a full breakdown of how these indicators work together to identify potential setups 🚀.
⚠️ Disclaimer: This content is for educational purposes only and not financial advice. Always trade responsibly and manage your risk.

7 oct looks short to melooking at the market today.
usa players have shown great strenght to short the markert.
so as seen on the video .
entry in blue 25248
target in 25028
stop in red 25291
have fun
Elektra

Nas100 Trade Set Up Oct 7 2025Price breaking PDH and making ATH so i am overall bullish. I want to see a pullback into 15m FVG before looking for more buys
www.tradingview.com
NASDAQ Channel Up found support and aims for 25600.Nasdaq (NDX) has been trading within a Channel Up since the August 28 High and on Friday it tested its 1H MA100 (green trend-line) again and rebounded. That has been a bullish continuation signal within this pattern every time a 1H MA50/ 100 takes place.
On the previous Bullish Leg that confirmed the upside continuation all the way to the 2.382 Fibonacci extension before a 1H MA50/ 100 Bearish Cross and new Low.
As a result, the current short-term Target on Nasdaq is 25600.
-------------------------------------------------------------------------------
** Please LIKE 👍, FOLLOW ✅, SHARE 🙌 and COMMENT ✍ if you enjoy this idea! Also share your ideas and charts in the comments section below! This is best way to keep it relevant, support us, keep the content here free and allow the idea to reach as many people as possible. **
-------------------------------------------------------------------------------
💸💸💸💸💸💸
👇 👇 👇 👇 👇 👇

Nas100 Trade Set Up Oct 6 2025Price is bullish making HH/HL on the 1h and has swept PDH so i am overall bullish. I would want to see price trade into the 1h FVG, respect it and form internal 1m bullish structure to look for buys or trade higher above recent swing highs, sweep internal SSL and go higher
www.tradingview.com

NASDAQ H4 OUTLOOK NEXT WEEK ! Iam Bullish On NASDAQ
Bullish On Two Zones
Fair Value Gap
Order Block
Target Old High / Buy Side Liquidity
Market Leads We Follow , Good Luck With Your Trading Guys !
