Bitcoin vs. Nasdaq: BTC Shows Signs of Decoupling Amid US Stock
For years, the narrative surrounding Bitcoin’s price action has been inextricably linked to the performance of traditional financial markets, particularly the tech-heavy Nasdaq Composite. Often moving in lockstep, Bitcoin was viewed by many as a high-beta asset, amplifying the gains during bullish periods and suffering even steeper losses when risk sentiment soured in equities. However, recent market movements have sparked a crucial question among investors and analysts alike: is Bitcoin finally beginning to forge its own path, decoupling from the gravitational pull of U.S. stocks as they face mounting headwinds?
The past few weeks have witnessed a notable divergence. While U.S. stock markets, reeling from a confluence of factors including escalating geopolitical tensions stemming from a potential “Trump tariff war,” persistent inflation concerns highlighted by Federal Reserve Chair Jerome Powell’s hawkish warnings of “higher inflation and slower growth,” and broader macroeconomic anxieties, have experienced a significant downturn – shedding a staggering $3.5 trillion in value – Bitcoin has demonstrated a surprising degree of resilience, even posting gains in some instances. This nascent divergence has ignited a wave of optimism among Bitcoin proponents who have long yearned for the digital asset to be recognized and traded based on its own fundamental merits, rather than as a mere proxy for risk-on sentiment in the equity markets.
The concept of Bitcoin decoupling from traditional assets has been a recurring theme in the cryptocurrency space. The original thesis for Bitcoin, after all, positioned it as a decentralized, censorship-resistant store of value and a hedge against traditional financial system vulnerabilities. Its finite supply, its independence from central banks and government policies, and its inherent scarcity were touted as key differentiators that would eventually lead it to trade independently. However, the reality of the past few years has often painted a different picture, with institutional adoption bringing increased correlation with established asset classes.
The current shift, however tentative, offers a glimmer of hope for those who believe in Bitcoin’s unique value proposition. The factors contributing to the stock market slump – trade war anxieties, inflation fears, and the prospect of tighter monetary policy – arguably strengthen the case for Bitcoin as an alternative asset. In times of economic uncertainty and currency debasement concerns, the fixed supply and decentralized nature of Bitcoin could become increasingly attractive to investors seeking a safe haven outside the traditional financial system.
Furthermore, the increasing maturity of the Bitcoin market, with the development of more sophisticated trading instruments, greater institutional participation, and a deeper understanding of its underlying technology, may be contributing to its growing independence. As Bitcoin gains broader acceptance as a legitimate asset class, its price discovery mechanisms may become less reliant on the sentiment driving traditional equity markets.
However, it is crucial to approach this apparent decoupling with a degree of caution. While the recent divergence is encouraging for Bitcoin bulls, it is too early to definitively declare the long-awaited break has finally arrived. Market correlations can be fluid and influenced by a multitude of factors. A sudden shift in global risk sentiment or a significant negative event specific to the cryptocurrency space could easily re-establish the link between Bitcoin and traditional assets.
Adding a layer of complexity to the current narrative is the warning from some analysts regarding a potential Bitcoin price correction. Despite the recent resilience, multiple BTC price forecasting models have pointed towards a scenario where Bitcoin could fall back to its 2021 all-time high of around $70,000 in a relatively short timeframe – some even suggesting this could occur within the next ten days. This potential “crash risk,” as one analyst termed it, is attributed to various technical and market cycle indicators.
The notion that $70,000 could represent Bitcoin’s “practical bottom,” as suggested by some, highlights the inherent volatility and speculative nature of the cryptocurrency market. Even if Bitcoin is beginning to decouple from traditional equities, it remains susceptible to its own unique set of risks and price swings. Factors such as regulatory developments, network security concerns, and shifts in investor sentiment within the crypto space can still exert significant influence on its price.
Therefore, while the current divergence between Bitcoin and the struggling U.S. stock market offers a compelling narrative and fuels the hopes of long-term Bitcoin holders, it is essential to maintain a balanced perspective. The confluence of factors driving the stock market decline could indeed be creating an environment where Bitcoin’s unique characteristics become more appealing, leading to a sustained period of independent price action. However, the inherent volatility of the cryptocurrency market and the potential for a significant correction remind investors that the journey towards true decoupling is likely to be a complex and potentially bumpy one.
In conclusion, the recent market dynamics present a fascinating juncture for Bitcoin. The initial signs of decoupling from the crumbling U.S. stock market, driven by a confluence of macroeconomic anxieties and the potential for Bitcoin to act as an alternative store of value, are undeniably encouraging for those who believe in its long-term potential. However, the warnings of a potential price correction underscore the inherent risks within the cryptocurrency space. Whether this nascent decoupling marks a definitive shift in Bitcoin's market behavior or proves to be a temporary divergence remains to be seen. Investors would be wise to monitor these trends closely, remaining cognizant of both the potential for independent growth and the ever-present risks associated with this dynamic and evolving asset class. The coming weeks and months will be crucial in determining whether Bitcoin can truly forge its own path in the face of traditional market turmoil.
Nasdaqsignals

NasqaqAll our World busy on Tarrif but after many weeks Nasdaq now at Attractive zone .
Plz don't add new sell position here .
Grab this Opportunity

NQ! Short Idea (MXMM, Quarterly Theory)Dear Traders,
today I present you once again my current idea on the Nasdaq. We have swept a High Liquidity Area marked as my lower HTF PDA. Because of that we might see a stronger Pullback as shown on my Chart.
However, I will still keep my eyes open and wait for the 9:30 (UTC-4) Manipulation to look for a Market Maker Sell Model which I will only consider a after a Pullback into my Key Areas and Price Action showing interests of a bearish continuation.
(09:30 Manipulation, Liquidity Sweep + SMT Divergence, Break Of Structure, Any PD-Array)
Praise be to God
-T-

NAS100 Testing Demand Zone – Major Reversal or More Drops? 📊 Market Overview:
The NASDAQ 100 (NAS100) just tested a strong demand zone (18,900 - 18,950) and is showing signs of a potential reversal. Can buyers push the price higher, or will bears take control?
🔹 Key Resistance Levels: 19,568 | 20,160
🔹 Current Price: 18,977
🔹 Key Support Levels: 18,896 (demand zone)
📉 Price Action Breakdown:
1️⃣ Sharp Drop into Demand Zone
Price recently fell from 19,568 after failing to break higher.
Buyers are now defending the 18,900 support zone, which has historically held strong.
2️⃣ Bullish Reversal Setup?
If the price holds above 18,900, we could see a bullish rally toward 19,568.
A breakout above 19,568 may open the way for 20,160+.
3️⃣ Bearish Breakdown Risk
If the price drops below 18,896, expect further downside towards 18,600 - 18,500.
Sellers would regain control, confirming a bearish continuation.
📊 Trading Plan:
📍 Bullish Case:
🔹 Look for bullish confirmation in the 18,900 - 18,950 zone.
🔹 A strong bounce could target 19,568, then 20,160.
📍 Bearish Case:
🔹 If price fails to hold 18,896, a short setup targeting 18,600 - 18,500 is possible.
🔹 Wait for a clean break & retest before shorting.
🔥 Will NAS100 bounce back from this demand zone, or will sellers dominate? Drop your thoughts in the comments! 👇
📊 Like & Follow for more trade insights! 🚀
#NASDAQ100 #TechStocks #Trading #StockMarket #SupplyAndDemand #Forex #PriceAction

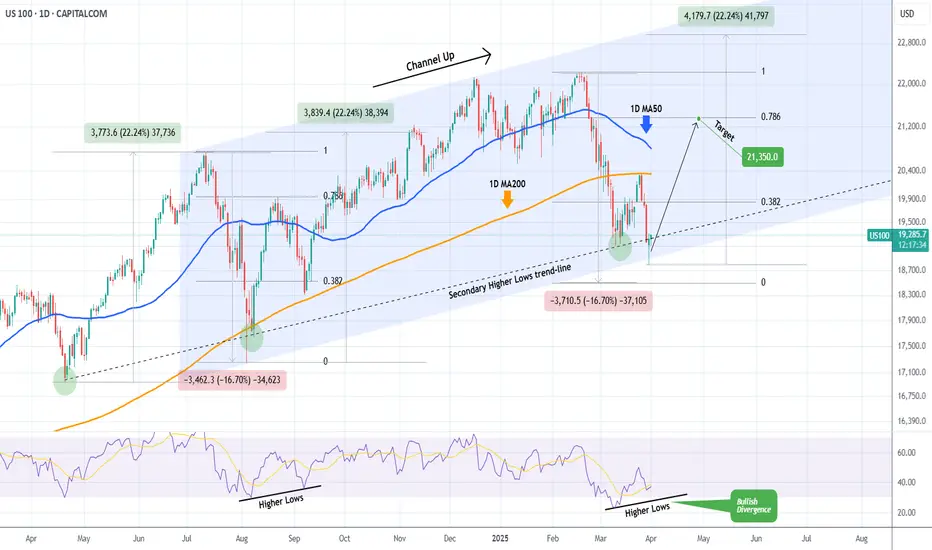
NASDAQ Huge Bullish Divergence points to 21350 inside April.Nasdaq (NDX) has been trading within a Channel Up pattern since the July 11 2024 High. The latest rally that started on March 11 2025 after a brutal 3-week downtrend/ Bearish Leg, got rejected on the 1D MA200 (orange trend-line) as the market digested the disappointing PCE.
Despite this aggressive rejection, the price hit and rebounded yesterday exactly at the bottom of the Channel Up with the previous such contact going back to the August 05 2024 Low. Not to mention that both the March 11 2025 and August 08 2024 Lows were formed exactly on the secondary Higher Lows trend-line.
What's perhaps more critical than any of these though, is that the 1D RSI didn't make a new Low last week and remains above the oversold barrier on a Higher Low trend-line that is a huge technical Bullish Divergence against the price's Lower Lows.
As with the August 22 2024 High, our first short-term Target is on the 0.786 Fibonacci retracement level at 21350.
-------------------------------------------------------------------------------
** Please LIKE 👍, FOLLOW ✅, SHARE 🙌 and COMMENT ✍ if you enjoy this idea! Also share your ideas and charts in the comments section below! This is best way to keep it relevant, support us, keep the content here free and allow the idea to reach as many people as possible. **
-------------------------------------------------------------------------------
💸💸💸💸💸💸
👇 👇 👇 👇 👇 👇
NAZDAQ - Weekly Forecast - Technical Analysis & Trading IdeasNASDAQ:NDX IG:NASDAQ
Midterm forecast:
20796.85 is a major resistance, while this level is not broken, the Midterm wave will be downtrend.
Technical analysis:
A peak is formed in daily chart at 22254.20 on 02/18/2025, so more losses to support(s) 19337.48, 18815.60, 18313.47 and more depths is expected.
Trading suggestion:
There is possibility of temporary retracement to suggested Trend Hunter Sell Zone (20554.38 to 20796.85).
We wait during the retracement, until the price tests the zone, whether approaching, touching or entering the zone.
We would set sell orders based on Daily-Trading-Opportunities and expect to reach short-term targets.
Beginning of entry zone (20554.38)
Ending of entry zone (20796.85)
Take Profits:
19901.88
19337.48
18815.60
18313.47
17841.19
16988.69
16247.08
__________________________________________________________________
❤️ If you find this helpful and want more FREE forecasts in TradingView,
. . . . . . . . Hit the 'BOOST' button 👍
. . . . . . . . . . . Drop some feedback in the comments below! (e.g., What did you find most useful? How can we improve?)
🙏 Your support is appreciated!
Now, it's your turn!
Be sure to leave a comment; let us know how you see this opportunity and forecast.
Have a successful week,
ForecastCity Support Team

Nasdaq market analysis: 01-APRIL-2025Good morning! Happy New Day! Here's your daily Nasdaq market analysis. Learn, grow, and trade wisely.

NASDAQ Bullish Reversal (Potential Tariff Resolution?) NASDAQ price action went through a massive correction with a drop from the top worth approx. 14%.
However after the passing of the latest FOMC Meeting, we may finally see a direction towards the resolution of widespread tariff based uncertainty across the macro economic landscape.
This presents us with a potential Reversal opportunity if we see the formation of a credible Higher High (given a potential proper break out) on the 4 HR and shorter timeframes.
Trade Plan :
Entry @ 20045
Stop Loss @ 19070
TP 0.9 - 1 @ 20923 - 21020

$NQ CorrectionPrice clearly is going towards Sellside Liquidity.
The standard deviation shows -2 to -2.5 is where price would reverse from and its also aligned with Sellside liquidity.
Idea: Bearish.

NAS - time to go longTeam, i wish i could show you my real account
time to go long on NAS - double bottom - retested
looking at 90-150 points recover

Nasdaq analysis: 27-MAR-2025Good morning, traders! Today's Nasdaq analysis will help you achieve your trading goals. Let's work together towards success.

Nasdaq insights: 26-MAR-2025Good morning, traders! As a seasoned price action trader, I'll share my Nasdaq insights to help you improve your trading skills.

Tuesday's NQ Trade idea 3.25.25 first trade of the day. SL was hit at $160 profit. We disrespected the bearish FVG level.
Let's see what happens next.
Forex, Crypto and Futures Trading Risk Disclosure:
The National Futures Association (NFA) and Commodity Futures Trading Commission (CFTC), the regulatory agencies for the forex and futures markets in the United States, require that customers be informed about potential risks in trading these markets. If you do not fully understand the risks, please seek advice from an independent financial advisor before engaging in trading.
Trading forex and futures on margin carries a high level of risk and may not be suitable for all investors. The high degree of leverage can work against you as well as for you. Before deciding to trade, you should carefully consider your investment objectives, level of experience, and risk appetite.
There is a possibility of losing some or all of your initial investment, and therefore, you should not invest money that you cannot afford to lose. Be aware of the risks associated with leveraged trading and seek professional advice if necessary.
BDRipTrades Market Opinions (also applies to BDelCiel and Aligned & Wealthy LLC):
Any opinions, news, research, analysis, prices, or other information contained in my content (including live streams, videos, and posts) are provided as general market commentary only and do not constitute investment advice. BDRipTrades, BDelCiel, and Aligned & Wealthy LLC will not accept liability for any loss or damage, including but not limited to, any loss of profit, which may arise directly or indirectly from the use of or reliance on such information.
Accuracy of Information: The content I provide is subject to change at any time without notice and is intended solely for educational and informational purposes. While I strive for accuracy, I do not guarantee the completeness or reliability of any information. I am not responsible for any losses incurred due to reliance on any information shared through my platforms.
Government-Required Risk Disclaimer and Disclosure Statement:
CFTC RULE 4.41 - HYPOTHETICAL OR SIMULATED PERFORMANCE RESULTS HAVE CERTAIN LIMITATIONS. UNLIKE AN ACTUAL PERFORMANCE RECORD, SIMULATED RESULTS DO NOT REPRESENT ACTUAL TRADING. ALSO, SINCE THE TRADES HAVE NOT BEEN EXECUTED, THE RESULTS MAY HAVE UNDER-OR-OVER COMPENSATED FOR THE IMPACT, IF ANY, OF CERTAIN MARKET FACTORS, SUCH AS LACK OF LIQUIDITY. SIMULATED TRADING PROGRAMS IN GENERAL ARE ALSO SUBJECT TO THE FACT THAT THEY ARE DESIGNED WITH THE BENEFIT OF HINDSIGHT. NO REPRESENTATION IS BEING MADE THAT ANY ACCOUNT WILL OR IS LIKELY TO ACHIEVE PROFIT OR LOSSES SIMILAR TO THOSE SHOWN.
Performance results discussed in my content are hypothetical and subject to limitations. There are frequently sharp differences between hypothetical performance results and the actual results subsequently achieved by any particular trading strategy. One of the limitations of hypothetical trading results is that they do not account for real-world financial risk.
Furthermore, past performance of any trading system or strategy does not guarantee future results.
General Trading Disclaimer:
Trading in futures, forex, and other leveraged products involves substantial risk and is not appropriate for all investors.
Do not trade with money you cannot afford to lose.
I do not provide buy/sell signals, financial advice, or investment recommendations.
Any decisions you make based on my content are solely your responsibility.
By engaging with my content, including live streams, videos, educational materials, and any communication through my platforms, you acknowledge and accept that all trading decisions you make are at your own risk. BDRipTrades, BDelCiel, and Aligned & Wealthy LLC cannot and will not be held responsible for any trading losses you may incur.

Nasdaq analysis: 25-MAR-2025Good morning, trading community! Today's Nasdaq analysis is for you. Share your thoughts, ask questions, and let me help you grow.

NASDAQ The recovery has officially started.Nasdaq (NDX) has been trading within a 2-year Channel Up and with today's opening, it broke above the Lower Highs trend-line of February's Bearish Leg. Even though the confirmed bullish reversal signal technically comes above the 1D MA50 (blue trend-line), we already have the early bottom signals.
First and foremost, the 1D RSI rebounding from the same oversold (<30.00) level where all major Higher Lows of the Channel Up did (August 05 2024, April 19 2024, October 26 2023). Every time the price reached its -0.5 Fibonacci extensions following such bottoms. Also each Bullish Leg tends so far to be smaller than the previous.
As a result, targeting a +24% rise (-3% less than the previous Bullish Leg) at 23500 is a very realistic Target technically, as it is considerably below the -0.5 Fibonacci extension.
-------------------------------------------------------------------------------
** Please LIKE 👍, FOLLOW ✅, SHARE 🙌 and COMMENT ✍ if you enjoy this idea! Also share your ideas and charts in the comments section below! This is best way to keep it relevant, support us, keep the content here free and allow the idea to reach as many people as possible. **
-------------------------------------------------------------------------------
💸💸💸💸💸💸
👇 👇 👇 👇 👇 👇

Nasdaq market analysis: 24-MAR-2025Good morning! Happy New Week! Happy New Day! Here's your daily Nasdaq market analysis. Learn, grow, and trade wisely.

"NAS100 / US100" Index CFD Market Heist Plan (Day or Swing)🌟Hi! Hola! Ola! Bonjour! Hallo! Marhaba!🌟
Dear Money Makers & Robbers, 🤑 💰💸✈️
Based on 🔥Thief Trading style technical and fundamental analysis🔥, here is our master plan to heist the "NAS100 / US100" Index CFD Market. Please adhere to the strategy I've outlined in the chart, which emphasizes long entry. Our aim is the high-risk Red Zone. Risky level, overbought market, consolidation, trend reversal, trap at the level where traders and bearish robbers are stronger. 🏆💸"Take profit and treat yourself, traders. You deserve it!💪🏆🎉
Entry 📈 : "The heist is on! Wait for the MA breakout (20000) then make your move - Bullish profits await!"
however I advise to Place Buy stop orders above the Moving average (or) Place buy limit orders within a 15 or 30 minute timeframe most recent or swing, low or high level.
📌I strongly advise you to set an alert on your chart so you can see when the breakout entry occurs.
Stop Loss 🛑:
Thief SL placed at the recent/swing low level Using the 1H timeframe (19400) swing trade basis.
SL is based on your risk of the trade, lot size and how many multiple orders you have to take.
🏴☠️Target 🎯: 20800 (or) Escape Before the Target
🧲Scalpers, take note 👀 : only scalp on the Long side. If you have a lot of money, you can go straight away; if not, you can join swing traders and carry out the robbery plan. Use trailing SL to safeguard your money 💰.
"NAS100 / US100" Index CFD Market Heist Plan (Swing/Day) is currently experiencing a bullishness,., driven by several key factors.
📰🗞️Get & Read the Fundamental, Macro, COT Report, Geopolitical and News Analysis, Sentimental Outlook, Intermarket Analysis, Index-Specific Analysis, Positioning and future trend targets.. go ahead to check 👉👉👉
📌Keep in mind that these factors can change rapidly, and it's essential to stay up-to-date with market developments and adjust your analysis accordingly.
⚠️Trading Alert : News Releases and Position Management 📰 🗞️ 🚫🚏
As a reminder, news releases can have a significant impact on market prices and volatility. To minimize potential losses and protect your running positions,
we recommend the following:
Avoid taking new trades during news releases
Use trailing stop-loss orders to protect your running positions and lock in profits
💖Supporting our robbery plan 💥Hit the Boost Button💥 will enable us to effortlessly make and steal money 💰💵. Boost the strength of our robbery team. Every day in this market make money with ease by using the Thief Trading Style.🏆💪🤝❤️🎉🚀
I'll see you soon with another heist plan, so stay tuned 🤑🐱👤🤗🤩

Nasdaq analysis: 21-MAR-2025Good morning, traders! Today's Nasdaq analysis will help you achieve your trading goals. Let's work together towards success.

NAS100 Bullish Trend H4 confirms the change of character to bullish. Long here. Turn to bearish if the price is below 19.100.
The next target is 20.400–20.600.
Good luck!

Nasdaq insights: 19-MAR-2025Good morning, traders! As a seasoned price action trader, I'll share my Nasdaq insights to help you improve your trading skills.

Nasdaq analysis: 18-Mar-2025Good morning, trading community! Today's Nasdaq analysis is for you. Share your thoughts, ask questions, and let me help you grow.

NASDAQ Most critical 4H MA50 test in 7 months!Nasdaq (NDX) has been trading within a Channel Up since the July 11 2024 High. The price action since the February 18 2025 High was been the patterns Bearish Leg and like the August 05 2024 bottom on the Higher Lows trend-line, it was done on an oversold (<30.00) 1D RSI.
Now that the price has Double Bottomed and bounced, it came across today with a 4H MA50 (blue trend-line) test. 7 months ago it was that test and eventual break-out that initiated Nasdaq's 4-month non-stop rise. Initially once broken, the first target was just below the 0.786 Fibonacci retracement level.
As a result, you can get a confirmed buy signal once the index closes above the 4H MA50 and target 21450 (just below the 0.786 Fib).
-------------------------------------------------------------------------------
** Please LIKE 👍, FOLLOW ✅, SHARE 🙌 and COMMENT ✍ if you enjoy this idea! Also share your ideas and charts in the comments section below! This is best way to keep it relevant, support us, keep the content here free and allow the idea to reach as many people as possible. **
-------------------------------------------------------------------------------
💸💸💸💸💸💸
👇 👇 👇 👇 👇 👇

Nasdaq market analysis: 17-MAR-2025Good morning! Happy New Week! Happy New Day! Here's your daily Nasdaq market analysis. Learn, grow, and trade wisely.

DIA ETF, just wait a little more to buy!European investors pulled money from U.S. equity ETFs in February for the first time since May 2023, showing a stark contrast with their American counterparts.
U.S. equity ETFs based in Europe recorded $514.7 million in outflows during February, according to Morningstar Direct data. This reversal came despite an increase in overall European ETF inflows to $35.3 billion during the same period.
finance.yahoo.com
