NASDAQ 4H Buy signal within the Channel Up.Nasdaq (NDX) is breaking above the 4H MA50 (blue trend-line) again following a Bullish Cross on the 4H MACD and it needs a 4H candle closing above it in order to confirm the continuation of this bullish move.
If confirmed, it will technically be the extension of the new bullish leg of the short-term Channel Up towards its top (Higher Highs trend-line). As you can see, both previous bullish legs have started right before a 4H MACD Bullish Cross and since the price already bottomed on the Higher Lows trend-line and the 4H MA100 (green trend-line), we have a strong mix for a buy signal, which is just waiting for the above mentioned confirmation. Our target is Resistance 1 at 15930, which will be a +5.30% rise from the bottom, similar to the previous two.
-------------------------------------------------------------------------------
** Please LIKE 👍, FOLLOW ✅, SHARE 🙌 and COMMENT ✍ if you enjoy this idea! Also share your ideas and charts in the comments section below! **
-------------------------------------------------------------------------------
💸💸💸💸💸💸
👇 👇 👇 👇 👇 👇
Nasdaqsignals

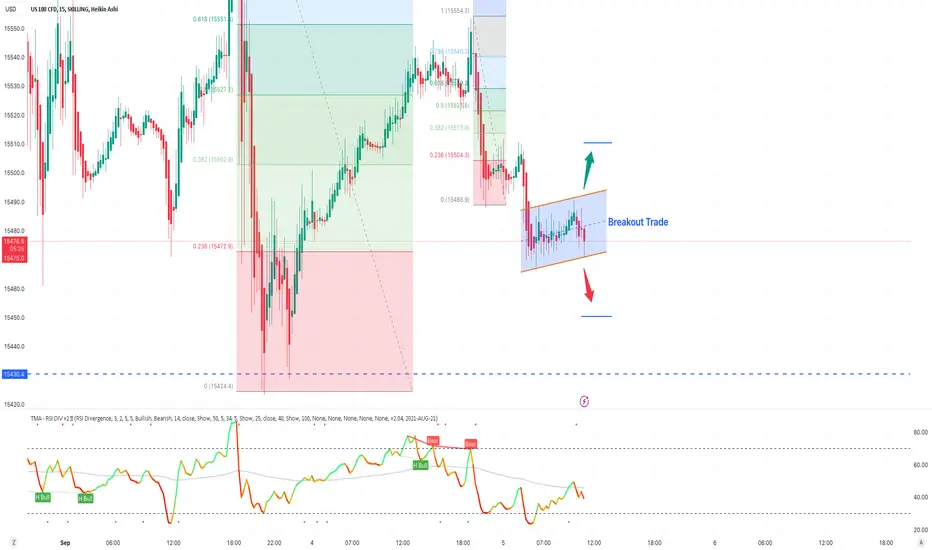
BTCUSD Parallel Channel Breakout TradeNASDAQ wait for breakout and trade in the direction of breakout or place your buy and sell stop.
Manage your risk according to account size!

NAS100 Double BottomNASDAQ forming a double bottom on 15min time frame with bullish divergence.
Manage your Risk!

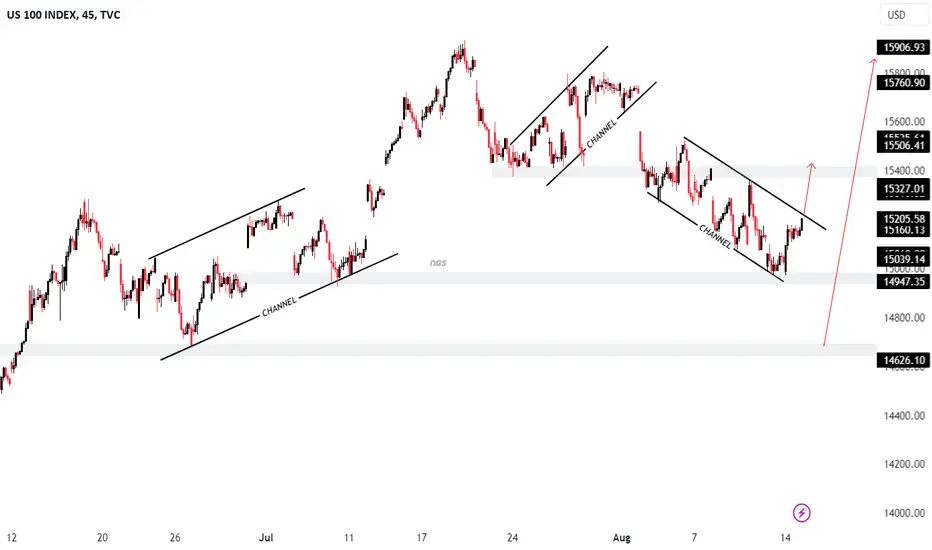
NASDAQ Parallel Channel Breakout TradeNASDAQ wait for breakout and trade in the direction of breakout or place your but and sell stop.
Manage your risk according to account size!
NASDAQ Breakout Long! NASDAQ broke the
Resistance cluster of the
Falling and horizontal level of 15396.5
And the breakout is confirmed
Because the candles are closing above
the cluster so now
I am bullish biased
And I think that the Indices
Will go higher up !

NAS100 Anticipating a Reversal from Resistance ZoneHello traders, this is my view on NAS100.
NAS100 is likely to reverse from the resistance zone. I believe it will fall after taking out BSL (buy-side liquidity). The reason for this idea is that NAS100 has perfectly created an inducement at 15,930.90, near the weekly timeframe CoG (Center of Gravity) at 16,099, and then it fell. Now, it has returned again to create a buy trap for retail traders. I think it will fall strongly after hitting BSL, which is at 15,796 on the 1D timeframe and 15,926 on the weekly timeframe. I'm looking to short it from the range of 15,800 to 15,940.
"Please do support and engage with this analysis by giving it a follow and a like if you find it valuable. Your support helps us continue to provide insights into the market. Thank you!"

NAS - Incoming Short NAS is making a rising wedge with a 1 Hour divergence on the RSI and currently is also respecting its TF 4HR Resistance.
Shorts can be taken from the previous HL

NASDAQ All going according plan, ATH by the end of the year.Today we make an update on our 1W time-frame Nasdaq (NDX) outlook on the analysis we published 2 weeks ago:
So far the price action is materializing our projection, as the index priced a bottom near the 1D MA100 (red trend-line) two weeks ago and is rebounding aggressively, in similar fashion as the September 2020 fractal. Similar 1W MACD Bearish Cross and more importantly similar 1W RSI rebound within same Rectangle levels.
If the pattern continues to be repeated, then a marginal breach of the 0.786 Fibonacci could deliver a new sharp pull-back to the 0.236 Fib. Weekly candle closings above it should keep investors interest intact and resume the uptrend, eventually to the 1.786 Fib extension and the 16770 All Time High. We are expecting this to take place towards the end of the year.
-------------------------------------------------------------------------------
** Please LIKE 👍, FOLLOW ✅, SHARE 🙌 and COMMENT ✍ if you enjoy this idea! Also share your ideas and charts in the comments section below! **
-------------------------------------------------------------------------------
💸💸💸💸💸💸
👇 👇 👇 👇 👇 👇

NASDAQ100 LOND TERM SELLING IDEA Hello Traders
In This Chart NASQAD100 HOURLY Forex Forecast By FOREX PLANET
today NAQI00 analysis 👆
🟢This Chart includes_ (NASQAD100 market update)
🟢What is The Next Opportunity on NAQ100 Market
🟢how to Enter to the Valid Entry With Assurance Profit
This CHART is For Trader's that Want to Improve Their Technical Analysis Skills and Their Trading By Understanding How To Analyze The Market Using Multiple Timeframes and Understanding The Bigger Picture on the Charts

Nas100 Analysis. Will it continue fall?Hello Everyone i want share my idea about Nas100.
In my last idea my price prediction was short ( i will link that in this post) the reason was it touch to 2022 weekly resistance which was pretty strong then retest is and broke daily support 1. Overall to nas100 i am looking bullish but at high timeframe, but at the moment what we have is a new low of trend which i think continue fall but i will try to find open long position from daily support 2, if it will brake then we have more strong support area which is weekly trendline, weekly Fibonacci and Daily support 3.
At the moment my price prediction still short and i will try short next week if i will see pullback at daily support 15250 LVL, but we need to be carefully because next week will be more crazy for us, we have lot of news which actually show us real moment of market.
Be patient!!!

NASDAQ Short Term Sell IdeaH4 - Bearish trend pattern followed by a potential double wave correction.
No opposite signs.
I expect the price to move lower further in the short term until the two strong resistance zones hold.

NASDAQ Breakout TradeNASDAQ wait for breakout and trade in the direction of breakout or place your but and sell stop.
Manage your risk according to account size!

NQ Outlook and Trade Ideas for the WeekNQ Outlook and Trade Ideas for the Week
Everything presented in the chart.
I don't want to overcomplicate it.


upcoming short In Nasdaq/ US100In the upcoming week, I will continue searching for potential short opportunities. I am also interested in Nasdaq to trade in weekly FVG

NASDAQ 23-08 MovePair : US100 - NASDAQ
Description :
Support Level
Completed " 1234 " Impulsive Wave
Bearish Channel in STF as an Corrective Pattern
Break of Structure
Divergence - RSI

NASDAQ US100 15-08 MovePair : NASDAQ - US100
Description :
Bearish Channel in Short Time Frame as an Corrective Pattern
Break of Structure
RSI - Divergence
Demand Zone
Completed " 1234 " Impulsive Wave
Nasdaq US100 UStech NDQ100 76%w 4hr SHORT4hr Strategy 76%w 9:1 RR NDQ100 EIGHTCAP
TP 15432 1.64 avg all
TP 15349 2.19 win
Possible resistance at 15500
If 15432 is closed below at end of day, DAILY DOWN TREND CONFIRMED, NEW SHORT OPPORTUNITY

Nas100 M30Prices has tested my rb-trade zone
Looking for price to reject targeting 150points on the US-Open
BUY LIMIT -15000
TP 15150 🔥

NAS sell on US session?PEPPERSTONE:NAS100
Hey, today with something special
This idea will be ICC based so lets get into it
How u can see trade from yesterday on nas was 0 drawdown so hope today will be same
For valid trade price cant go over last high whats around 15230.
Then we want to see break of last low and close candle under it
SL can be on last high. For TP1 we will be reaching last low (15100) candle close (15080) wick
Around this zone we can close partials or watch what price do, if we break under we can hold until new low will be made
Just wait for US Session
I took 2 trades like this on nas with high reward so i hope nas make the same move even when i share it with you.
Shoutout to SCI

NASDAQ hit the 1D MA50 for the first time since March!It's been almost 1 month since we last gave a signal on Nasdaq (NDX), hitting the 15900 target (chart below):
The setting is different now, as the index hit yesterday its 1D MA50 (blue trend-line) for the first time in almost 5 months (since March 15). This isn't a buy signal yet as yesterday's 1D candle closed marginally below it. Another candle closing below it, will be a sell signal targeting the bottom of the long-term Channel Up pattern and Support 2 at 14690. That will be an excellent buy entry (target 15950) but will be invalidated if the price closes a 1D candle below the 1D MA100 (green trend-line), in which case we will sell again and target Support 3 at 14240.
If however we get a 1D candle close above the 1D MA50 before a second below it, we will buy instead and target the 15950 Resistance, as in that case it will look like the March 13 bottom fractal.
-------------------------------------------------------------------------------
** Please LIKE 👍, FOLLOW ✅, SHARE 🙌 and COMMENT ✍ if you enjoy this idea! Also share your ideas and charts in the comments section below! **
-------------------------------------------------------------------------------
💸💸💸💸💸💸
👇 👇 👇 👇 👇 👇

NDQ100 DAILY SIGNAL sell 75%w PF36.99 12.5RR Signal was initiated on the Daily NDQ100 NASDAQ
FRIDAY 8-3 at the CLOSE
Typical trade 8 days
TP @15 170
TP @ 15070

NASDAQ UpdateAUDUSD testing strong support area again, let's wait if support breaks or resist from the area.
Manage your risk according to account size!
