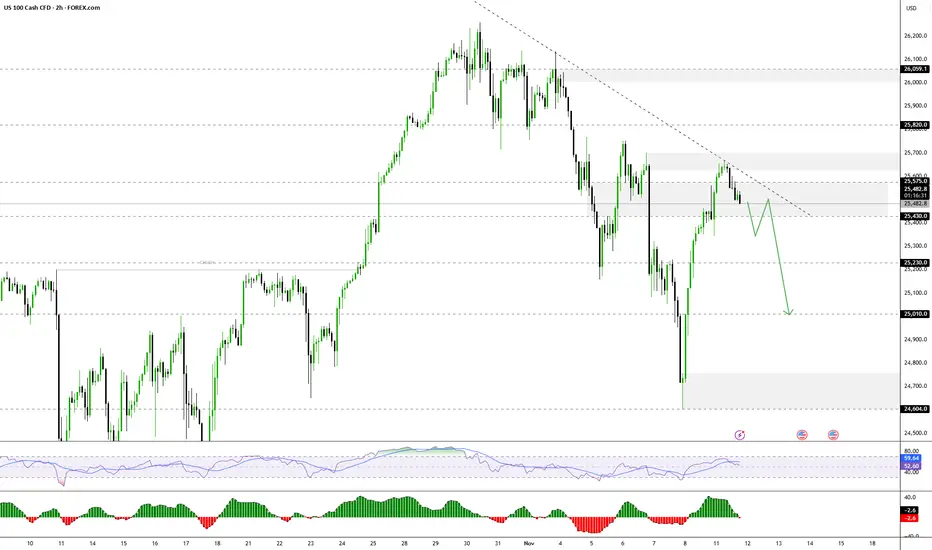
Nasdaq Potential for Further CorrectionThe NASDAQ index currently appears to be in a short-term correction, with the price likely to retest 25430 from 25570 before further movement.
- Above 25430–25575: Bullish continuation towards 25700 → 25820 → 25960.
- Below 25430: Bearish momentum is likely towards 25230 → 25010.
Nasdaqsignals
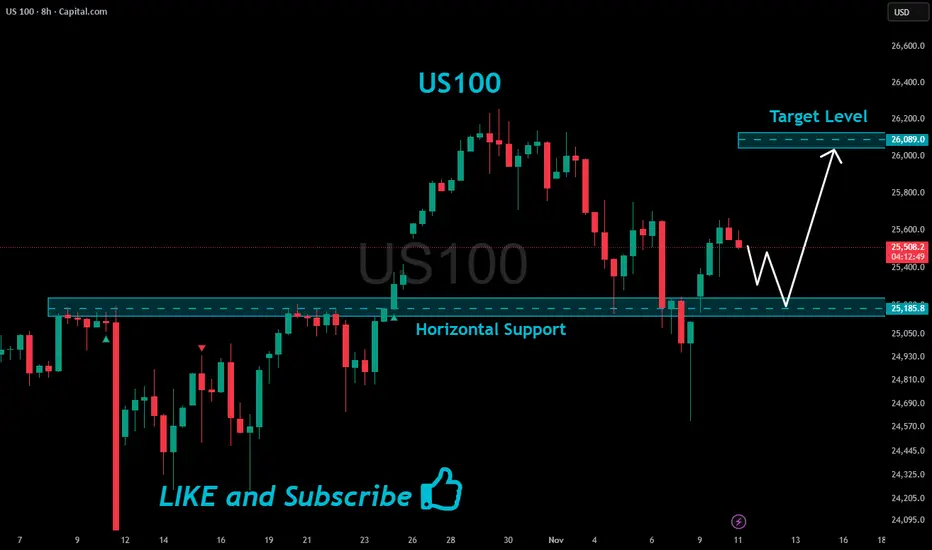
US100 Support Ahead!
HI,Traders !
#US100 is making a local
Bearish correction but
We are bullish biased mid-term
So after the pair hits the horizontal
Support of 25185.8 we will be
Expecting a local bullish rebound !
Comment and subscribe to help us grow !
NAS100 Trade Set Up 1500 pips secured!Price manipulated first above London highs to then come down and sweep SSL/London lows then CISD on the 15m with a retest to buy up to full tp5 1500 pips

NAS100 Trade Set Up Nov 10 2025Price has shifted to bullish structure on the 1h so i will wait for price to sweep SSL or tap into bullish 1h FVG before looking for buys to target higher BSL

NASDAQ Excellent rebound on the 1D MA50. Bullish.Nasdaq (NDX) has been trading within a 6-month Channel Up and last Friday made another 1D MA50 (blue trend-line) test exactly at the bottom (Higher Lows trend-line) of the pattern, and rebounded.
This has market the last two bottoms of the Channel Up and kickstarted the Bullish Legs, which have both been at +9.59%. As you realize, this it technically the pattern's strongest Support and most optimal buy entry for the medium-term.
We expect at least another +9.59% rally on the emerging Bullish Leg, targeting 26950.
-------------------------------------------------------------------------------
** Please LIKE 👍, FOLLOW ✅, SHARE 🙌 and COMMENT ✍ if you enjoy this idea! Also share your ideas and charts in the comments section below! This is best way to keep it relevant, support us, keep the content here free and allow the idea to reach as many people as possible. **
-------------------------------------------------------------------------------
💸💸💸💸💸💸
👇 👇 👇 👇 👇 👇

Nasdaq Battle between correction & innovationNASDAQ 100 (NDX)
Nasdaq 100 Index (NDX) currently sits at a crucial inflection point, defined by the overwhelming dominance of the technology sector's structural growth against a backdrop of increasing macroeconomic and technical vulnerability. After a historic rally driven by Artificial Intelligence (AI) euphoria, the market is undergoing a necessary and sharp correction, testing key support levels established during the latest bullish surge.
The Durable Foundation: AI, Earnings, and Profitability
The core bullish case for the NDX remains robust, fundamentally driven by the "Magnificent Seven" and the pervasive, non-negotiable surge in AI infrastructure spending. Unlike the speculative rallies of previous cycles, today's leaders are characterized by deep profitability, substantial cash flow, and diverse revenue streams.
Recent corporate earnings reaffirm this strength, with the technology sector posting strong double digit growth. This profitability suggests that investment in AI is being funded through internal cash flow, making the rally more sustainable than the debt fuelled expansion seen two decades ago. The long term trajectory is further supported by an accommodative Federal Reserve pivot, which is now in rate cutting mode a supportive contrast to the tightening cycle that ended the 2000 rally. The secular trend of technological innovation is accelerating, transforming AI from a growth narrative into an essential business imperative.
Macroeconomic and Sentiment Headwinds
Despite underlying corporate strength, recent market action signals a decisive sentiment shift rooted in macro uncertainty and high valuations. The index has experienced its steepest weekly decline since March, indicating heavy profit taking and a collective "reality check" among traders.
Several factors are contributing to this sentiment reversal:
1. Concentration Risk: The sheer weight of the largest components now represents an extraordinary percentage of the overall market capitalization, making the NDX acutely sensitive to volatility in just a few key names.
2. Labor Market Cooling: Data showing a significant spike in job cuts (particularly in the tech and warehousing sectors) has unsettled investors, suggesting that economic cooling is accelerating faster than anticipated.
3. Consumer Confidence: A sharp drop in consumer sentiment reflects heightened anxiety related to economic uncertainty and political instability, which historically dampens forward looking market optimism.
4. Valuation Concerns: While not at 2000 extremes, valuations remain elevated, shifting the market’s focus entirely from multiple expansion to demanding flawless execution and continuous earnings growth.
Technical Outlook: The Critical 25,000 Support Test
From a technical perspective, the NDX has been in a clear, rising trend channel over the medium to long term, confirming a persistent buy the dip mentality. However, the recent sell off has introduced significant short term caution.
The index is currently testing a non negotiable support zone around 25,000. This level is psychologically important and corresponds to a previous major breakout point. A decisive breakdown below this support could trigger a cascading sell off as automated stop loss orders are activated, potentially paving the way toward the next major supports at 24,500 and, more critically, 23,980.
Key Technical Levels:
• Immediate Support: 25,000
• Secondary Supports: 24,500, then 23,980
• Immediate Resistance: 25,200, followed by 25,500 and 25,700
Conclusion: Navigating the Volatility
Nasdaq 100 remains an index of unparalleled innovation and long term potential, yet its short term path is fraught with risk. The outlook hinges on the NDX's ability to hold the critical 25,000 support level. A bounce from this zone would confirm the resilience of the dip buyers and maintain the medium term bullish structure. Failure to hold this level, however, would signal a deeper technical correction is underway, shifting the focus to the lower support zones as the market cleanses its excessive exuberance. Traders should remain nimble, respecting the clear shift in short term momentum while maintaining conviction in the long term, secular growth of the technology giants.

Nasdaq - The most important structure!💰Nasdaq ( TVC:NDQ ) perfectly respects structure:
🔎Analysis summary:
Over the course of the past couple of months, the Nasdaq has been rallying an expected +50%. Still, until the Nasdaq will retest the upper channel resistance trendline, this rally won't be over. Therefore, we can still see a rally of another +10% in the very near future.
📝Levels to watch:
$25,000 and $30,000
SwingTraderPhil
SwingTrading.Simplified. | Investing.Simplified. | #LONGTERMVISION

NAS100 1500 pips secured!Set up played out perfectly, breaking structure to during London session, sweep BSL, followed by internal IFVG to target 1500 pips

NAS100 Trade Set Up Nov 7 2025Price remains bearish so i will only looking for sells either after price sweeps internal BSL or London highs BSL before looking for 1m-5m IFVG/CISD to take sells to lower SSL levels

NAS100 Trade Set Up Nov 6 2025Price is bullish making HH/HL on the 1h and BOS of the Asia range so i will wait for price to sweep internal SSL and/or tap into 1h FVG to then look for 1m-5m IFVG/CISD to take buys to PDH and daily FVG to fill the imbalance

Nasdaq NAS100 Bulls Regain Control: What I’m Watching Next📈 On the 4-hour NASDAQ chart, we can clearly see a break in structure to the upside, signaling strong bullish momentum entering the market. 🟩 The buyers are showing strength, and I’ll be looking to capitalize on this momentum — but only if we see a confirmed break of the current swing high, followed by a retracement into the retest zone. 🔁
However, patience is key. ⏳ I’ll only look to engage if today’s New York session data release aligns with and supports the bullish bias. Fundamentals and technicals must work together before I take a position.
As mentioned in the video, if the anticipated price action fails to materialize, we’ll simply abandon this setup and move on — staying disciplined is crucial. 🚫
⚠️ Disclaimer: This analysis is for educational purposes only and not financial advice.

Nasdaq 100 – A Quiet Accumulation Before the Next PushThe Nasdaq 100 (US100) is showing early signs of a structural rebalancing after the recent correction. Price is currently hovering near 25,600, retracing modestly after a short-term rebound from the 25,280 demand zone — a level where Smart Money seems to have re-entered quietly.
💭 1️⃣ Market Structure – A Story of Displacement and Repricing
The current chart reveals a clear Break of Structure (BOS) followed by a corrective pullback.
After the previous sell-off, price found support at the 25,280 – 25,300 range — a discount zone aligning with both an order block and a trendline confluence.
This zone likely served as institutional demand, where Smart Money began accumulating long positions before the upward displacement.
The recent retracement, however, remains within a corrective structure, meaning we could still see one more liquidity sweep before the market decides its next major leg.
🩶 2️⃣ Supply & Demand Zones – The Footprints of Institutions
Karina is currently tracking three zones that matter most to the structure:
Demand Zone:
25,280 – 25,300: The base of institutional accumulation and current structural support.
Supply Zones:
25,970 – 26,160: A major bearish order block where Smart Money previously distributed positions — likely the next liquidity target.
The most probable scenario: a retest of the lower demand → a liquidity grab → bullish displacement toward 25,970 – 26,160 → reversal back to equilibrium.
🧭 3️⃣ Liquidity Flow – The Path of Least Resistance
Above the current range lies buy-side liquidity resting at 26,000+, while below, sell-side liquidity has already been swept near 25,280.
This suggests that the next move could be an engineered push upward — designed to collect liquidity above 25,970 – 26,160 before potential continuation back into the demand zone.
Such a move would mirror the classic SMC liquidity cycle:
Accumulate → Displace → Manipulate → Distribute.
🌙 4️⃣ Trading Outlook – Patience Before Precision
Karina’s bias for the day is moderately bullish, anticipating a short-term expansion toward the upper liquidity pool.
However, she remains cautious — waiting for confirmation near the demand zone before entering long.
Buy Idea:
Entry: 25,280 – 25,300
Stop Loss: below 25,200
Target 1: 25,970
Target 2: 26,160
If the liquidity sweep at 26,160 completes, Karina expects a controlled retracement — a potential short setup back into equilibrium around 25,400.
🌷 5️⃣ Reflection – When the Market Whispers, Smart Money Listens
The chart right now feels calm, methodical — like the quiet before a decisive wave.
Smart Money rarely rushes. It absorbs, manipulates, and moves when most traders stop paying attention.
For Karina, this is one of those moments where patience becomes the most powerful strategy.
The next move will not be random — it will be precise, intentional, and elegant, just like the rhythm of liquidity itself 🌙
This analysis reflects Karina’s personal perspective and is not financial advice.
How do you see the US100’s next move? Is Smart Money gearing up for another liquidity sweep above 26k? Let’s discuss below 💬

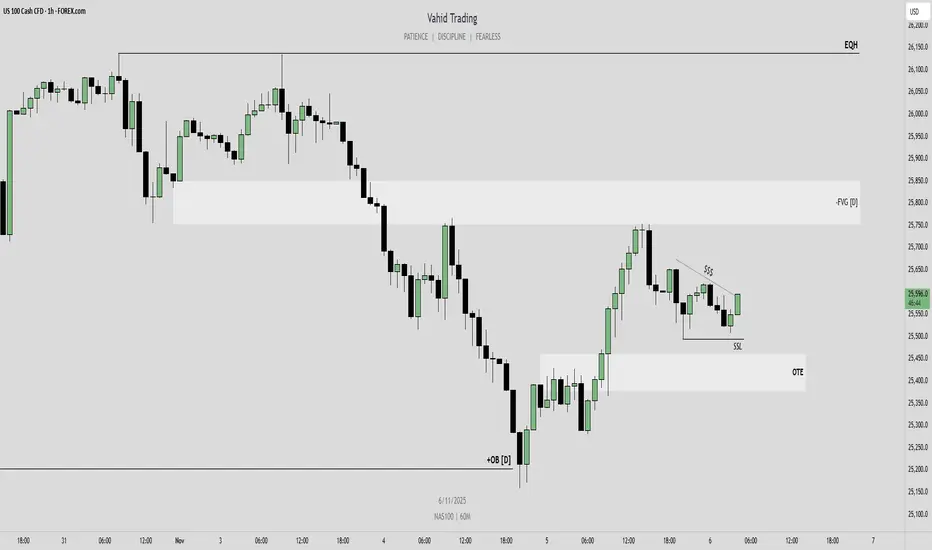
US100 – Bullish Continuation in Play After Daily OB ReactionHello traders,
On the 1-hour chart, NASDAQ (US100) has reacted strongly from the bullish Daily Order Block, showing clear signs of higher-timeframe strength. This reaction suggests that the bullish order flow is still intact.
With this structure in mind, I expect the upward move to continue toward the bearish Daily Fair Value Gap, which serves as my first target.
My final target for this bullish leg is the equal highs around 26,136, where a significant liquidity pool rests.
However, before the next expansion higher, I would prefer to see price move lower to sweep the liquidity below the recent lows and trade into an Optimal Trade Entry (OTE) zone. From there, I’ll look for lower-timeframe confirmation to catch the next leg up.
Staying bullish unless higher-timeframe invalidation occurs.
💌It is my honor to share your comments with me💌
🔎 DYOR
💡Wait for the update!
NAS100 Trade Set Up Nov 5 2025Price remains under bearish pressure as long as price respects this 4h FVG i will look for internal bearish structure on the 1m-5m to take sells to SSL/Asia lows

NAS100 Forecast: A Fresh Bullish Impulse Toward New HighsThe NAS100 index is currently moving within a classic Elliott Wave structure. After completing wave (3), the market entered a correction phase that formed wave (4). This correction appears to have ended in the highlighted support zone, where buyers stepped in strongly. The five-wave pattern before wave (4) confirms a solid bullish trend. Now, the index seems to be preparing for the final upward move wave (5). This wave often represents the last push of a rally before a larger correction starts. As long as the price stays above the recent support near 24,400 , the next targets could be seen around 25,200–25,600 . In simple terms, the market is expected to continue its uptrend after a short pullback, following the typical Elliott Wave sequence of five upward waves and three corrective ones.

NAS100 | Bearish Momentum Extends The Nasdaq 100 fell about 2.1% (~500 points) as projected, maintaining a bearish outlook while technology stocks continued to weigh on market sentiment.
Below 25,700: Bearish continuation towards 25,340 → 25,230 → 25,000.
Above 25,700: Short-term recovery towards 25,820 → 26,170.

NAS100 Trade Set Up Nov 4 2025Price is bearish making LH/LL on the 1h and 15m, has already swept BSL/London highs and inverted 15m FVG so i will be looking for sells down to SSL/London lows

NAS100 Trade Set Up Nov 3 2025If price trades into PDH first i will wait for internal bearish structure to catch sells down to SSL/London Lows but if price comes to test 1h FVG first and respects it i will look for internal structure to catch buys to PDH

NASDAQ Channel Up still stands buy needs a pull-back.Nasdaq (NDX) reached the top of its 5-month Channel Up and got rejected. It completed a +9.59% rise from the last 1D MA50 (red trend-line) bottom (Higher Low for the pattern), similar to the previous Bullish Leg.
The maximum a Bullish Leg has increased by inside this pattern is +10.87%. As a result, either now or just above it, the pattern would require a technical pull-back. The most usual buy signal is on its 4H MA200 (orange trend-line) and the most effective when the 4H RSI breaks below its oversold (30.00) barrier.
Our next Buy Zone is within the 0.382 - 0.5 Fibonacci retracement range.
-------------------------------------------------------------------------------
** Please LIKE 👍, FOLLOW ✅, SHARE 🙌 and COMMENT ✍ if you enjoy this idea! Also share your ideas and charts in the comments section below! This is best way to keep it relevant, support us, keep the content here free and allow the idea to reach as many people as possible. **
-------------------------------------------------------------------------------
💸💸💸💸💸💸
👇 👇 👇 👇 👇 👇

Are Institutional Buyers Returning to NASDAQ100 Again?🎯 NASDAQ100 Blueprint: The Thief's Ultimate Heist Setup 💰
📊 Asset Overview
NASDAQ:NDX | US100 Index
Market Capital Flow Analysis - Swing Trade Setup
🔍 Technical Foundation
Bias: 🐂 BULLISH CONFIRMED
The LSMA (Least Squares Moving Average) breakout has painted the perfect picture. When institutional money flows align with technical breakouts, you know the smart money is positioning for the next leg up.
Current Market Structure:
We're witnessing a textbook bullish continuation pattern with strong momentum building above key moving averages. The index is showing resilience at support zones while eyeing psychological resistance levels ahead.
💎 The Thief's Layered Entry Strategy
Entry Philosophy: "Why catch one knife when you can catch four?" 😏
This is classic Thief-style layering - multiple limit orders spread across strategic price zones to build a position with optimal average entry:
Entry Layers (Limit Orders):
🎯 Layer 1: 24,800
🎯 Layer 2: 25,000 (Psychological level)
🎯 Layer 3: 25,200
🎯 Layer 4: 25,400
Pro tip: You can add more layers based on your risk appetite and capital allocation. Scale in gradually, not aggressively.
Alternative: If you prefer simplicity, you can enter at current market price - but layering gives you the edge when volatility strikes.
🛡️ Risk Management
Stop Loss Zone: 24,600
⚠️ Important Notice: Dear Ladies & Gentlemen (Thief OG's), this SL is MY reference point based on market structure. You are the captain of your own ship - set your stop loss according to YOUR risk tolerance and account size. Trade at your own risk!
🎯 Profit Target
Primary Target: 26,000
Why this level?
Strong historical resistance zone
Overbought territory on multiple timeframes
Potential bull trap formation area
Confluence with Fibonacci extension levels
⚠️ Exit Strategy Note: Dear Ladies & Gentlemen (Thief OG's), this TP is MY analysis. When YOU see green, YOU decide when to bank it. Take profits incrementally if you prefer safety over maximum gains. Remember: Pigs get fat, hogs get slaughtered! 🐷
🔗 Correlated Assets to Watch
These pairs move in tandem with NASDAQ100 - keep them on your radar:
📈 SP:SPX (S&P 500): The big brother index - when SPX moves, NQ100 often follows
📈 NASDAQ:QQQ (Nasdaq ETF): Direct tracking vehicle for tech-heavy momentum
📈 NASDAQ:AAPL (Apple Inc.): Largest NASDAQ component - heavy influence on index direction
📈 NASDAQ:MSFT (Microsoft): Tech titan with significant index weighting
📈 NASDAQ:NVDA (NVIDIA): Semiconductor leader driving AI narrative
📈 NASDAQ:TSLA (Tesla): High-beta play that amplifies NASDAQ moves
📈 TVC:DXY (US Dollar Index): Inverse correlation - strong dollar often pressures tech stocks
📈 TVC:TNX (10-Year Treasury Yield): Rising yields = tech pressure; falling yields = tech rally
Key Correlation Insight: Tech stocks (and thus NASDAQ) typically benefit from falling yields and weakening dollar conditions. Monitor these macro factors!
⚡ Key Technical Points
✅ LSMA breakout confirms bullish momentum shift
✅ Volume profile suggests accumulation at current levels
✅ Multiple timeframe alignment (swing trader's dream)
✅ Risk-reward ratio favors long positioning
✅ Institutional money flow indicators turning positive
⚠️ Watch for: Volatility spikes near resistance, macro news events, and Federal Reserve commentary that could impact tech valuations.
🎭 The Thief's Final Words
"In the market, you're either the heist mastermind or the one getting robbed. Choose wisely." 😎
This setup is designed for swing traders who understand that patience and proper position sizing beat FOMO every single time. Layer in, manage risk, and let the market come to you.
Remember: This isn't financial advice - it's a roadmap drawn by someone who respects the market's ability to humble even the best of us.
📢 Community Support
✨ If you find value in my analysis, a 👍 and 🚀 boost is much appreciated — it helps me share more setups with the community!
#NASDAQ100 #US100 #NQ100 #SwingTrading #TechnicalAnalysis #LSMA #LayeredEntry #ThiefStyle #IndexTrading #BullishSetup #RiskManagement #TradingStrategy #MarketAnalysis #PriceAction #SupportAndResistance #TradingIdeas #StockMarket #ForexTrading #DayTrading #TradingCommunity

iShares Semiconductor ETF Eyes Bullish Continuation🚀 SOXX Breakout Play — Swing/Day Trade Setup 🎯
Asset: SOXX – iShares Semiconductor ETF
Playbook Type: Fund ETF Market Profit Playbook
Plan: 🔥 Bullish Plan (Swing/Day Trade Setup)
⚡️ Entry Plan
Looking for long entries after a confirmed breakout above $292.50.
Once this resistance gives way, momentum traders may pile in — that’s where our profit zone starts heating up! ⚙️
🛡️ Stop-Loss (Risk Control)
Stop Loss: $277.50 — a.k.a. The Thief SL.
Dear Ladies & Gentlemen (Thief OG’s) 👑 — I’m not recommending you to use only my SL. It’s your call, your risk, your money. Manage like a boss. 💼
💰 Profit Target
Target: $308.00 — this level sits near a strong resistance zone where the market might turn overbought or trap late buyers.
Be smart. Escape with profits before the herd does. 😎
Again, Thief OG’s — my TP is just my view. You decide when to take your money and run. 💸
🔗 Correlated Assets to Watch
Keep your eyes on these key players — they often front-run SOXX moves or confirm direction:
SMH (VanEck Semiconductor ETF) → Often mirrors SOXX behavior.
NASDAQ:SOX (Philadelphia Semiconductor Index) → Sector index — leads ETF flow.
NVDA / AMD / TSM → Chip giants that heavily influence ETF weight.
QQQ → Tech sentiment gauge; if NASDAQ rallies, SOXX gets wings.
💡 Tip: When NVDA and SMH break resistance together, SOXX rarely stays quiet — momentum usually follows fast.
⚠️ Key Watchpoints
Always confirm breakout volume before entry.
Keep an eye on macro headlines — rate decisions, chip demand, or supply chain data can shift the tone fast.
Protect profits once RSI hits overheated zones near the upper channel.
🧠 Thief Trader Mindset
This setup isn’t about guessing — it’s about waiting for confirmation, reacting fast, and locking profits like a pro thief in daylight. 🕶️
✨ “If you find value in my analysis, a 👍 and 🚀 boost is much appreciated — it helps me share more setups with the community!”
Disclaimer: This is a thief-style trading strategy just for fun. Always trade responsibly and at your own risk.
#SOXX #Semiconductors #ETF #BreakoutTrade #SwingTrade #DayTrade #TechSector #TradingView #TradeIdea #ThiefTrader #RiskManagement #MarketPlaybook

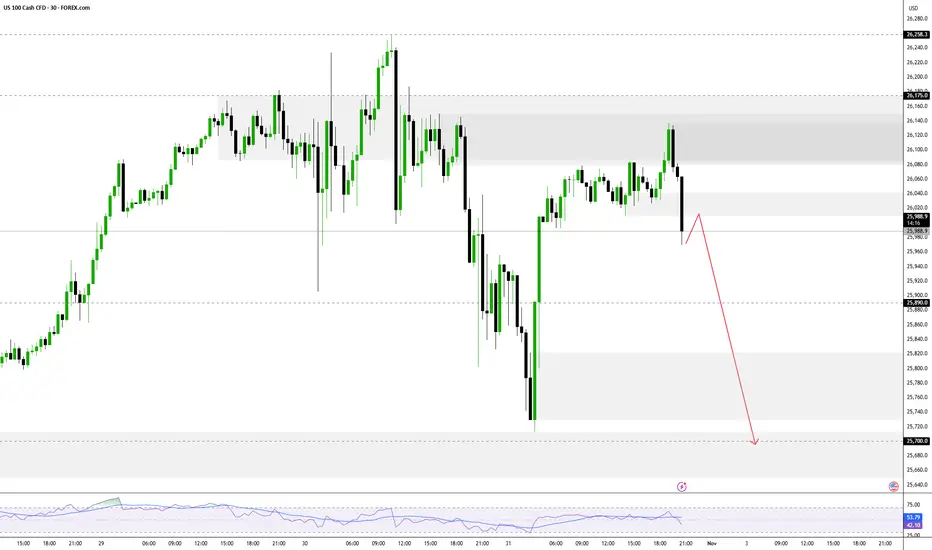
Reversal From ATH, Momentum Turns Cautious Reversal From ATH, Momentum Turns Cautious
The NASDAQ reversed from its all-time high and remains below 26,175, signaling short-term bearish momentum.
➡️ Below 26,175: Bearish bias toward 25,890 → 25,700 → 25,340.
➡️ Above 26,245: Bullish continuation toward 26,500 → 26,850.
Pivot POINT: 26,175
Support: 25,890 · 25,700 · 25,340
Resistance: 26,500 · 26,850 · 27,000
USNAS100 remains bearish while below 26,175, but a 1H close above 26,245 would confirm a bullish breakout toward higher targets.
NAS100 Trade Set Up Oct 31 2025Price is forming HH/HL on the 1h so could be bullish but on the 4h its still bearish so i want to see either a sweep of EQH to then form internal 1m/5m bearish structure to target SSL or a sweep of SSL first to then target EQH
