US100 Index – Potential Bearish Reversal in Key Resistance Zone🧠 US100 Index – Potential Bearish Reversal in Key Resistance Zone
Timeframe: 30-Minute | Chart Published: July 24, 2025
---
🔍 Overview
The US100 (NASDAQ) has been trading in a well-structured ascending channel, forming higher highs and higher lows. However, recent price action suggests that the index is testing a critical supply zone near 23,400, with signs of weakening bullish momentum. This may signal a potential corrective phase or bearish reversal.
---
📈 Technical Analysis Breakdown
🔵 Trend Structure:
Price is respecting a clear ascending trendline (blue), connecting multiple higher lows.
Multiple bullish flag/channel formations have been completed within the uptrend, showing healthy momentum until the current point.
🟥 Resistance Zone:
Strong supply zone marked between 23,250 – 23,450.
Price action shows stalling candles and rejection wicks within this zone, indicating buyer exhaustion.
⚠ Bearish Patterns:
The red path projection suggests a head and shoulders-like structure forming at the top of the channel.
This, along with divergence in wave strength and shrinking momentum, supports a potential reversal.
🔵 Key Support:
First support lies around 23,000 — aligning with the ascending trendline and previous consolidation.
If broken, next demand zone is around 22,835 – 22,900, where historical consolidation took place.
---
🔁 Projected Scenario (as per visual path)
1. Price may attempt one last push into the 23,400–23,450 zone (possible false breakout).
2. Rejection from this level could trigger a fall toward the ascending trendline support.
3. A confirmed break of the trendline can lead to a larger correction toward the 22,800 zone.
---
🧠 Unique Insight
This chart combines multi-timeframe structure recognition with a real-time reversal formation inside a long-standing bullish trend. The analysis doesn’t just rely on textbook patterns—it recognizes real-time price behavior shifts, which makes it valuable for proactive traders.
---
📌 Conclusion
While the trend remains bullish overall, caution is warranted as the US100 approaches a historically significant resistance zone. The setup offers a compelling risk-reward short opportunity for aggressive traders, especially if the price confirms a break below trendline support.
---
🔧 Next Steps for Viewers
> “Watch for a clean rejection candle or lower high at resistance before entering short. If trendline breaks cleanly, 22,835 could be the next target zone.”
Nasdq100

SOXL — Buying on a Strong Uptrend with 30%+ Profit PotentialDirexion Daily Semiconductor Bull 3x Shares (SOXL) continues to move in a clear uptrend after breaking long-term resistance. Price is consolidating above the breakout level, indicating sustained interest from major market participants.
Long positions remain valid.
Profit targets:
First target — 39.85
Second target — 60.42
The setup offers over 30 percent profit potential. The semiconductor sector continues to lead the broader market higher.
Focus on trading with the trend. Adding on pullbacks is reasonable with proper risk management in place.

NAS100 - Stock Market Enters Downtrend?!The index is trading below the EMA200 and EMA50 on the four-hour timeframe and is trading in its descending channel. If the index moves down towards the specified demand zone, we can look for further buying opportunities in Nasdaq. A break of the channel ceiling will also continue the short-term upward trend in Nasdaq.
According to EPFR data reported by Bank of America, investors withdrew $2.8 billion from equity funds last week, marking the largest outflow of the year so far. Meanwhile, U.S. government bonds saw an inflow of $6.4 billion, the biggest weekly increase since August.
Scott Basnett, the U.S. Treasury Secretary, stated in an interview that there are no guarantees to prevent an economic recession. He welcomed the decline in stock markets, viewing it as a sign of a healthy market. Analysts believe this shift in tone—unusual for a Treasury Secretary who typically reassures economic strength—suggests an effort to prepare the public for a possible recession.
According to data from the Polymarket betting platform, the probability of a U.S. recession in 2025 is currently estimated at 41%. Reuters reports that American households are increasingly pessimistic about the economic outlook. However, the Federal Reserve may be reluctant to respond aggressively to a weakening economy, given growing concerns that the Trump administration’s trade policies could further fuel inflation.
These concerns were reflected in financial markets on Friday, as the University of Michigan’s consumer sentiment survey showed a decline in consumer confidence for March. Additionally, consumers now expect inflation to reach 3.9% over the next five years, the highest level in more than 30 years.
In an interview with Breitbart, Basnett emphasized the need to remain vigilant against persistent Biden-era inflation and expressed support for deregulation to lower costs. He also stressed that while tackling inflation, the government must also address affordability concerns. Additionally, he backed interest rate cuts to help reduce housing costs and auto loan payments.
This week will be packed with major economic events, creating a high-risk environment for precious metals traders amid ongoing geopolitical developments during Trump’s second term.
Central banks are back in the spotlight, as several key monetary institutions are set to announce their policy decisions in the coming days:
• Tuesday: Bank of Japan
• Wednesday: Federal Reserve
• Thursday: Swiss National Bank & Bank of England
Furthermore, a series of macroeconomic data releases could influence market sentiment, including:
• Monday: Retail sales & Empire State Manufacturing Index
• Tuesday: Housing starts & building permits
• Thursday: Weekly jobless claims, existing home sales & Philadelphia Fed Manufacturing Index
The Federal Reserve is expected to keep interest rates unchanged in its upcoming meeting. Market participants will closely watch the Fed’s updated economic projections and Jerome Powell’s press conference for insights into future monetary policy.
According to a Bloomberg survey, economists anticipate two rate cuts by the Fed this year, likely starting in September. However, despite declining stock indices and rising recession concerns, Powell is expected to maintain a cautious stance, avoiding any rushed rate cuts.
While consumer and business confidence has weakened, the Federal Reserve has limited flexibility to lower rates due to persistently high inflation indicators.

nasdaq lost iths fuellooking at the market today we see weeknes in daily.
even doe we are in th lower part of a intra/range i will put my odds in short.
speaicalley ibn daily analisis. i have a naked wick on 20,0009 so there we put i limit.
target in gren.
have fun

nasdaq look downsatoday in the market. in NQ futures we have a range above a a gap.
we seem to be trading below the mid point of the lower part of the range.
so we are looking for a short.
first entry in 19,842 with stop in red and target in green 19,760 first target and 2 target closing the gap at 19,612.
we seem to be having more selling preasure in the range we are at the moment.
embrace the loss to unlock the green days.

a big scalp on nasdaqThere is a chance that the Nasdaq will rise but first it has to eat the liquidity that is below

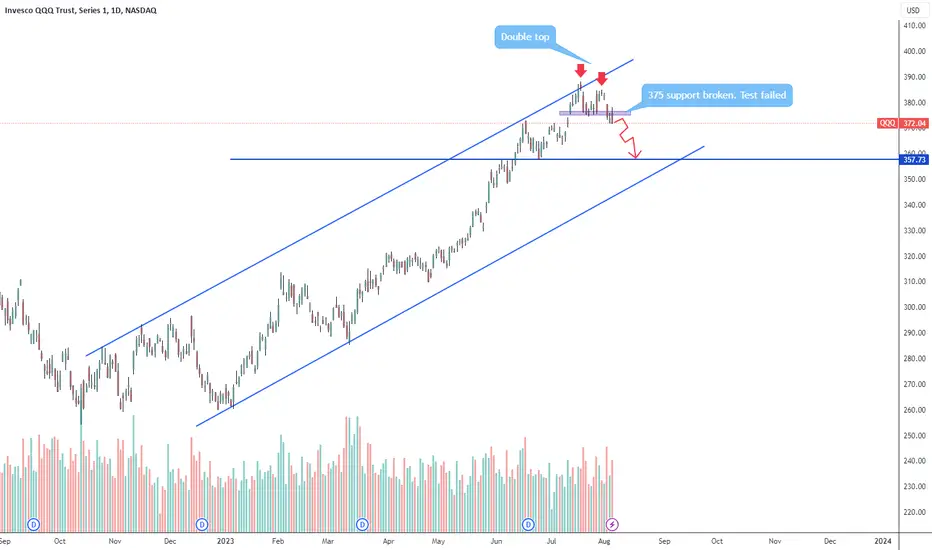
It's timeDouble top confirmed in the daily timeframe. I think we are going to see a correction towards the 360 zone. I'm not trading this, I haven't had much success trading indexes, I prefer stocks. It's very possible that bulls push the price again to the $375 zone now resistance. That's the thing with indexes, sometimes looks like a free fall but suddenly buyers come out from nothing and push the price up for a day or two and puts expire. Don't tell that never happened to you. I use this to see the sentiment of the market. Yesterday I bought a bunch of puts of AAL, MRNA, AMD, CROCS and TXN, all showing strong bearish patterns. At every pull back up I will buy more.
NAS100/ US100 Trend till the end of 23Cheers to all, Day traders and super professionals :)
My experience in trading is based on two assets: Gold and Nasdaq.
Today I would like to talk about Nasdaq and my feelings about it (not super deep chart analysis or patterns).
The US has done a very excellent job since the pandemic. In short, they did the following:
1. Marketing on how dangerous the pandemic is and you better stay home.
2. They printed some cash with giveaway options. :)
3. Marketing in the financial market and how strong it is against all rules of the Economy. (which made you think that you can become the most profitable traders of all time)
------------ They gave you money, and you're invested in the Stock market, Indicies, and Crypto. Im sure 80% of you guys were rich on paper.
Then one day we wake up noticing that inflation is going crazy. USD goes up and all the rest falls. But you baby traders keep Crypto/Stock/Indices somehow losing money which makes you think that this is a scam.
Unfortunately, the financial market is not Amazing which will guarantee you on-time delivery. So the bear market came 1 year later than it has to be with the inflation and crazy interest rate hikes. So the trust of the investors is now at the bottom (including the world conflict we have). But there is a beautiful thing I see same as with the pandemic (You have a fever - Covid, You want to sleep longer- Covid, You got horny - Covid). My point here is that it's all artificial and I can't believe that people that trying to control the world can't control their own inflation and their own market. In order to push the market you need fundamentals and the market was overbought in early 2021 (around 180% (who knows they know)) and what we face now is Perfectly scripted propaganda and normal correction of the market.
My idea is that US100 will come back down to retest the bottom and even can break previous lows. Then when everyone will say that the American dream becomes a nightmare that is the right time to buy. And for you guys who are 12 years old traders simple rule. - Interest rate hike means downtrend, - Interest rate cuts means uptrend for US100, US30, US500.
Once we reach the bottom we will look for opportunities of the Decade. Now we are reaching the interest rate level of 2007. Ask your dad what happened that time, and look on the charts to see what happened after Interest rate cuts.
Thanks!
UShort

NASDQAre we looking to bearish market continue?!
lets see how price will react after reaching the mounted levels of Fibo and previous support line
Its a great chance to take it, only if you manage your risk ratio.
UShort

Nasdaq 100 - Something feels terribly wrongOver the past few weeks, there were quite a lot of things happening - “the market bottom,” “crypto bottom,” “trend reversal,” and so on and on. Again, people rush to make hastily conclusions as the market turns from extremely bearish to fearful of missing out on the real primary trend reversal. Before the CPI, we came forward when QQQ stopped its decline 0.11$ above our price target of 260$ and said we would abstain from setting a price target and wait for the data to come out.
Yesterday's price action is exactly why we did that. The market participants' desire to see the market go higher after a horrible year of underperformance pumped up the Nasdaq 100 index by 7% before the market closed. However, the reality is that inflation continues rising, despite a small surprise in regard to analysts' expectations yesterday. Indeed, in our opinion, it makes no change for the FED, which will continue to tighten the economy further; merely, it will give it more room not to crash the economy right away.
This development comes as a temporary lifeline to the market, which is still seeing the unwinding of the FTX insolvency issues. The stock market and cryptocurrencies continue to see gains across the board today. Despite that, we can not unnotice that something is still terribly wrong; this applies to both the stock and cryptocurrency markets.
First, yesterday's move continues to be characteristic of the one in the bear market. For example, in the 2020 crash, there were at least three days with a daily range of more than 10% (for NQ1); examples are shown in Illustration 1.02. Second, volume declined dramatically toward the end of yesterday's session. In addition to that, the peg between the USD and Tether continues to be destabilized, despite retracing much of the move. This development worries us as it might foreshadow another “unexpected” event in the cryptocurrency market, which will also inadvertently affect the stock market. Therefore, we voice a word of caution as we are not yet convinced this is the market capitulation everyone has been waiting for. With that being said, we maintain our price target for NQ1! at 10 000$.
Illustration 1.01
The image above shows examples of down and up days during the 2020 crash before the FED cut rates to stop the drop.
Technical analysis - daily time frame
RSI, MACD, and Stochastic all turned bullish with the market bounce. DM+ and DM- performed a bullish crossover. Overall, the daily time frame is bullish; however, the trend is weak.
Illustration 1.02
Illustration 1.02 displays the declining volume prior to yesterday's close, which shows signs of exhaustion. We will pay close attention to whether it will be sufficient in the coming hours/days to sustain the rally.
Technical analysis - weekly time frame
RSI and Stochastic point to the upside. MACD tries to reverse to the upside. DM+ and DM- are all bearish. Overall, the weekly time frame is bearish.
Illustration 1.03
Illustration 1.03 shows a setup for NQ1!; if the price will manage to hold above the level, then it will be bullish for NQ1!.
Illustration 1.04
The above is a link to the article about Tether, which we published during the Luna crash.
Please feel free to express your ideas and thoughts in the comment section.
DISCLAIMER: This analysis is not intended to encourage any buying or selling of any particular securities. Furthermore, it should not be a basis for taking any trade action by an individual investor. Therefore, your own due diligence is highly advised before entering a trade.

nasdaq formed Bearish Gartlay Pattern on 1 Hour time frame..nasdaq formed Bearish Gartlay Pattern on 1 Hour time frame..
not a financial advice

NQ1HELLO GUYS THIS MY IDEA 💡ABOUT NQ1 NASDAQ is nice to see strong volume area....
Where is lot of contract accumulated..
I thing that the Seller from this area will be defend this SHORT position..
and when the price come back to this area, strong SELLER will be push down the market again..
DOWNTREND + Support from the past + Strong volume area is my mainly reason for this short trade..
IF you like my work please like share and follow thanks
TURTLE TRADER 🐢

Natural Gas time to easy Rally To evaluate the trend of Natural Gas we must take into account 2 factors:
1) The international macro political scenarios:
Russia, which is the world's leading producer, will export less to its main customer the European Union.
Winter in Europe is upon us and there is a serious risk of an energy blockade, Europe will find GAS but the cost from September onwards will be very high with the main natural gas producer out of the market.
2) Graphically we can deduce a strongly bullish graphic structure where increasing minimums and maximums constantly lean on well-defined supports, the price above the moving averages 100, 200 and the fibonacci extension speaks clearly the price should orbit soon at the price of $ 15.
GAS export data:
In 2020, the 5 largest gas exporters in the world were Russia (199,928 mcm), United States (149,538 mcm), Qatar (143,700 mcm), Norway (112,951 mcm), Australia (102,562 mcm).
Winter is coming (Cit 'GOT)
LPI.sa
NLong

Massive DXY Monthly RSI divergence Feb 2016 to July 2022DXY at a Macro top formation, stock markets are set to make a massive bull run as most people think we are headed to a recession...
I expect the DXY to retest the 2008 lows by the end of the decade, that might be a good time to go into crypto's and tech stocks, QE is going to continue, as markets need the liquidity to continue to operate, the FED is worried about the stock markets not the dollar... do you think the "elites" are holding dollars? no, normal people hold the dollar, the rich do not... food for thought

S&P500, ES500 1M Where's a SUPPORT ?Let's analyze for a MONTH!
Let's zoom in on the TF to get a picture of the situation that is easier to evaluate.
Another month has passed, a historically good month like April which left big losses and gave way to the first $ 4.5k resistances.
May (historically one of the worst months) evening is the month of the Tapering, of the FED which will withdraw liquidity from the market by raising interest rates and above all the increasingly worse US and world data.
Looking for reversal points with SOLID SUPPORTS also helping us with the averages 20 (red), 50 (orange), 100 (yellow) and 200 (blue).
S1 $ 4.1K
S2 $ 3.6K
S3 $ 3.4k / $ 3.2k
(top before the covid crisis)
S4 $ 3.0 / $ 2.8k on the 100 average
S5 $ 2.3k on the 200 average (currently the least likely)
However, be careful to SHORT and give up the US market which often surprises arise in the worst moments.
We will follow through looking for major reversal points with reversal patterns and positively aggressive news.
Follow us in Tradingview for new charts on Crypto, US Stocks, commodoties and INDEX
And what do you think?
Leave a comment!
Grow with us.
Lpi.sa

Netflix What is going on? Netflix
What is going on?
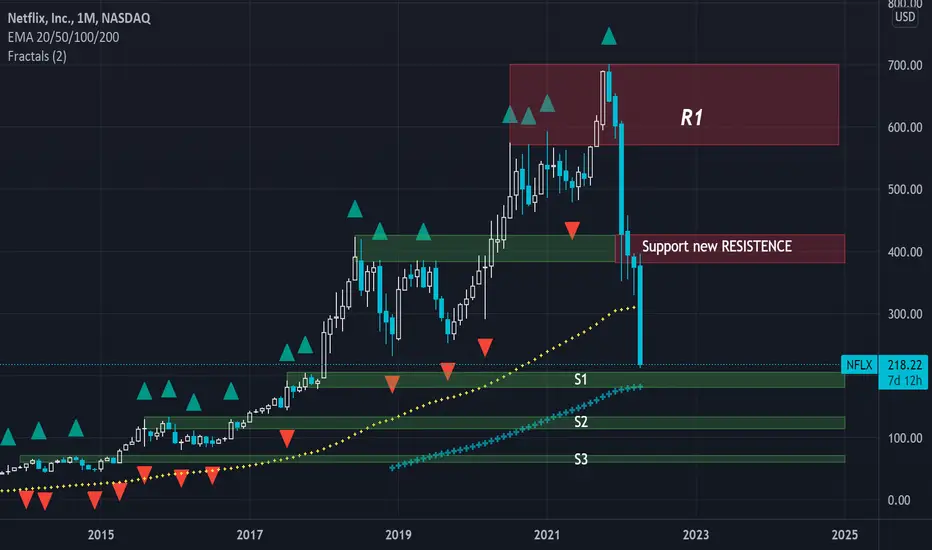
After 6 years of exponential growth + 1'000% (2015 - 2021) the time has come for an immense profit taking.
Losing 70% (going from a $ 300b to a $ 100b market cap.
This capital will be used to refinance the company and to develop new commercial products.
However, losing the SUPPORT 430/380 now NEW RESISTANCE.
We find 3 main supports, potential reversal points.
S1: $ 180 / $ 210 (most likely)
S2: $ 130 / $ 110 (average probable)
S3: $ 60 / $ 70 (least likely)
Only when the Nasdaq 100 inert its medium-term bearish trend could we see a real low point with new entry points.
Buy at the lows and sell at the highs. (this is the secret)
For info, contact us privately
LPI.sa
NAS100 Daily Outlook | 21-AprBy the end of the day, we can be able to clearly see what footprint price have left on the chart. On the chart is what i planned on doing for each scenario.
Kings.

NASDAQ LONG IDEAPrice has rejected support multiple times and also breakout happened on 15 mins, I'm in in this trade with sl in the end of the support zone 1:1 target
ULong

NQ bullishSorry for the late post y’all. But yesterday looked really bullish to me after that huge bullish candle and we also have divergence on daily chart to support it. Minimum target is 14400 next week, but possibly as high as 15000-15100. SL is below todays lows. Good luck

NASDQ100Looking at the 15 min, it shows that it is going up but I do not know why? the news looks bad and it has been going up for a little time. However, I believe in technical analysis.
ULong
