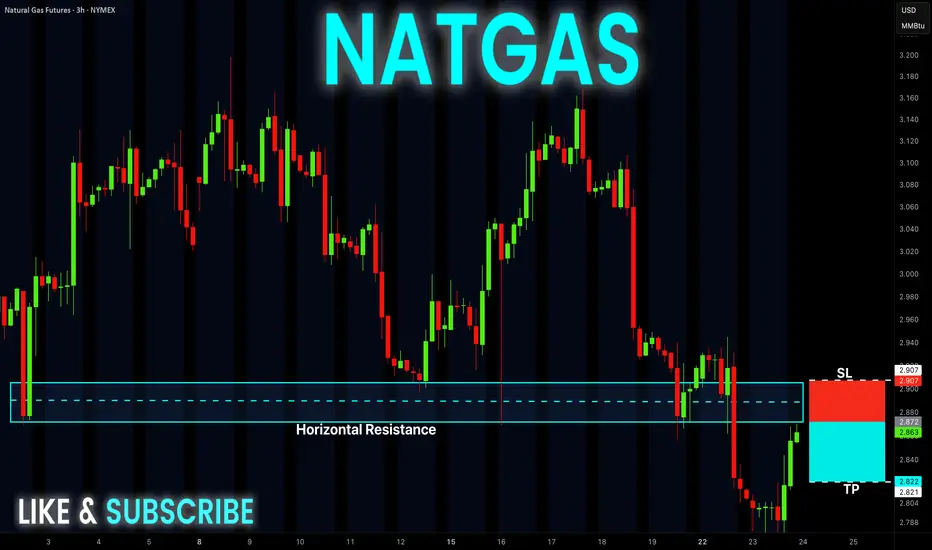
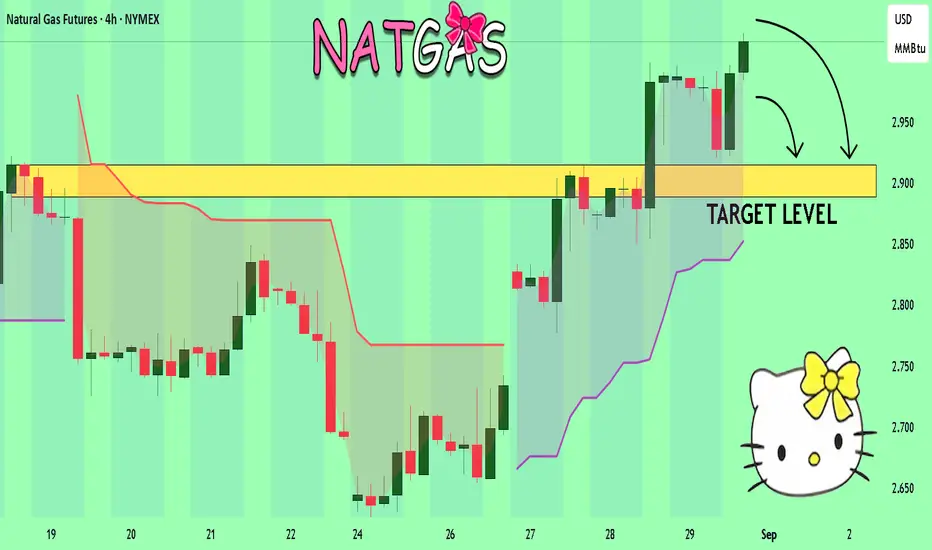
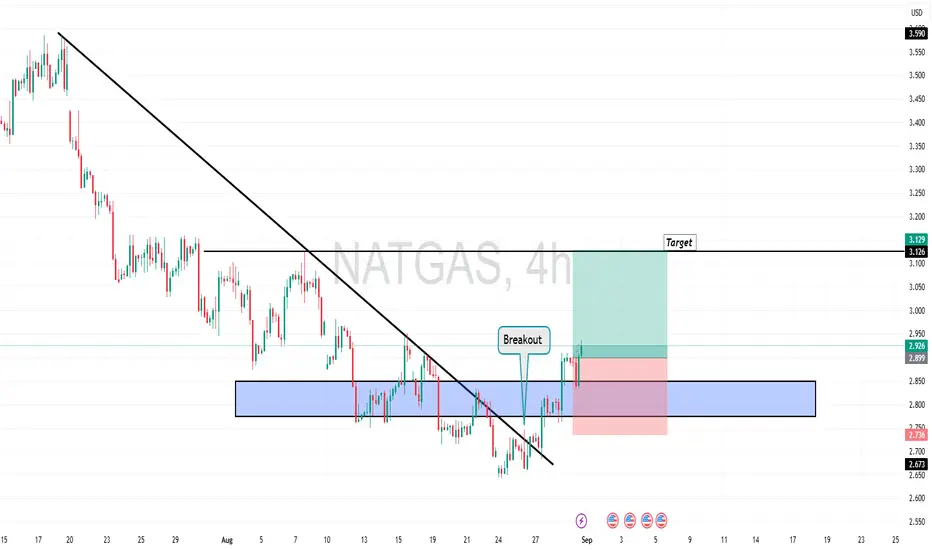
NATGAS Free Signal! Sell!
Hello,Traders!
NATGAS is making a bullish
Correction move, but a horizontal
Resistance area is ahead
Around 2.890$ and after
The retest a local bearish
Pullback is to be expected
So we will be able to enter
A following short trade:
------------------
Stop Loss: 2.907
Take Profit: 2.822
Entry: 2.872
Time Frame: 3H
------------------
Sell!
Comment and subscribe to help us grow!
Check out other forecasts below too!
Disclosure: I am part of Trade Nation's Influencer program and receive a monthly fee for using their TradingView charts in my analysis.
Natgas
Gold | Oil | Dollar | Silver | Natural Gas Price ForecastCatch the latest commodities trading insights! This week's market analysis includes a look at both sides of the coin for oil, gold and silver. Plus, get some helpful technical analysis and trading tips to guide your decisions.
Gold | Oil | Dollar | Silver | Natural Gas Price Forecast
COMEX:GC1! COMEX:SI1! NYMEX:CL1! AMEX:UNG

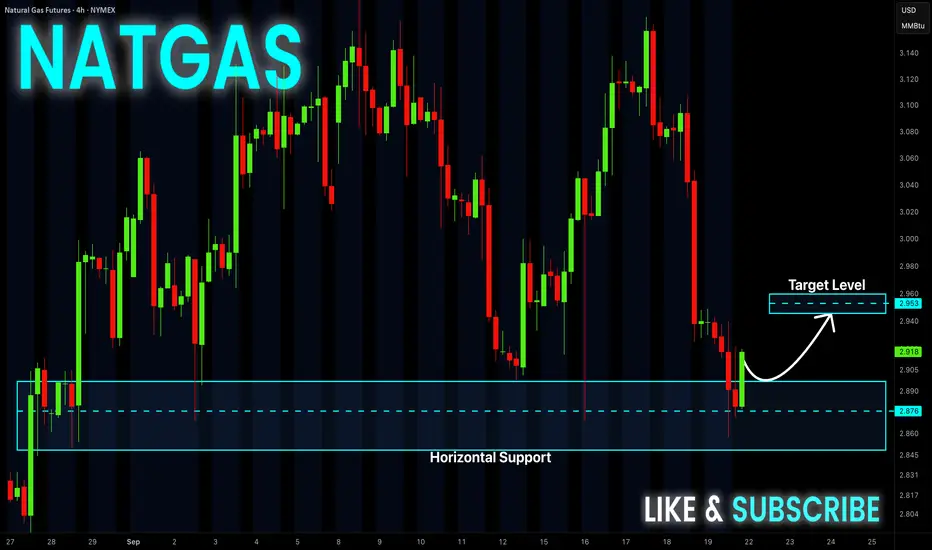
NATGAS Long From Support! Buy!
Hello,Traders!
NATGAS made a retest
Of the wide horizontal
Support level of 2.876$
And a local rebound is
Already taking place so
We are bullish baised
And we think that a local
Bullish correction is to
Be expected on Monday
Buy!
Comment and subscribe to help us grow!
Check out other forecasts below too!
Disclosure: I am part of Trade Nation's Influencer program and receive a monthly fee for using their TradingView charts in my analysis.
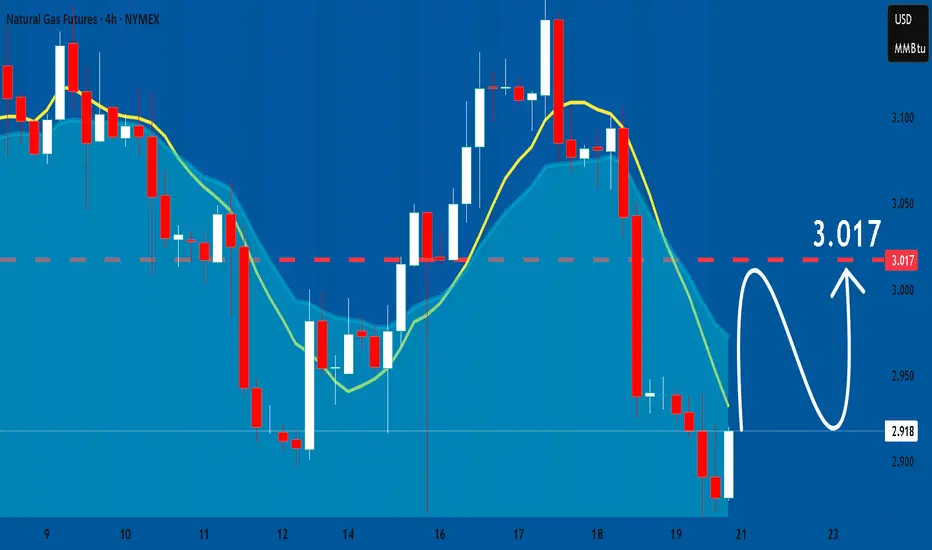
NATGAS What Next? BUY!
My dear followers,
This is my opinion on the NATGAS next move:
The asset is approaching an important pivot point 2.918
Bias - Bullish
Technical Indicators: Supper Trend generates a clear long signal while Pivot Point HL is currently determining the overall Bullish trend of the market.
Goal - 2.997
About Used Indicators:
For more efficient signals, super-trend is used in combination with other indicators like Pivot Points.
Disclosure: I am part of Trade Nation's Influencer program and receive a monthly fee for using their TradingView charts in my analysis.
———————————
WISH YOU ALL LUCK

NATGAS: Growth & Bullish Forecast
Balance of buyers and sellers on the NATGAS pair, that is best felt when all the timeframes are analyzed properly is shifting in favor of the buyers, therefore is it only natural that we go long on the pair.
Disclosure: I am part of Trade Nation's Influencer program and receive a monthly fee for using their TradingView charts in my analysis.
❤️ Please, support our work with like & comment! ❤️
NATGAS LOCAL LONG|
✅NATGAS went down to retest
A horizontal support of 2.86$
Which makes me locally bullish biased
And I think that a move up
From the level is to be expected
Towards the target above at 2.96$
LONG🚀
✅Like and subscribe to never miss a new idea!✅

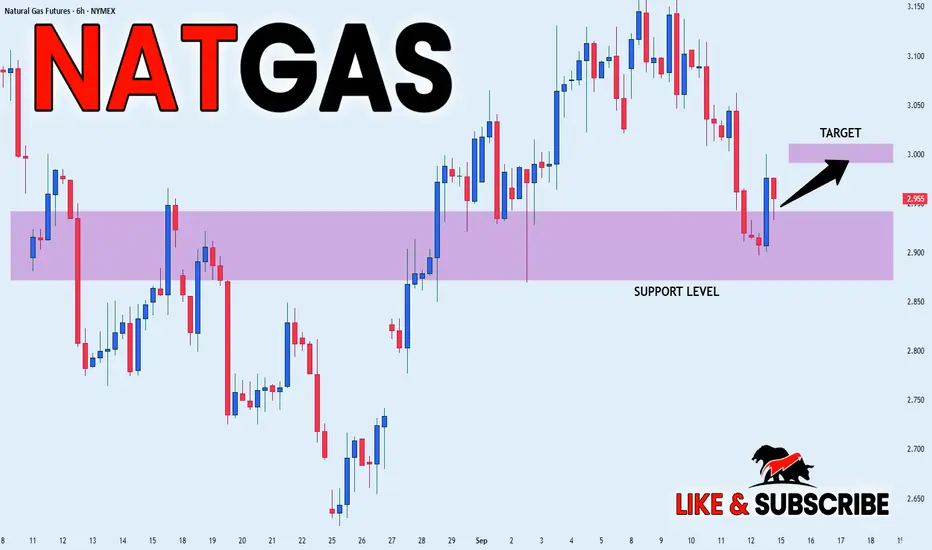
NATGAS Massive Long! BUY!
My dear friends,
Please, find my technical outlook for NATGAS below:
The price is coiling around a solid key level - 2.955
Bias - Bullish
Technical Indicators: Pivot Points High anticipates a potential price reversal.
Super trend shows a clear buy, giving a perfect indicators' convergence.
Goal - 2.992
About Used Indicators:
The pivot point itself is simply the average of the high, low and closing prices from the previous trading day.
Disclosure: I am part of Trade Nation's Influencer program and receive a monthly fee for using their TradingView charts in my analysis.
———————————
WISH YOU ALL LUCK

NATGAS LOCAL LONG|
✅NATGAS went down to retest
A horizontal support of 2.90$
Which makes me locally bullish biased
And I think that we will see a rebound
And a move up from the level
Towards the target above at 3.00$
LONG🚀
✅Like and subscribe to never miss a new idea!✅
NATGAS: Bullish Forecast & Outlook
Looking at the chart of NATGAS right now we are seeing some interesting price action on the lower timeframes. Thus a local move up seems to be quite likely.
Disclosure: I am part of Trade Nation's Influencer program and receive a monthly fee for using their TradingView charts in my analysis.
❤️ Please, support our work with like & comment! ❤️
NATGAS Sellers In Panic! BUY!
My dear subscribers,
My technical analysis for NATGAS is below:
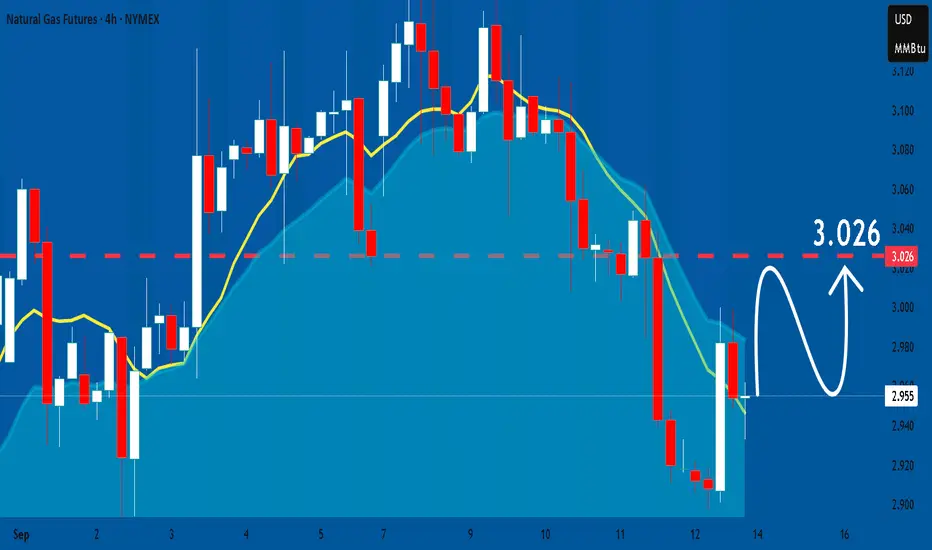
The price is coiling around a solid key level - 3.026
Bias - Bullish
Technical Indicators: Pivot Points Low anticipates a potential price reversal.
Super trend shows a clear buy, giving a perfect indicators' convergence.
Goal - 3.056
My Stop Loss - 3.011
About Used Indicators:
By the very nature of the supertrend indicator, it offers firm support and resistance levels for traders to enter and exit trades. Additionally, it also provides signals for setting stop losses
Disclosure: I am part of Trade Nation's Influencer program and receive a monthly fee for using their TradingView charts in my analysis.
———————————
WISH YOU ALL LUCK
Gold | Oil | Dollar | Silver | Natural Gas Price ForecastGold | Oil | Dollar | Silver | Natural Gas Price Forecast
COMEX:GC1! COMEX:SI1! AMEX:UNG NYMEX:CL1!

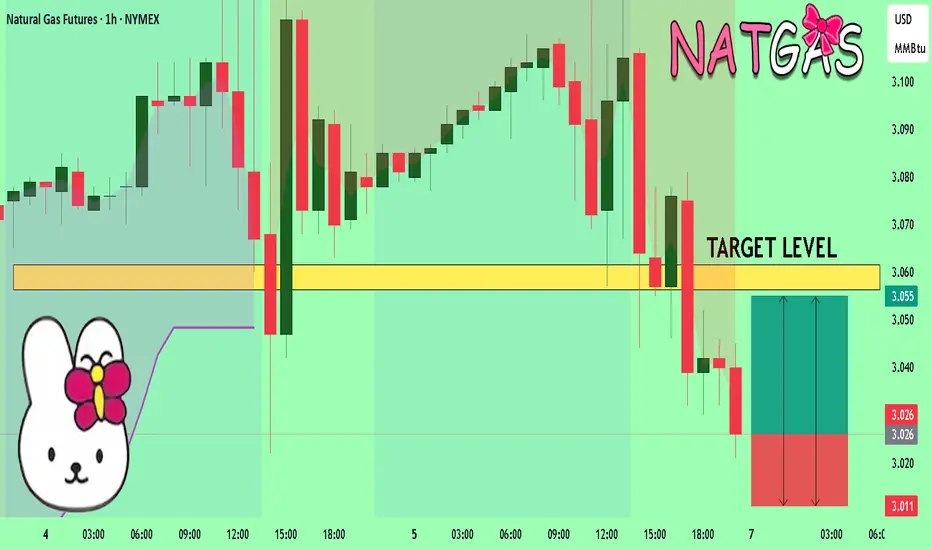
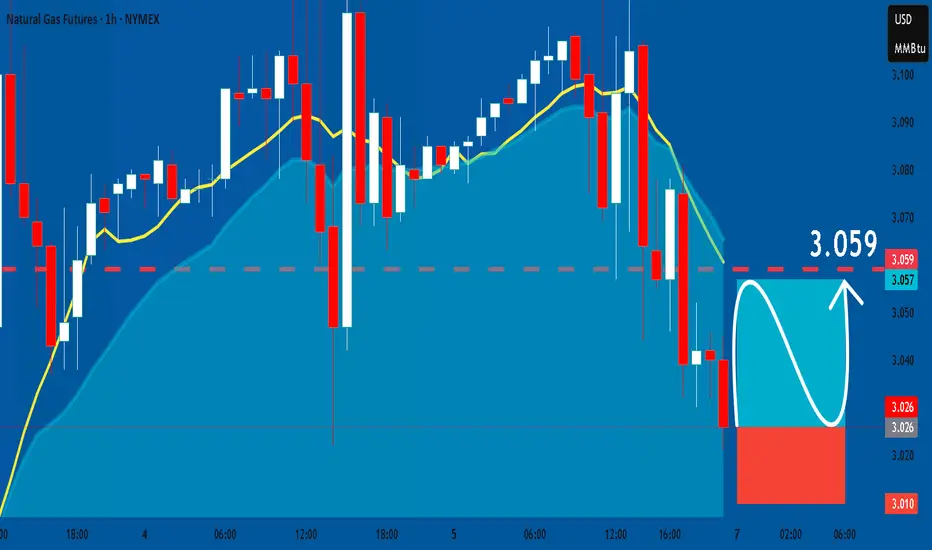
NATGAS: Great Trading Opportunity
NATGAS
- Classic bullish pattern
- Our team expects retracement
SUGGESTED TRADE:
Swing Trade
Buy NATGAS
Entry - 3.026
Stop - 3.010
Take - 3.059
Our Risk - 1%
Start protection of your profits from lower levels
Disclosure: I am part of Trade Nation's Influencer program and receive a monthly fee for using their TradingView charts in my analysis.
❤️ Please, support our work with like & comment! ❤️
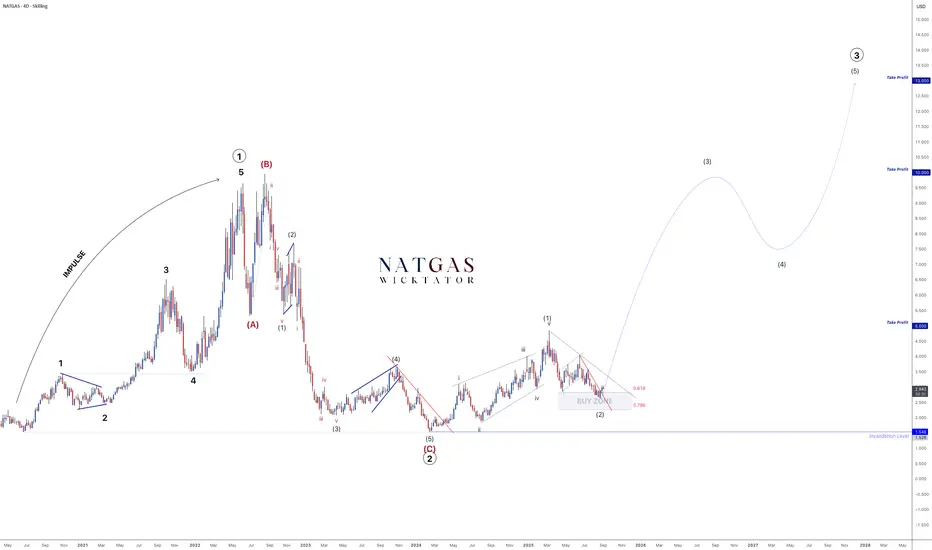
NATGAS – Wave 3 Impulse Confirmed. Multi-Year Rally Started!Our roadmap has played out with precision.
Wave 2 correction is complete, price tapped the buy zone, and the entry is now active.
We’re in the early stages of Wave 3 - historically the strongest and longest Elliott Wave.
🎯 Targets remain:
TP1: 5
TP2: 10
TP3: 13
The impulse has begun - now it’s about riding the wave.
Plan the trade. Trade the plan.
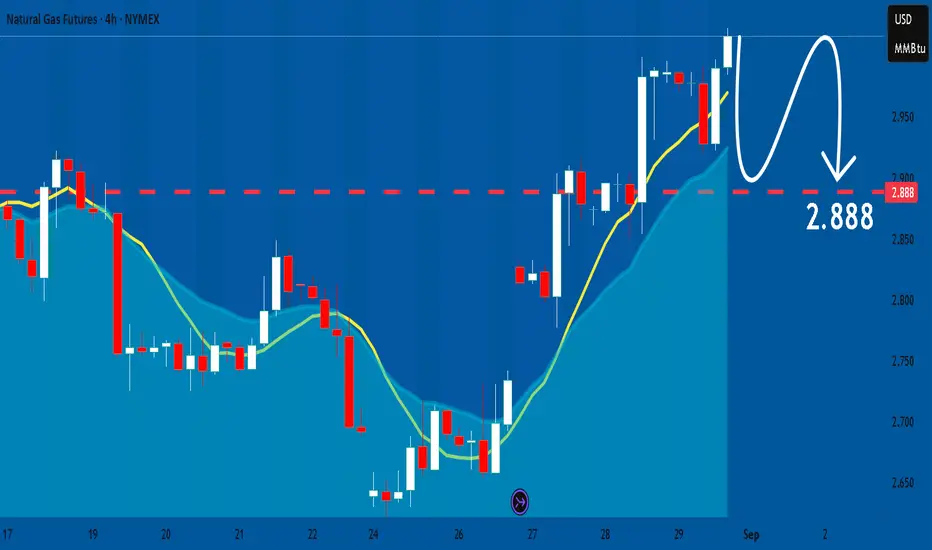
NATGAS WILL FALL|SHORT|
✅NATGAS has been growing recently
And the Gas seems locally overbought
So as the pair is approaching
A horizontal resistance of 3.136$
Price decline is to be expected
SHORT🔥
✅Like and subscribe to never miss a new idea!✅
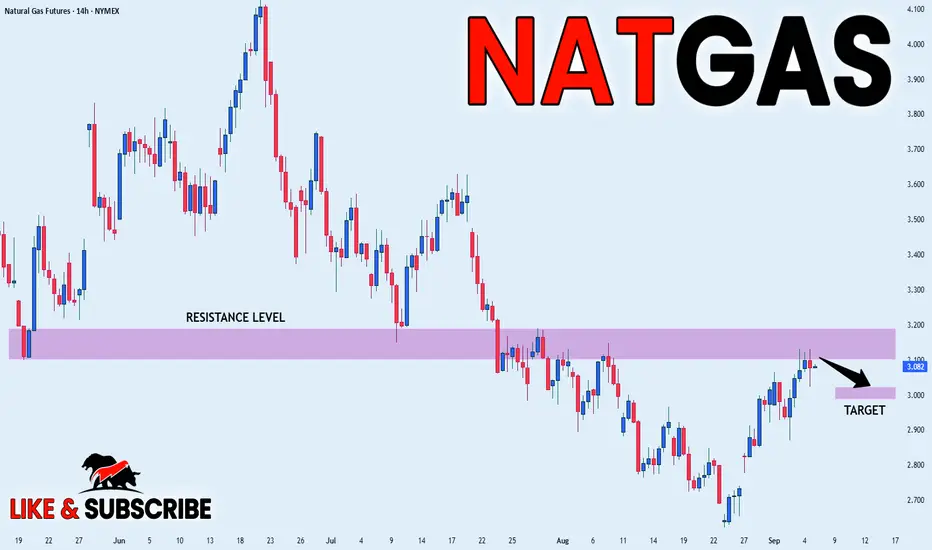
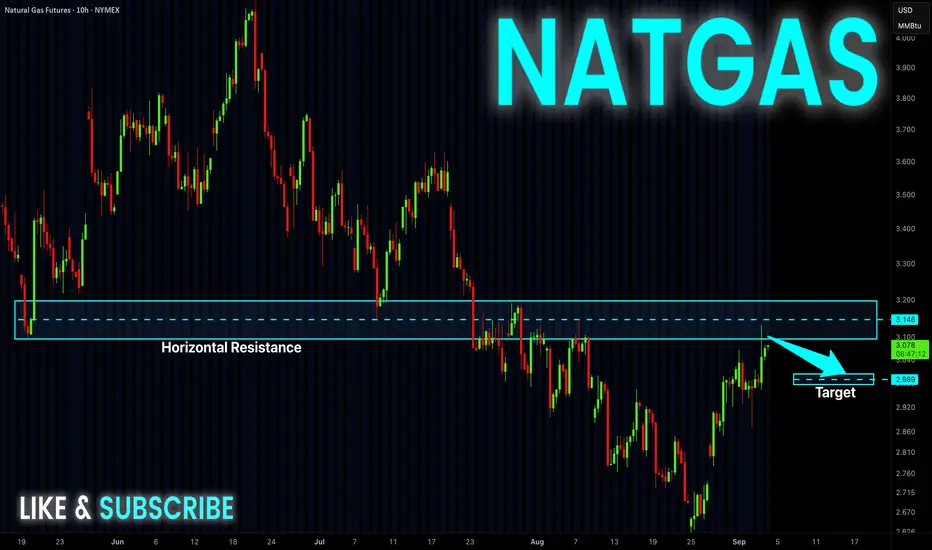
NATGAS Short From Resistance! Sell!
Hello,Traders!
NATGAS went up nicely
And made a retest of
The horizontal resistance
Of 3.148$ so as the Gas
Is locally overbought
We will be expecting a
Local bearish correction
Sell!
Comment and subscribe to help us grow!
Check out other forecasts below too!
Disclosure: I am part of Trade Nation's Influencer program and receive a monthly fee for using their TradingView charts in my analysis.
NATGAS My Opinion! SELL!
My dear subscribers,
My technical analysis for NATGAS is below:
The price is coiling around a solid key level - 3.016
Bias - Bearish
Technical Indicators: Pivot Points Low anticipates a potential price reversal.
Super trend shows a clear sell, giving a perfect indicators' convergence.
Goal - 2.915
About Used Indicators:
By the very nature of the supertrend indicator, it offers firm support and resistance levels for traders to enter and exit trades. Additionally, it also provides signals for setting stop losses
Disclosure: I am part of Trade Nation's Influencer program and receive a monthly fee for using their TradingView charts in my analysis.
———————————
WISH YOU ALL LUCK
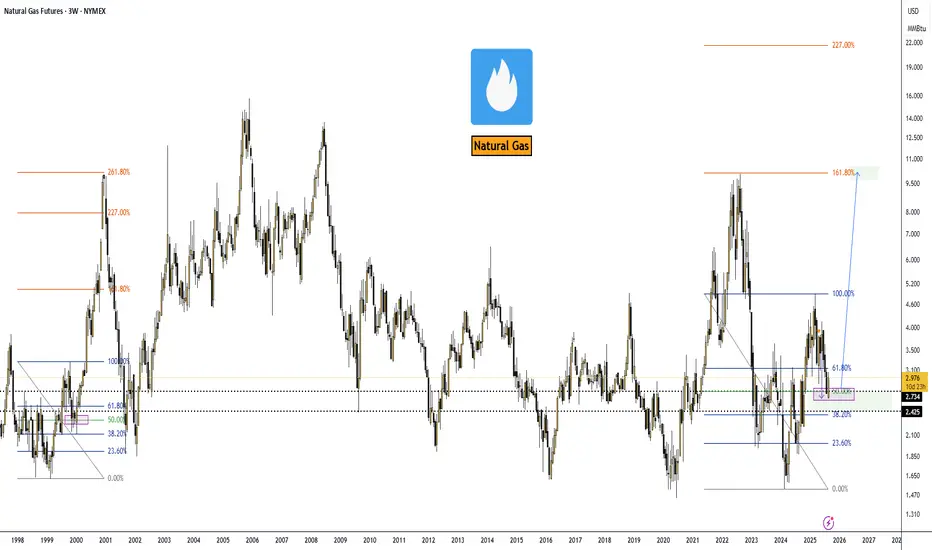
Natural Gas Market Outlook — September 01, 2025.VANTAGE:NG #NaturalGas #NatGas (NYMEX:NG1!) 🔵 Natural Gas Market Outlook — September 01, 2025.
Alright, here’s the skinny on NatGas. Back on April 28, 2025, I was calling for a dip into the $2.74 zone—and guess what? We tagged it right on schedule.
Now the game flips: I’m hunting long entries with the first serious target sitting at $10.00.
Could we overshoot? Absolutely. If momentum really gets cooking, the Fibo 227% extension lines up at roughly $21.00. But let’s not get greedy yet—$10 stays the main milestone for the next big leg.
Macro Drivers
➖ Exports: LNG shipments are the elephant in the room. Europe’s still thirsty, Asia’s paying up, and U.S. cargos are cashing in.
➖ Production: Flat. Shale guys aren’t rushing to flood the market unless we break above $3.20+.
➖ Geopolitics: Russia’s LNG rerouting and Middle East jitters keep a bid under global gas.
➖ Utilities & Consumers: Domestic demand is softer thanks to renewables transitions, but that’s a sideshow compared to export flows.
Big Picture
EIA pegs Henry Hub at $3.60 in 2025 and $4.30 in 2026, but frankly, that’s conservative. With demand from data centers, electrification, and global LNG growth, upside is more likely than not.
Trade View
➡️ I’m treating $2.74 as the cycle low. Any dips near that level look like golden tickets for long positioning into 2026. First pit stop: $10.00. If bulls get rowdy, keep an eye on $21.00 as the stretch target.
➡️ Bottom line: NatGas just gave us the reset we were waiting for. From here, risk/reward favors the long side. Strap in—it’s gonna be a volatile ride, but that’s where the money gets made.
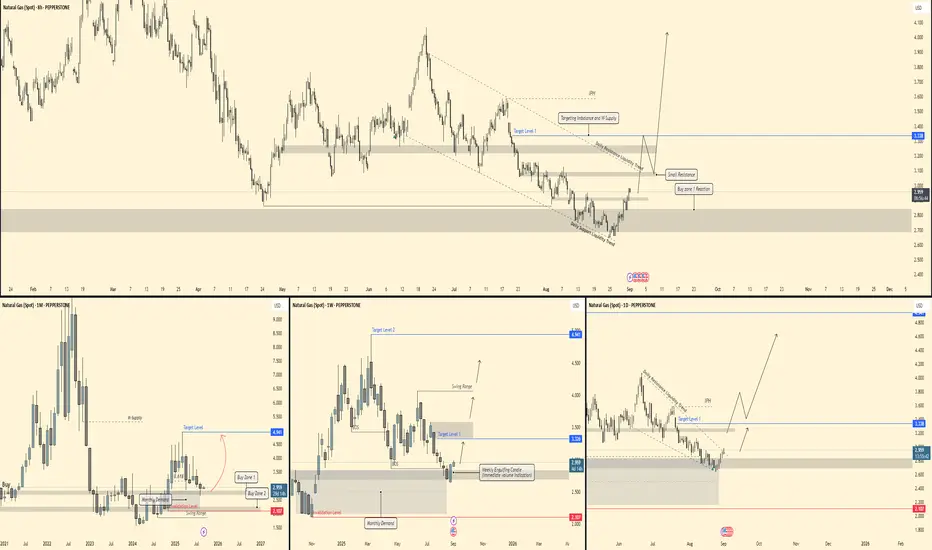
NATGAS - Targets acquired! Bullish Breakout! 📊 NATGAS – Multi-Timeframe Outlook
🔎 Monthly (1M)
Price has respected the monthly demand zone (2.1 – 2.3) with a strong reaction.
Structure still inside a wide swing range, but higher timeframe bias is shifting bullish.
Long-term upside targets sit around 4.9+, aligning with the top of the range and prior supply.
🕰 Weekly (1W)
Clear weekly engulfing candle confirming demand reaction.
Target Level 1: 3.3 – 3.4 zone (short-term imbalance/supply).
Target Level 2: 4.9+, lining up with range highs.
As long as price holds above 2.1 invalidation level, bullish continuation remains intact.
⏱ Daily (1D)
Current push showing strong momentum off support with liquidity trend building.
Immediate upside focus on 3.3+, where first supply/imbalance sits.
Expect retracements into demand zones to be respected as buying opportunities until major resistance levels are tested.
⏳ 8H
Price broke out of a descending channel, retesting the buy zone reaction area (2.8 – 2.9).
Upside liquidity targets at 3.3 in the near-term.
Smaller resistance noted, but structure favors continuation higher toward daily imbalance + supply zones.
🎯 Trade Plan
Bias: Bullish reversal from higher timeframe demand
Entry Zone: 2.8 – 2.9 (buy zone reaction)
Targets: 3.3 (short-term), 4.9 (long-term swing)
Invalidation: Break below 2.1 demand base
Gold | Oil | Dollar | Silver | Natural Gas Price ForecastGold | Oil | Dollar | Silver | Natural Gas Price Forecast
COMEX:GC1!
COMEX:SI1!
AMEX:UNG
NYMEX:CL1!

Natural Gas is in the Buying DirectionHello Traders
In This Chart NATGAS HOURLY Forex Forecast By FOREX PLANET
today NATGAS analysis 👆
🟢This Chart includes_ (NATGAS market update)
🟢What is The Next Opportunity on NATGAS Market
🟢how to Enter to the Valid Entry With Assurance Profit
This CHART is For Trader's that Want to Improve Their Technical Analysis Skills and Their Trading By Understanding How To Analyze The Market Using Multiple Timeframes and Understanding The Bigger Picture on the Charts
NATGAS: Bearish Forecast & Bearish Scenario
It is essential that we apply multitimeframe technical analysis and there is no better example of why that is the case than the current NATGAS chart which, if analyzed properly, clearly points in the downward direction.
Disclosure: I am part of Trade Nation's Influencer program and receive a monthly fee for using their TradingView charts in my analysis.
❤️ Please, support our work with like & comment! ❤️
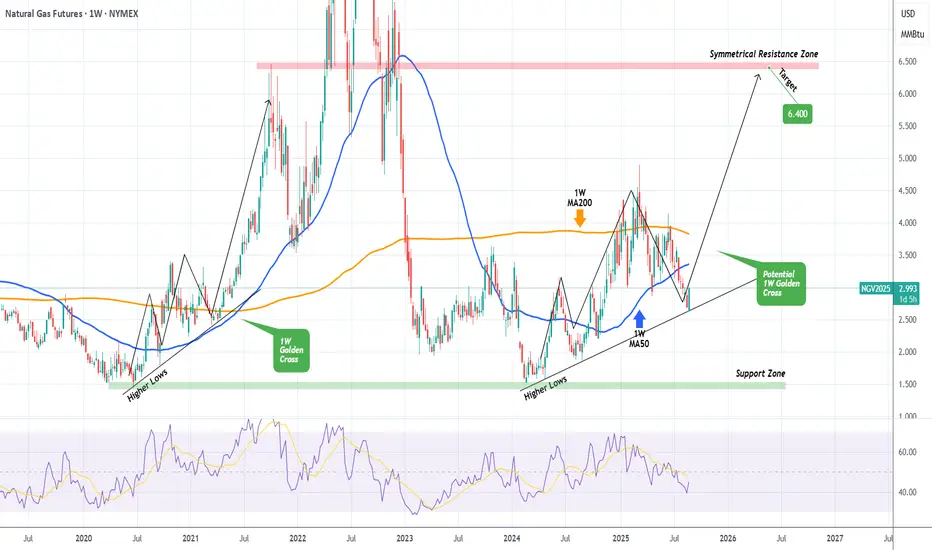
NATURAL GAS rebounding on a 1.5-year Support! Bullish.Natural Gas (NG1!) is having a strong green 1W candle, coming off a 2-month decline. It is highly likely that this correction has come to an end as the price hit this hit (and thus rebounding on) the Higher Lows trend-line that started all the way back since the February 20 2024 market bottom.
Technically the whole pattern from that day until now looks similar to the June 22 2020 - March 15 2021 sequence, which initiated a stronger 3rd Bullish Leg all the way to the Symmetrical Resistance Zone.
A potential 1W Golden Cross would confirm this upward break-out, just like it did on June 14 2021.
If that takes place, our long-term Target would be 6.400 (Symmetrical Resistance Zone).
-------------------------------------------------------------------------------
** Please LIKE 👍, FOLLOW ✅, SHARE 🙌 and COMMENT ✍ if you enjoy this idea! Also share your ideas and charts in the comments section below! This is best way to keep it relevant, support us, keep the content here free and allow the idea to reach as many people as possible. **
-------------------------------------------------------------------------------
💸💸💸💸💸💸
👇 👇 👇 👇 👇 👇
NATGAS SHORT FROM RESISTANCE|
✅NATGAS is set to retest a
Strong resistance level above at 2.945$
After a local bullish correction
Which makes a bearish pullback a likely scenario
With the target being a local support below at 2.80$
SHORT🔥
✅Like and subscribe to never miss a new idea!✅
