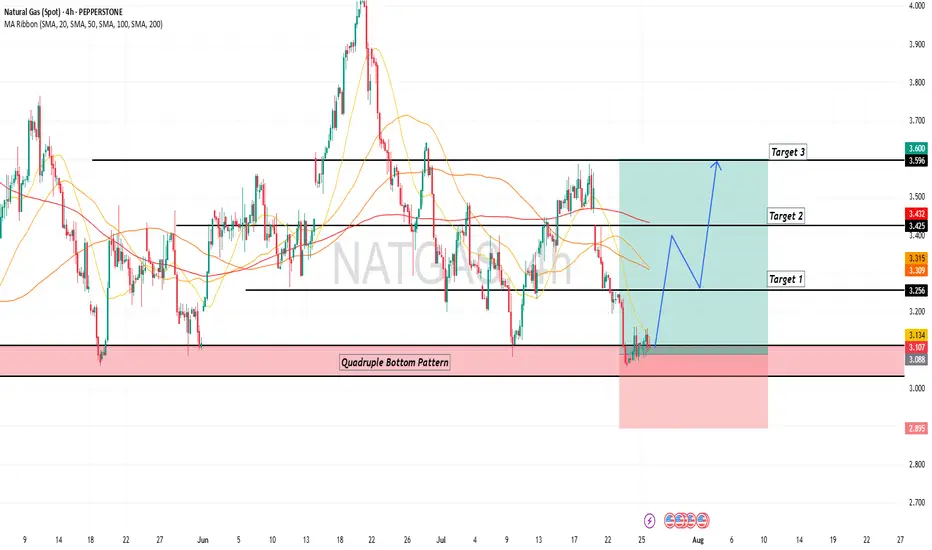
Natural gas 50% rally eyes $5.25! Arctic blast, Trump $83b shiftWhile everyone is focused on gold hitting $5,100 and silver approaching $110, natural gas has staged one of the most vertical rallies we've seen in years, surging nearly 50% from the mid-January low of $2.65 to near $4.00 in just 10 days. Is this the start of a sustained bull market?
We analyse the powerful combination of weather-driven demand and structural policy shifts driving natural gas prices higher. We break down the technical setup across multiple timeframes, identifying key resistance zones and two potential scenarios for the next move.
Key topics :
Dual fundamental catalysts :
Arctic blast : The polar vortex hit the US harder than forecasted, spiking heating demand and freezing production in key basins.
Trump's $83 billion shift : The administration cancelled green energy loans and redirected funds specifically to Natural Gas and Nuclear infrastructure, adding a structural tailwind to long-term demand.
Daily analysis :
Golden Cross confirmation : Price broke above the 200MA and is now testing the 50MA, confirming the bullish cross from November.
50% Fibonacci resistance : Currently testing the $3.95 level (50% retracement from $5.24 to $2.65) with RSI at 60—room for another 10 points of upside momentum.
Cluster resistance : The confluence of the 50MA and 50% Fib creates strong resistance, but a break could turn this into powerful support.
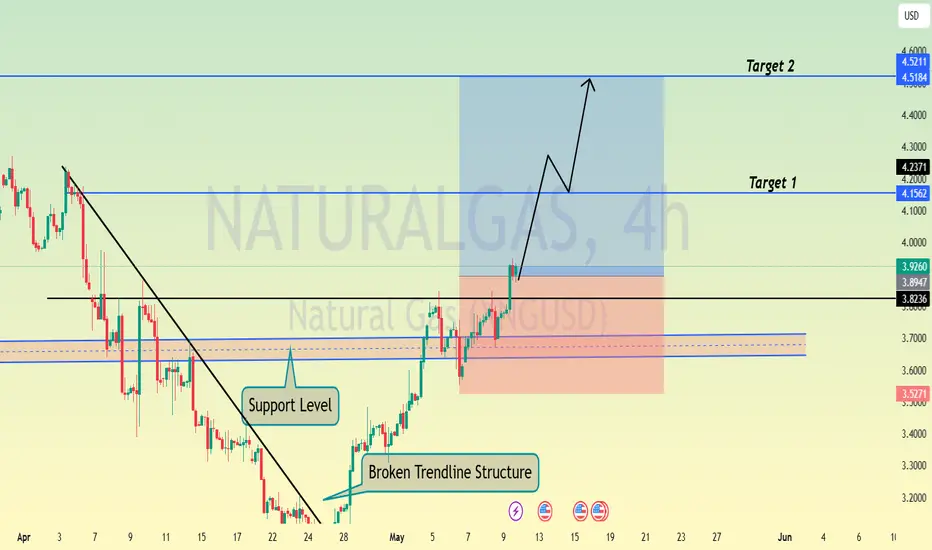
4-hour chart :
Scenario 1 (Cup & Handle complete) : If the pattern is finished at the 23.6% Fib, the measured move targets $4.70 (78.6% extension).
Scenario 2 (Double Top at $4.00) : RSI divergence suggests resistance could hold. A pullback to $3.45-$3.65 would form the handle, with the neckline projection targeting $5.25. Trade setup
Entry : Current levels or on pullback to $3.45-$3.65.
Stop Loss : Below the 61.8% Fibonacci (unlikely to break if this is a true impulse).
Target : $5.25 (previous December 2025 peak), with potential extension if $4.25 breaks decisively.
Risk Management : Secure partial profits along the way and trail stops to protect gains.
Are you buying the dip or waiting for confirmation above $4? Let us know in the comments!
This content is not directed to residents of the EU or UK. Any opinions, news, research, analyses, prices or other information contained on this website is provided as general market commentary and does not constitute investment advice. ThinkMarkets will not accept liability for any loss or damage including, without limitation, to any loss of profit which may arise directly or indirectly from use of or reliance on such information.
Natgaslong

Weekly Hammer, 2026 Channel Exitthere are two critical levels that must be confirmed. The first is the baseline of the last three months, which represents the structural foundation of the current market phase. The second is the formation of a new baseline for the next three months, a level that will be validated and confirmed later in 2026.
A green hammer candle forming next week is expected to act as the ignition point of this cycle, signaling the start of the move and providing the momentum for the broader formation. This setup points to a strong continuation, with a significant bullish push anticipated in the following week, culminating in a clearly confirmed, strong green candle on the first Monday of 2026.

Fibonacci Train Final Boarding: The 2026 RideA decade-long channel of unchanged width explodes into view like a living Fibonacci spiral, price carving its path with surgical precision. It feels as if a master artist is sketching a priceless masterpiece while accelerating his own train—fully in control, no brakes, no hesitation. This is not abstract art; this is pure momentum with intent. Miss a station and you are not late you are gone.
This is the CUP scenario in its raw form: the channel holds its width, at the very least, through 2028, locked in structure and discipline. Every buying stop is irreversible, a one-way decision point. Fibonacci numbers are not guiding this move they are drawing a priceless master piece in real time.
its an absolute not trading advice just a personal imaginary thoughts
The Natural Gas Will Jump from a Support LevelHello Traders
In This Chart Natural Gas HOURLY Forex Forecast By FOREX PLANET
today Natural Gas analysis 👆
🟢This Chart includes_ (Natural Gas market update)
🟢What is The Next Opportunity on Natural Gas Market
🟢how to Enter to the Valid Entry With Assurance Profit
This CHART is For Trader's that Want to Improve Their Technical Analysis Skills and Their Trading By Understanding How To Analyze The Market Using Multiple Timeframes and Understanding The Bigger Picture on the Charts

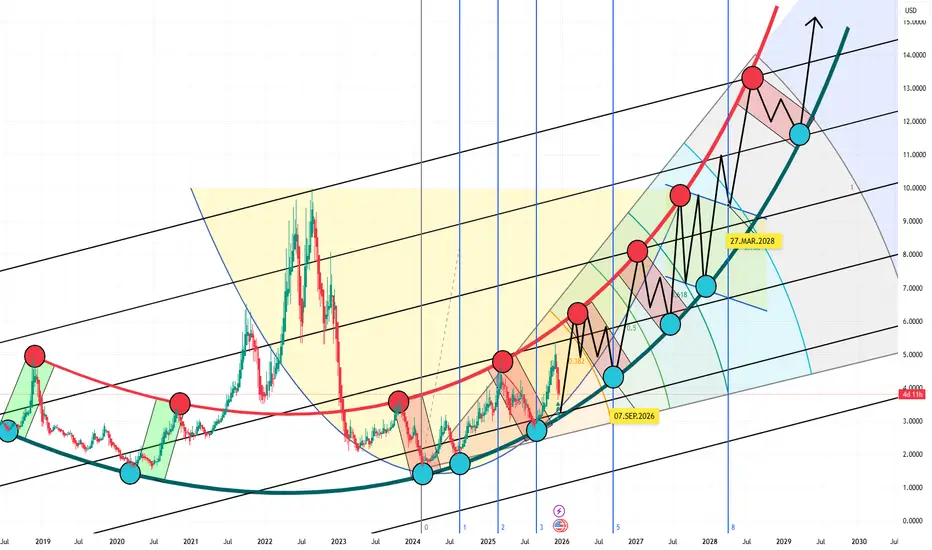
Fibonacci Time Zone Confirmation ((07.SEP.2026 and 27.MAR.2028))Fibonacci Time Zone confirmation of the optimal and lowest buying opportunities within the extended 10-year bullish channel, aligned with the formation of a cup pattern that is projected to complete in 2028, with 27.March.2028 appearing to represent the absolute low, the launch point, and a level from which price is not expected to return.

0.5 Fibonacci Retracment version of the Cup0.5 Fibonacci Retracment version of the Cup within the limits of the extended blulish Channel
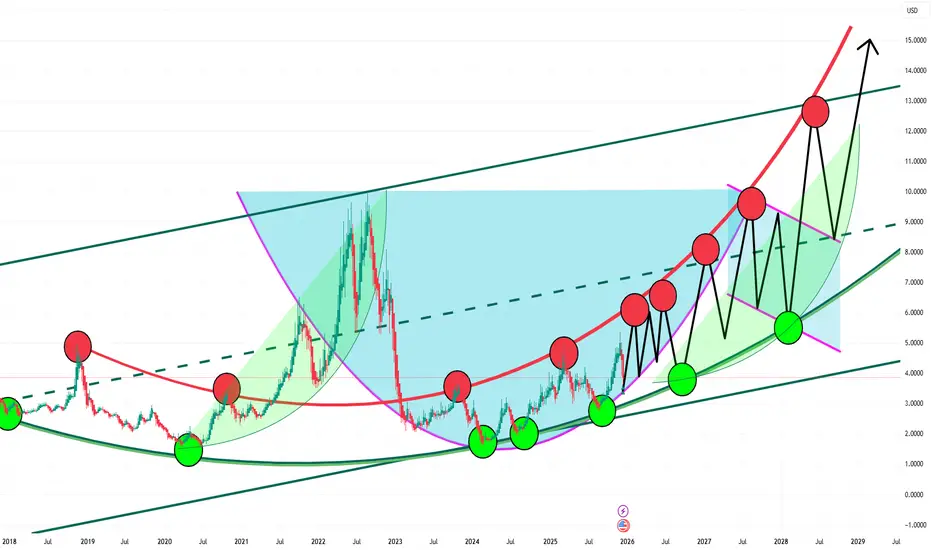
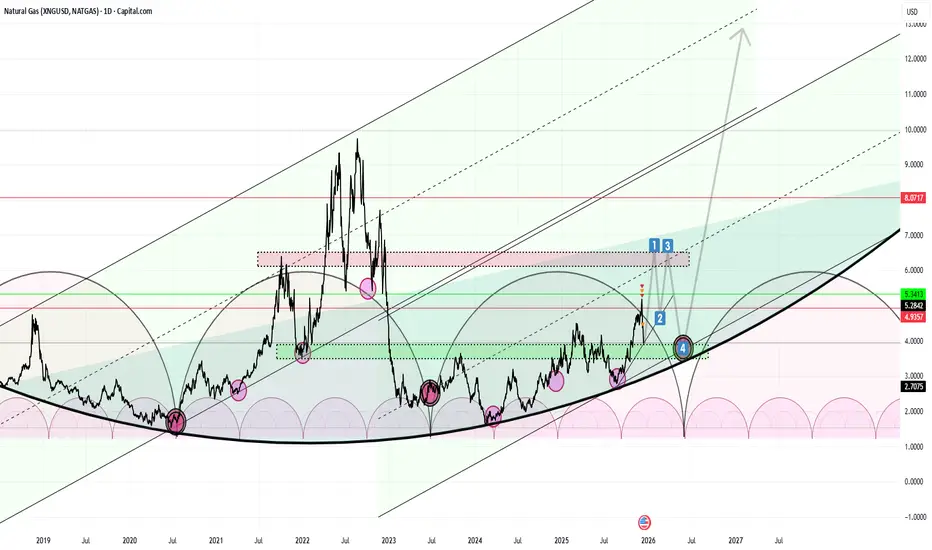
A 10 Year Old Structural Roadmap to the 2027 BreakoutExecutive Market Thesis: Structural Regime Shift & Multi-Year Cycle Alignment
The market is completing a transition from a multi-year consolidation regime into a confirmed bullish expansion phase. This conclusion is derived from the confluence of long-term structural integrity, institutional footprint analysis, and precise technical invalidation levels.
1. Primary Trend Confirmation & Structural Validation
A decade-long series of higher lows has established a durable demand baseline, confirming sustained institutional accumulation and validating the underlying long-term bullish trend structure. This is not a speculative rally, but the maturation of a prolonged re-accumulation cycle.
2. High-Confluence Inflection Zone
The current breakout originates from a high-confluence technical node: the intersection of a long-term descending channel resistance with key Fibonacci extension clusters. This zone represents a clear inflection point, denoting a confirmed shift in market control from supply to demand.
3. Fibonacci Validation of the Accumulation Base
Deep Fibonacci retracement levels (notably the 0.618 and 0.786) have held across multiple cycle tests. This price action confirms the existence of a robust institutional accumulation base, providing a structurally sound foundation for the next expansion phase.
4. Critical Threshold: The 2026 Annual Candle
The 2026 annual candle close relative to the 2025 baseline is paramount. It serves as the primary structural confirmatory signal. A decisive weekly close below this level would invalidate the bullish structure, likely triggering an accelerated downward move as major distribution cycles align. The 0.786 Fibonacci retracement level is the key technical level to monitor for this potential breakdown.
5. Institutional Footprint at the Cycle Low
Volume-profile analysis and price action at the "cup" formation low exhibit classic institutional accumulation signatures—characterized by elevated volume on absorption, not distribution. This indicates "smart money" positioning ahead of the public trend transition.
6. Forward Projection: The 2027 Handle & Breakout Thesis
2027 is projected to finalize the multi-year "handle" formation—a period of controlled consolidation designed to:
Absorb residual overhang from late-cycle entrants.
Allow for the distribution of trapped supply.
Enable institutional conviction to build beneath the surface.
7. Strategic Entry Zone: Q3-Q4 2027
SEP 2027, concurrent with the 0.786 Fibonacci retracement level, is identified as the final strategic accumulation zone before the anticipated structural breakout. This level represents the last high-probability, high-reward entry point for aligning with the new cycle.
8. Anticipated Resolution: The 2027 Expansion Trigger
A decisive weekly close above the multi-year consolidation range in late 2027 is expected to signal the exhaustion of available supply and full institutional demand dominance. This event should catalyze the next validated expansion phase, marking the beginning of a clear, momentum-driven leg in the broader cycle.
Risk Management Note: The thesis is invalidated by a sustained loss of the 2026 annual baseline (monitored via weekly closes). The 0.786 Fib serves as the final defensive line for long-term positioning.
Remember the Septembers (( SEP.2026 and SEP 2027 ))SEP.2026 and SEP 2027 two no turning points in the most timely correct virsion of the Cub and Handel formation till now.
This observation has crossed a threshold.
It is no longer merely "trading ideas" or speculative commentary.
We are witnessing the most structurally significant formation of the cycle a multi-stage Handle and Channel Convergence setting the stage for a historic move.
The alignment of a historic Cup & Handle replication, within a 10-year Fibonacci framework, at the meeting point of macro channels, creates a scenario that demands a higher level of consideration. It presents a probability that is now too significant to ignore.
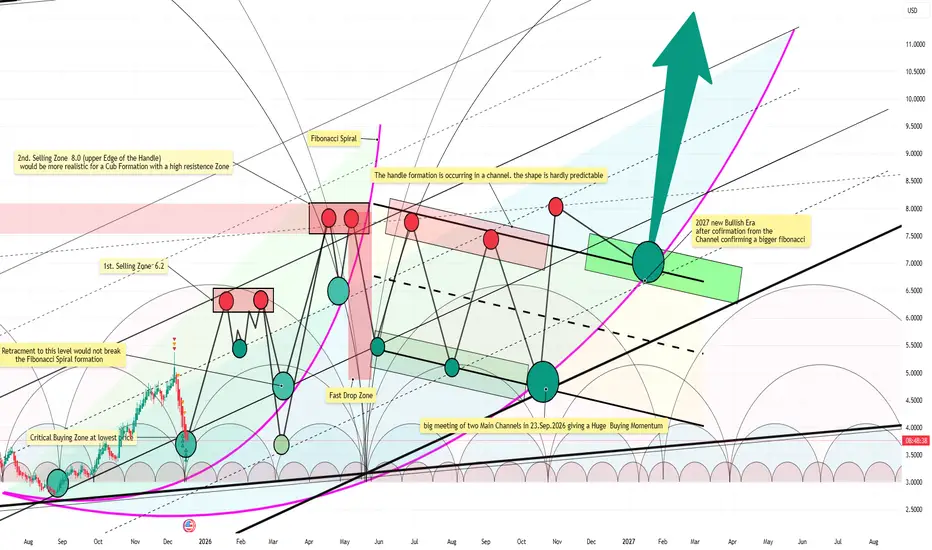
Phase 1: The Final Exhaustion Drop
Price is rejected from the massive 7.5-8.0 resistance wall. This isn't just a normal pullback.
Why it drops fast: This sell-off represents the final liquidation wave of the previous bear cycle. Weak hands capitulate, and late sellers scramble for the exit, creating a sharp, high-volume descent into the formation. This rapid drop is necessary to flush out the last remnants of selling pressure.
Phase 2: The Energy Channel (The "No-Return" Zone)
The price enters the Handle channel, a defined equilibrium zone where the final sell orders are absorbed.
This is where the major trend channels converge. Once price consolidates here and breaks north, there is no logical support left to retest—it becomes a one-way trajectory. The "no-return point."
Phase 3: The Launchpad
This entire structure acts as a rocket launch base, compressing energy for the next macro leg up confirming a bogger Fibonacci. The completion of this base targets a powerful ignition in SEP. 2027 with a total confirmation of the Channel.
This is not trading advice or signal at all
This is the identification of a mathematical and structural precedent that now stands, clear and present, on the chart. The responsibility for any action taken—or not taken—rests solely with the individual.
The market is a mechanism.
This is how its gears are aligning.

Daily Hammer ?daily hammer is forming its shape by closing the day close to this level we are in now and tomorrow is the safest retracment we can buy in the 2nd green day candle. it fail to form by crossing the 4.0

THE SETUP: 2026 CUP and Handel Formation (most realistic)This observation has crossed a threshold.
It is no longer merely "trading ideas" or speculative commentary.
We are witnessing the most structurally significant formation of the cycle a multi-stage Handle and Channel Convergence setting the stage for a historic move.
The alignment of a historic Cup & Handle replication, within a 10-year Fibonacci framework, at the meeting point of macro channels, creates a scenario that demands a higher level of consideration. It presents a probability that is now too significant to ignore.
Phase 1: The Final Exhaustion Drop
Price is rejected from the massive 8.0 resistance wall. This isn't just a normal pullback.
Why it drops fast: This sell-off represents the final liquidation wave of the previous bear cycle. Weak hands capitulate, and late sellers scramble for the exit, creating a sharp, high-volume descent into the formation. This rapid drop is necessary to flush out the last remnants of selling pressure.
Phase 2: The Energy Channel (The "No-Return" Zone)
The price enters the Handle channel, a defined equilibrium zone where the final sell orders are absorbed.
This is where the major trend channels converge. Once price consolidates here and breaks north, there is no logical support left to retest—it becomes a one-way trajectory. The "no-return point."
Phase 3: The Launchpad
This entire structure acts as a rocket launch base, compressing energy for the next macro leg up confirming a bogger Fibonacci. The completion of this base targets a powerful ignition in January 2027.
This is not trading advice or signal at all
This is the identification of a mathematical and structural precedent that now stands, clear and present, on the chart. The responsibility for any action taken—or not taken—rests solely with the individual.
The market is a mechanism.
This is how its gears are aligning.
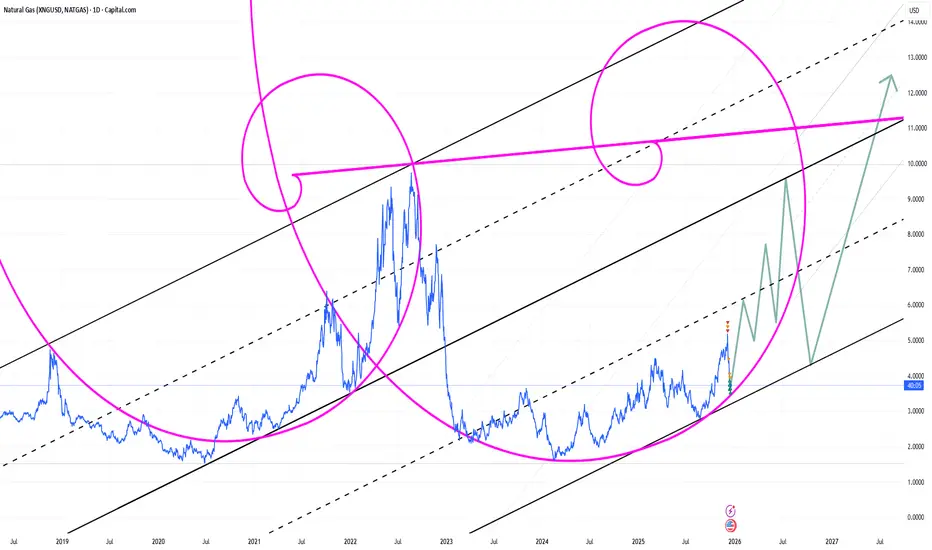
What Fibonacci trying to tell us !!!!!!In the markets, the Fibonacci spiral isn't just a pattern—it's an engine of momentum. It reveals where price action compresses, aligns, and ultimately explodes.
Think of a consolidation near a key Fibonacci level (like the 61.8% or 38.2% retracement) as the spiral winding tighter. This isn't random noise; it's energy being stored, a structural reformation where the market's natural growth geometry reasserts itself.
The moment price breaks decisively from this zone, it triggers the spiral's accelerating phase. This is why Fibonacci structures are powerful tools for identifying the launch point of sharp, impulsive moves—not for forecasting slow, grinding trends. They pinpoint where potential energy converts to kinetic momentum, offering a high-probability entry for capturing rapid expansion.
The Great Channel: The Great Reset from 9.5A Once-in-a-Decade Market Opportunity
The Great Channel thesis presents a compelling long-term market structure that is becoming increasingly difficult to ignore. From a macro-technical perspective, current price action suggests we may be trading at, or extremely close to, the lowest valuation level we are likely to witness over the next decade. Even the next cyclical low, should it occur, may still print at levels higher than today’s price.
This outcome is not guaranteed, but it represents one of the most probable scenarios on the table and one that now carries more conviction than ever before. The concept of the Great Channel first emerged in 2024 as a theoretical framework; however, evolving market behavior indicates that it may now be transitioning from hypothesis into structural reality. If confirmed, this channel has the potential to reprice the market into entirely new regimes.
Importantly, this structure does not conflict with the broader cup-and-handle formation that many long-term participants are tracking. On the contrary, the two patterns may be complementary, with the cup-and-handle reaching full maturity only after a potential Great Reset event. Such a reset could occur near the extreme boundaries of the Great Channel, precisely where asymmetric risk-to-reward conditions are most favorable.
From this vantage point, current levels may represent the most attractive strategic accumulation zone we are likely to see for many years to come. For patient, long-term traders and investors, this region offers a rare alignment of macro structure, technical positioning, and cyclical timing—an opportunity that may not present itself again for a very long time.

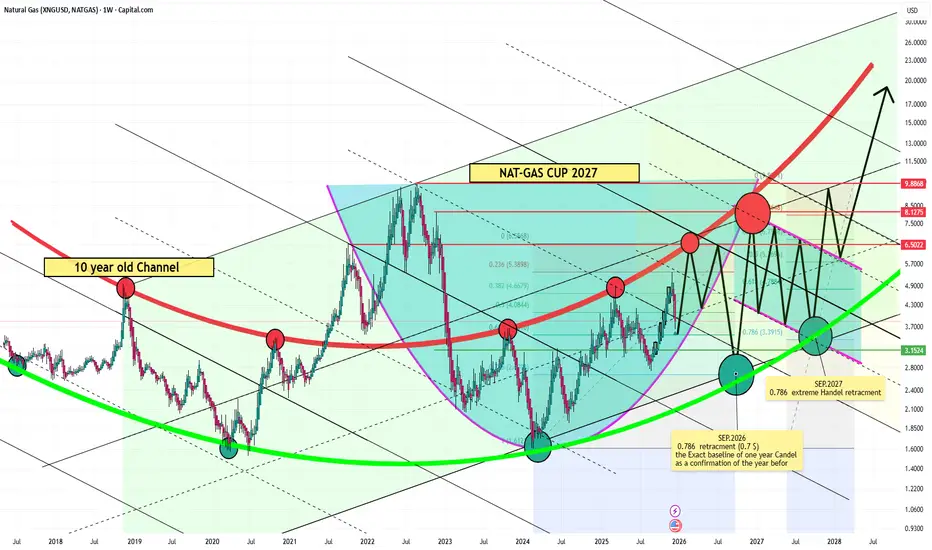
NAT-GAS World Cup 2027. ist Possible ??The chart was created purely out of curiosity to determine whether it might be possible. An idea that may seem unusual or unprecedented does not, in itself, invalidate its potential.
First time i have sugested the idea was in 2024 was also so crazy. but is it ?

Extended Scinario to Fall Zone from 8.5This scenario appears more plausible to me personally, and confirmation of it should emerge in March 2026 if the critical buying zone is reached. The period from March to April could represent a very strong buying opportunity, potentially serving as the final upward move toward the 8.5 area.
This reflects a personal opinion and general market perspective only. It is not investment, trading, or financial advice, and should not be interpreted as a recommendation to buy or sell any asset.

The Undeniable Chart of EverythingJune 2026 – A New Era: $3.2, the Price of No Return
This chart speaks for itself. Based on my experience and a clear reading of market dynamics, the rapidly accelerating demand for natural gas represents a structural shift rather than a temporary cycle. Natural gas is no longer merely a bridge fuel; it is becoming a foundational pillar of future energy systems, technological expansion, and global economic stability.
Natural gas is essential for powering next-generation data centers and AI infrastructure, where uninterrupted, high-density energy supply is non-negotiable. It plays a critical role in stabilizing renewable energy grids, providing rapid-load backup for wind and solar as electrification accelerates worldwide. In hydrogen production, natural gas remains the primary feedstock for blue hydrogen, enabling large-scale decarbonization of heavy industry long before green hydrogen reaches economic viability.
Beyond electricity, natural gas is indispensable in advanced manufacturing, petrochemicals, fertilizer production, and clean steel technologies. LNG continues to reshape global energy security, particularly in Europe and Asia, where long-term supply contracts are locking in demand well into the next decade.
Against this backdrop, a price level of $3.2 is not just undervalued — it represents a historical inflection point. As supply constraints tighten and demand growth becomes embedded, this is a price the market is unlikely to revisit. The era ahead is defined by scarcity, strategic relevance, and repricing.
The three highlighted danger zones mark areas where multiple sell cycles converge. These zones are historically risky for initiating long positions and instead represent optimal regions for identifying potential short or sell setups. A reversal from the darkest zone can unfold rapidly, often materializing as a single large bearish candle or two consecutive bearish candles on the weekly timeframe.
This reflects a personal opinion and general market perspective only. It is not investment, trading, or financial advice, and should not be interpreted as a recommendation to buy or sell any asset.

Long-Cycle Market Observation-4 steps all we needThis discussion is intended as a personal analytical framework rather than financial or trading advice. Its purpose is to highlight rare, high-impact market opportunities and to avoid unnecessary conflicts between competing scenarios, particularly around the potential double-top region near 6 to 6.4.
The focus is on four specific, numbered time windows:
1-January
2-February
3-March
4-June
These four periods alone are considered sufficient, from a purely hypothetical and educational perspective, to capture major market movements through 2026, without the need for frequent activity.
The underlying idea emphasizes restraint rather than constant engagement. Overexposure and excessive activity are viewed as the primary risks, while patience is regarded as the key factor. Upon reaching the fourth phase, the concept shifts away from short-term realization and toward a long-term, multi-year approach, allowing positions to evolve across multiple cycles instead of being closed prematurely.
This framework reflects a personal market philosophy focused on discipline, timing, and long-term perspective, and should be understood solely as a conceptual discussion.
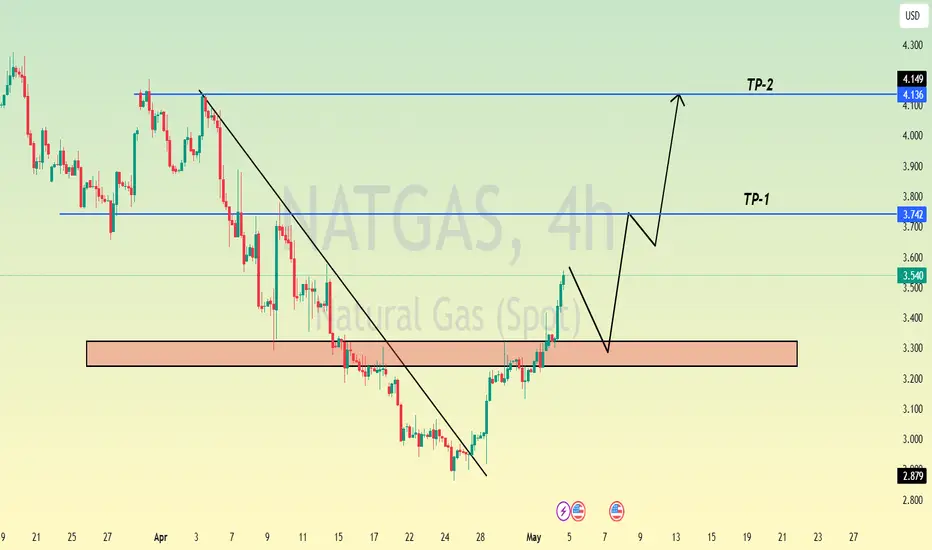
Natural Gas is in the Buying DirectionHello Traders
In This Chart NATGAS HOURLY Forex Forecast By FOREX PLANET
today NATGAS analysis 👆
🟢This Chart includes_ (NATGAS market update)
🟢What is The Next Opportunity on NATGAS Market
🟢how to Enter to the Valid Entry With Assurance Profit
This CHART is For Trader's that Want to Improve Their Technical Analysis Skills and Their Trading By Understanding How To Analyze The Market Using Multiple Timeframes and Understanding The Bigger Picture on the Charts

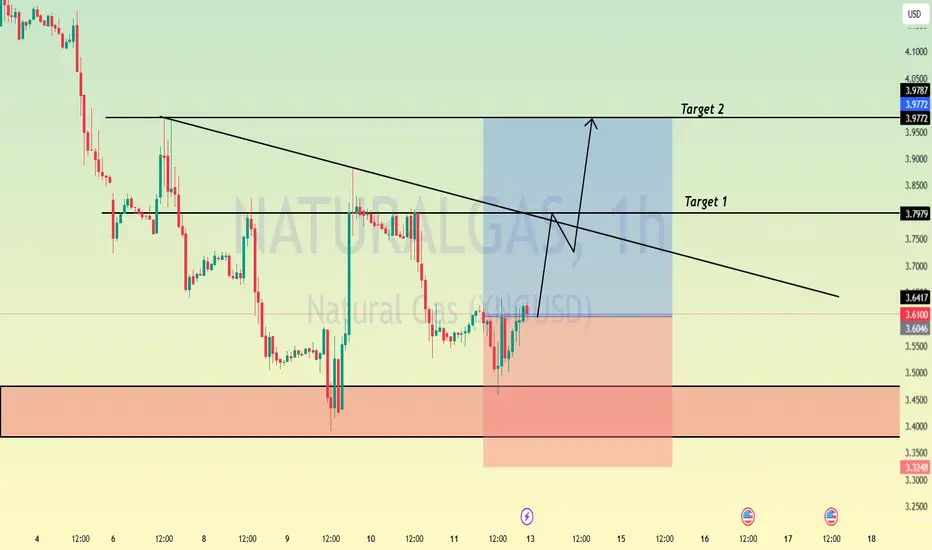
Natural Gas is in the Buying Direction After Trendline Breakout Hello Traders
In This Chart NATGAS HOURLY Forex Forecast By FOREX PLANET
today NATGAS analysis 👆
🟢This Chart includes_ (NATGAS market update)
🟢What is The Next Opportunity on NATGAS Market
🟢how to Enter to the Valid Entry With Assurance Profit
This CHART is For Trader's that Want to Improve Their Technical Analysis Skills and Their Trading By Understanding How To Analyze The Market Using Multiple Timeframes and Understanding The Bigger Picture on the Charts
Natural Gas is in the Buying DirectionHello Traders
In This Chart NATGAS HOURLY Forex Forecast By FOREX PLANET
today NATGAS analysis 👆
🟢This Chart includes_ (NATGAS market update)
🟢What is The Next Opportunity on NATGAS Market
🟢how to Enter to the Valid Entry With Assurance Profit
This CHART is For Trader's that Want to Improve Their Technical Analysis Skills and Their Trading By Understanding How To Analyze The Market Using Multiple Timeframes and Understanding The Bigger Picture on the Charts
Natural Gas is in the Buy DirectionHello Traders
In This Chart NATGAS HOURLY Forex Forecast By FOREX PLANET
today NATGAS analysis 👆
🟢This Chart includes_ (NATGAS market update)
🟢What is The Next Opportunity on NATGAS Market
🟢how to Enter to the Valid Entry With Assurance Profit
This CHART is For Trader's that Want to Improve Their Technical Analysis Skills and Their Trading By Understanding How To Analyze The Market Using Multiple Timeframes and Understanding The Bigger Picture on the Charts
