NATURAL GAS HEAD AND SHOULDERS??GOOD EVENING, HERE IS A POTENTIAL PAN OUT FOR NATURAL GAS. CURRENTLY AT NECKLINE OF WHAT COULD BE A COMPLETED HEAD AND SHOULDERS PATTERN, RIGHT SHOULDER JUST NEEDS TO DEVELOP! PRICE IS CURRENTLY AT A KEY SUPPLY/DEMAND ZONE AND A NICE REJECTION CANDLE ON LAST DAY, EXTREMELY GOOD RR IF THIS WAS TO COME IN BUT EVEN HALF THIS TARGET WOULD BE GREAT. THE MOVE WILL MOST LIKELY BE VERY IMPULSIVE AND TAKE A FEW WEEKS TO CLIMB TO TOP IF DOES GO THIS WAY.
I WOULD HIGHLY RECOMMEND HAVING A LOOK AT @MESZAROS & @RANDYFUEGO NATURAL GAS PUBLICATIONS FOR A MORE DETAILED PERSPECTIVE, LINK AT BOTTOM.
Natural

Two possible scenarios I am waiting to get a better entry either lower or after breaking this trend line.


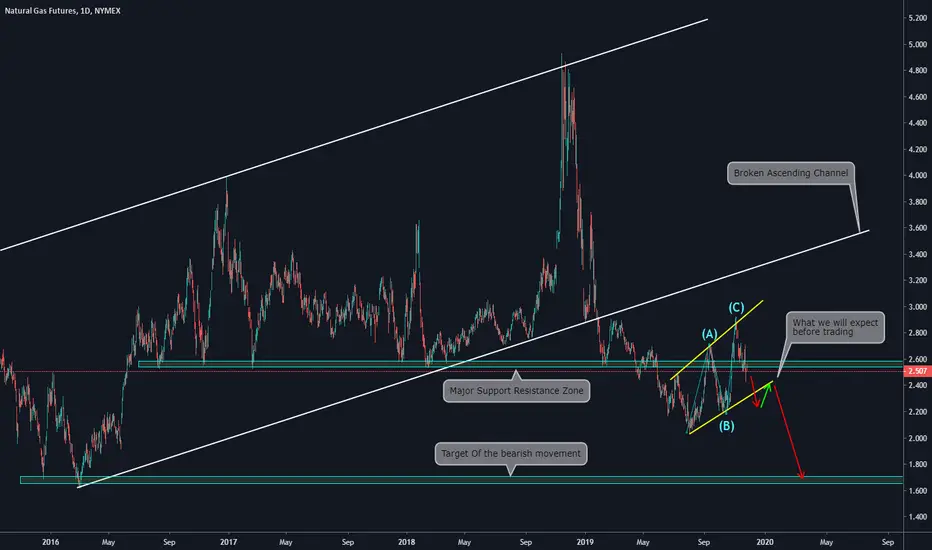
Analysis of Current situation on NATURAL GAS by ThinkingAntsOkUse this as a guide to develop your personal view of the chart.
Main items we observe on the Daily Timeframe:
a)Price Broke the ascending channel and the major Support/Resistance zone
b)Currently, the price is inside a Flag pattern on an ABC pattern with a clear structure (yellow lines)
c)These types of patterns are considered continuation structures (meaning that, from a technical perspective, when these structures are broken the price should continue on the same direction of the previous motive wave)
d)IF the price brakes below the lower trendline of the corrective structure we will look for a pull-back on a lower timeframe such as 4hs/1h and we will set our short orders (Entry below the 4h/1h structure, stop above it, and take profit on the lower support zone visible on the chart)
e)It is really important to have patience and wait for a proper confirmation before setting orders, your worst scenario should be NOT ENTERING THE MARKET.
Weekly Vision:

Natural Has Potential Head & Shoulders pattern. Could this be the long-awaited Head & shoulder pattern for the reversal of Natgas for the potential jump to 3.5$?
Well, we never know that but keep this pattern in mind. We are Bullish today if we see any candlestick confirmations.

Elliot triangle waveBroadening bottom.
Still in awkward position but I'm bull biased based on harmonic patterns.

Natural Gas: Lower Buy opportunity.NG is forming a Channel Up on 1W (RSI = 51.784, MACD = -0.011, ADX = 20.925, Highs/Lows = 0.0155) and is approaching the Demand Zone for a Higher Low. The 1D MACD shows that there is still some room to it, so be ready to buy lower (ideally well below the 1D MA50 once the Golden Cross takes place). Our Target Zone is 2.785 - 2.860.
** If you like our free content follow our profile (www.tradingview.com) to get more daily ideas. **
Comments and likes are greatly appreciated.

NatGas Short Idea Short Term IntradayNatgas travelling inside a channel. Use your own risk management.

Bitcoin is falling, as was naturally expected...The current fall of bitcoin is natural motion at this time. strange would be if we watched a high and the price back to 15k.
We are still in a long term downtrend. In my perception, we live the second big fall of bitcoin, which is still just a baby. however, the macro movement is bullish and remains an excellent long-term investment, something for life.
Maybe bitcoin will still reach 5500; if it does, it's worth selling some patrimonied to buy it.
Thanks ! (((*)))
Shaman

Natural Gas Down Trend - Scalp with DGAZNatural gas is setting up a a short term trend down before draw down season begins. I am currently owning shares of DGAZ at the price point of $107 and I will be waiting for $120-$130 before Thursday to sell out of my position. Currently, Dgaz is sitting at ~$112. Natural gas is trending down until draw down season fully comes into effect. I expect the price of NG to increase during the overnight/ morning futures before this Thursday when the bullish report comes out. After the report, NG should go up 2-8%, then continue the downtrend shortly after depending on how bullish the report is given the recent cold weather. Natural gas is waiting for draw down season / a new cold front before it will decide to move up with another big move. Keep your eyes on UGAZ if natural gas gets down below the $2.50 per bpu range before large storage deficits start to take place.

Natural Gas: Short opportunity near the monthly Resistance.Natural Gas is extending a strong 1D bullish leg (MACD = 0.113, Highs/Lows = 0.2976) which has entered into the overbought territory (RSI = 75.562). Being near the 1M (monthly) Resistance, the right conditions for a medium term short trade emerge. Even the 1D RSI is close to a Double Top and may follow the previous sequence of March - May 2019. Notice how the uptrend's lows are symmetrical with the downtrend's lows. Under these conditions our Target Zone is set at 2.500 - 2.450.
** If you like our free content follow our profile (www.tradingview.com) to get more daily ideas. **
Comments and likes are greatly appreciated.

Natural Gas - Go LongIf we compare past economic trends from our past in terms of our natural gas price, there are obviously many factors that contribute to the price of Natural Gas as well as the timings of the swings. Most often, natural gas will see price increases more often in the winter if we see unexpected changes in winter weather making it a seasonal bet.
In this chart I have compared the federal funds rate, the SPX 500, and the price of natural gas. These factors, from historical perspective, attribute to substantial correlation especially when we are near a market top. The more instability has shown to greatly change the price of natural gas and we can see shortly after markets reach substantial highs, natural gas has dropped to substantially low prices, then, shortly after, they correct in a substantial move. Politics play a huge factors in the price as well with political candidates speaking about banning fracking, most likely, this will be a positive for the natural gas price. Given a ban to fracking, basic economics states that when supply decreases, while demand remains constant, we will see price increases to the area of supply deficiency. Global warming can be looked at as a negative for natural gas prices as well, but the world is not heating fast enough to reduce demand for natural gas. In fact, we are seeing a rise in natural gas power plants as an alternative energy source given its low price compared to other fuel sources. Any increased demand will need to be met by an increased supply, but if natural gas prices do no rise we may see energy companies enter bankruptcy. It is my expectation that natural gas will slowly become an increasingly monopolized industry, this will be due to the factors I have listed above, but mostly because smaller companies will lose profitability potential and be forced to sell their assets to larger companies that are more sustainable.
a monopolized industry will raise natural gas prices overall, but we will maintain smaller price swings heading into the future. The reason for this is because we will see a huge possibility that the United States will nationalize the natural gas industry similar to the way we treat utility companies who provide us energy.
In the short term, going long natural gas should reap great reward as our economic expansion wanes especially as we are entering another winter.
Please post a comment below if you would like to discuss this idea further. I do understand there are many other driving factors to the price of natural gas.
Cheers,
AC


I’m almost ALL-IN enCore Energy Corp !Around €10.000.000 marketcap, 138 million total outstanding shares, an all-star team (probably the best for a smaller company) and 200-400 million lbs of uranium below their feet, while sold the biggest US based uranium resource in history for about €1.250.000.000 (more than 120x enCore’s current value). I’m truely obsessed by this company and having a big stake, farout my biggest holding. Will see a 20-100x or more within 3-5 years, very very little risk

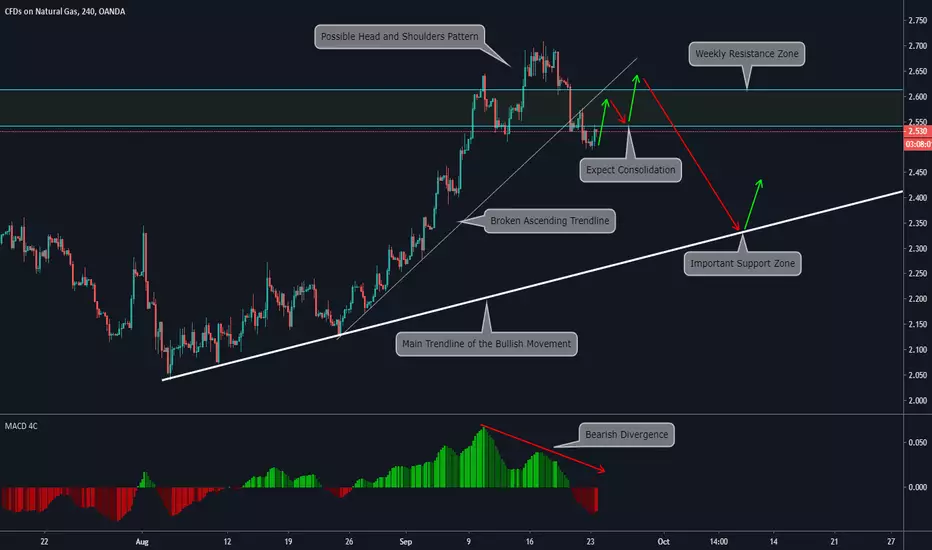
Top and Bottom Analysis on Natural Gas by ThinkingAntsOkUse this as a guide to develop your own setup
Main items we can see on the 4hs chart:
a)The price is against a Weekly resistance zone
b)We saw a clear rejection of that level
c)On MACD we can see a bearish Divergence showing the weakness of the current bullish movement
d)The current ascending trendline was broken
e)We will wait for an ABC pattern o something similar, the objective is to have a consolidation on the shown area
f)If that structure is made we will consider it as a clear Zone to short NATGAS towards the Main trendline of the bullish movement
Check the Higher timeframe analysis to make more sense of the 4hs chart
WEEKLY CHART:
DAILY CHART:

LONG NATURAL GAS FOR WINTERLONG NATURAL GAS GOING INTO US WINTER SEASON WITH STOP LOSS. TAKING PROFITS ON 50% UPSWING. CURRENTLY NEAR LONG TERM PRICE SUPPORT. SHOULD TAKE PROFITS AT ABOUT 3$.51 AS THIS WILL JUST FALL BELOW LONG TERM RESISTANCE

The Fredonia Gas Light Companyin 1858 the Fredonia Gas Light Company was founded.
Now, 161 years later I am long NatGas.

NATURAL GAS | SELLPerfect Short Entry for Natural Gas.
Its in Sellzone for this weeks pivots, next weeks pivots and this months pivots and it also rejected resistance and also top of channel.

Long Trade Idea on Natural Gas + Weekly view by ThinkingAntsOkUse this as a guide to develop your own setup
Main items we see on the 4hs chart:
a)Price is inside a descending channel
b)On MACD we can see a bullish divergence in the inner waves of the descending channel
c)On a closer look, we can see that the price broke out from the descending trendline and now is leaving a Pin bar on the zone
d)We will wait for a retest of the broken descending trendline and an ABC structure (like flag patterns) before taking long setups
e)Currently, this is just a trade idea we need to wait for more confirmations before opening positions.
Weekly vision:

Short $DGAZHello.
I haven't posted since forever, had a lack of motivation but guess whos back!
DGAZ is continuing with the same pattern than it was having on last decline push. 3 tops and immediately huge decline. Currently we're on 2 tops but the third time could be different. This could be last short potential for DGAZ for a little while as we don't really know which direction it will go after third top hit.
Very good opportunity once again.
IMPORTANT:
RISK & Reward ratio : 1:3 (6% - 18%)
