Natural


Natural Gas LONG: NGAS $3.2I think NGAS hit rock bottom for now. Moving into the winter with chilli temperatures incoming and a perfect trend reversal setup (STOCHRSI and MACD) I think it is very likely we see NGAS reach $3.2 + within the next two weeks. Very crucial to whether this will occur as planned are the inventories which based on past data and future expectations should be as or lower than forecasted, which in both scenarios NGAS should rally. Usually December is not a good month for NGAS, and that's why I hesitate to leverage this trade. I entered trade at $2.75 (didn't post here because of internet issues) and have a T.P $3.285 where I as per usual take 80% partial.

NGAS : Short this to 2.4, Where thy winter ?WXY pullback
Can be expected to touch the top. Start shorting from the red region.
I dont care about winter/weather or this or that.
I trade wave counts and patterns.
if you have fundamental issues pls dont take this trade,
and rest of you who do short, enjoy the ride with me.
I will be posting update on lower tf.
Enjoy Trading !

Natural Gas Short: Only for 1 dayI will be sorting Natural Gas for only 1 day (12/14/2016) I don't think Natural Gas has a clear direction right now, but I do think it is still in limbo, just at a lower level than expected. Thus I do forecast a drop back from the 10DMA levels of 2.737 to erase today's (11/14/2016) gains, but no movement lower, at least not this week.

Relief is over,time to rallyCyclicality and conditions of current price structure obviously point upward.
Fundamental USD weakness supports the conclusion.
Trade at your own discretion.


pennies to thousands long term natural gas big dividendhad big earnings surprise last quarter over 200 prercent increase could do it again long term damage over stabilizing
pays a dividen of 3 cents a quarter
technicals neutral use stop loss see our book on amazon about setting

GASL Bullish BreakoutShares of 3x Bull Natural Gas Related Equities ETF is trading just above a symmetrical triangle on above average volume following 3-months of sideways consolidation at the lows.

Natural Gas Ascending TriangleNatural Gas Ascending Triangle. Buy at triangle trend line or wait for breakout.


NGAS(Natural Gas) LONG BiasWait for the 4 HR candle to close above 0.236 fib level to execute long trade.
Confirmations : Retest of Daily Trendline, ABCD Formation, Monthly Hammer Formation
Complete Bullish Setup, Risk Reward trade (1:4)
Happy Trading :D

Natural Gas SetupSeems like NGAS bounced hard forming a bullish channel with a "stairs" pattern.
It's currently on the channel resistance so it sould go down by now.
We can also see a gap that should be filled at 2.260.
I recommend to sell on breakout or just buy the deep with a target to 2.260 gap.
Regards and happy trading!

Natural Gas monthly - Aug 18Axis line became support. 2.55 - is a very strong support-since records began. It truly looks like the bottom.
Let the red line break 2.976 and then let it be tested to see if it became the support or not n then go long.
It could really be a long of lifetime. However, if we break 2.55 then it's just a lost cause n short with both hands.
Make sure a clean break is done though.
Stop loss could be around 2.50- I don't suggest stop loss cause everyone has different loss taking capacity but in this
case it will be a lost cause to might as well get out.

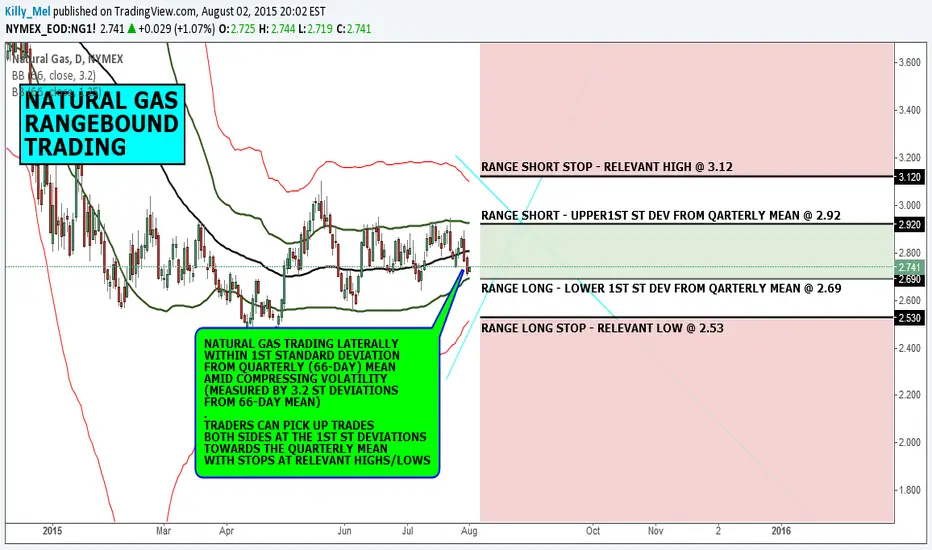
MACRO VIEW: NATURAL GAS RANGEBOUND TRADINGNatural gas is trading sideways within 1st standard deviation on quarterly basis (in relation to 66-day mean) since May 2015.
This creates good trading opportunities for those who know how to deal with the lateral chop in the markets.
Within compressing volatility (measure by 3.2 st deviations from the same mean), traders can pick longs and shorts toward the mean, when price approaches the 1st standard deviation from within.
Stops should be placed a bit beyond relevant highs and lows, tagging of which will hint that a leg of trend is actually in the cards.
NGAS Natural Gas Pitchfork Break DownNGAS Natural Gas Pitchfork Break Down
Natural Gas price has broken down out of its pitchfork channel from the peak of $3.1
Charting further test of support levels at 2.534, 2.471 and 2.437
I'm currently long and will be looking to reduce the average cost of my position by short selling.

Natural gas or oil provides more return in this recovery?One of the great feature I like with TradingView is the ability to compare different ticker via arithmetic addition/division/subtraction.
From here, I'm comparing between UNG and USO. Since both are directly related to energy, tough choice huh?
Charting it out helps a lot and we can see a clear breakout trend between the ratios!
Clearly Natural Gas (UNG) might possibility provide the best return for your money on energy as compared to Oil (USO) over the long run.
------------------------------------------
** Note: USO have been severely under performing since 2008 after the recovery of oil price due to the price difference between each month's oil futures contract. It will not be a clear reflection of the actual market.
This is only if you're considering between USO or UNG. Try it out by charting other ETF/ETNs/stocks by yourself!

Natural Gas Levels to trade offThese are the fair value and top/bottom edges to trade off on the daily chart. There is a clear rejection off the lows and it looks like price could move higher into liquidity above 5 as winter approaches.

Natural Gas ready for seasonal run upUGAZ spiked up on fundamental news last week, but dropped aggressively on Friday to test for supply before breaking out higher. The large players are not willing to mark up prices until they are sure that all the selling has dried up and they did this by gaping prices down to force the bears to show there hand. The volume was so low which means the bears are not interested in selling and the institutions have bought as much as they could on Friday. Now that the big boys know that there's no more sellers, they will be confident in marking up prices to the next level to fill the gap or higher at 22. Then price may fall back down to test the breakout level or keep going if price fails to drop. My final target is at 27 which is the fair value price on the monthly charts. As long as traders are willing to pay above fair value then price will rise to $22.
Stop loss is at 14.50, first target at 21, then the rest at 22 for next week. Once price breaks out above 18.72, there's no major resistance until 22.
Price is also back to the level of before the bullish fundmental news and the fundamentals have not changed so we are buying at a bargain. Worse upside target is price going back up to 18.72 the day of the news release.
nATURAL GAS NEW UPTRENDHi Traders,
As predicted, Natural Gas topped within the target area at 4.50-4.56. Then again, it retraced to another predicted target area at 4.21-4.18.
Now, Natural Gas should resume the uptrend to the area 5.10-5.13 and higher.
TARGETS
likely: 5.10-5.13
possibly: 5.37-5.38
ELLIOTT WAVES
This new uptrend is nothing more than "wave 3" of the recently started trend at 3.537. See the attached charts.

NATURAL GAS NEW UPTRENDHi Traders,
Natural Gas (now at 3800) started a major uptrend as 2 days ago as predicted. It's now to retrace a bit to 3760-43 before resuming the uptrend to 3924-50. That should mark the top of "sub-minuette wave 1".
As you can see by the 2-hours chart above we're still plenty of time to get on board for a long position.
ELLIOTT WAVES
The letter "C" at the bottom right of the chart marks the very end of major retracement wave C. That wave was part of large A-B-C downward correction started from the top at 6,481 on FEB 24, 2014. It bottomed at 3,537 on OCT 28.
TARGETS
first 3760-43
then 3924-50
PS: apologies for not providing more charts but I'm utterly busy.
Mario D. Conti.

Natural Gas Major Pivot PointHi Traders,
The end of the line of the downtrend of Natural Gas (now at 3601) is very much in sight. This sputtering downtrend is to be followed soon by a significant reversal that would mark the beginning of a major uptrend.
The attached 1-hour chart displays the sub-minuette waves 1 and 2 (in green, bottom right) as part of a group of a 5 waves down that should be completed at the beginning of the week.
At weekly and daily level, this is the very end of a major A-B-C retracement.
TARGETS
first down to the area 3515-3475
then up to the area 4163-4187
Cheers. Mario D. Conti
au.linkedin.com/in/sydneytraders/

Natural Gas Analysis for THE WINTER: "The Gas Could Explode"Everything can be seen or read on the CHART.
1. Winter Demand UP
2. If Dollar goes Down Price(NatGas) UP
3. Positive Technical Analysis
1.+2.+3. = ====>> to rocket UP; explode(?)
