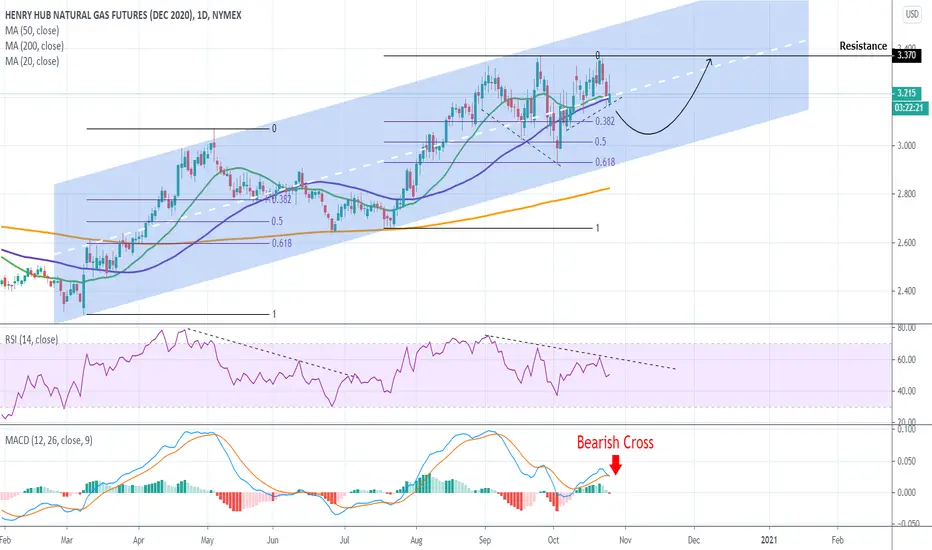
NATURAL GAS Long-term Buy SignalPattern: Channel Up on 1D.
Signal: Buy as the price bounced on the 1D MA200 which has been holding and acting as a buy entry since March 31. Also the RSI bounced on its multi-month Support level.
Target: 3.350 (right below the Resistance).
** Please support this idea with your likes and comments, it is the best way to keep it relevant and support me. **
--------------------------------------------------------------------------------------------------------
!! Donations via TradingView coins also help me a great deal at posting more free trading content and signals here !!
🎉 👍 Shout-out to TradingShot's 💰 top TradingView Coin donor 💰 this week ==> seba26-77
--------------------------------------------------------------------------------------------------------
Natural

Natural gas updatewe have seen natural gas drop significally since covid possible retracements
Please like and comment and follow for notifications.
ISSAFX1

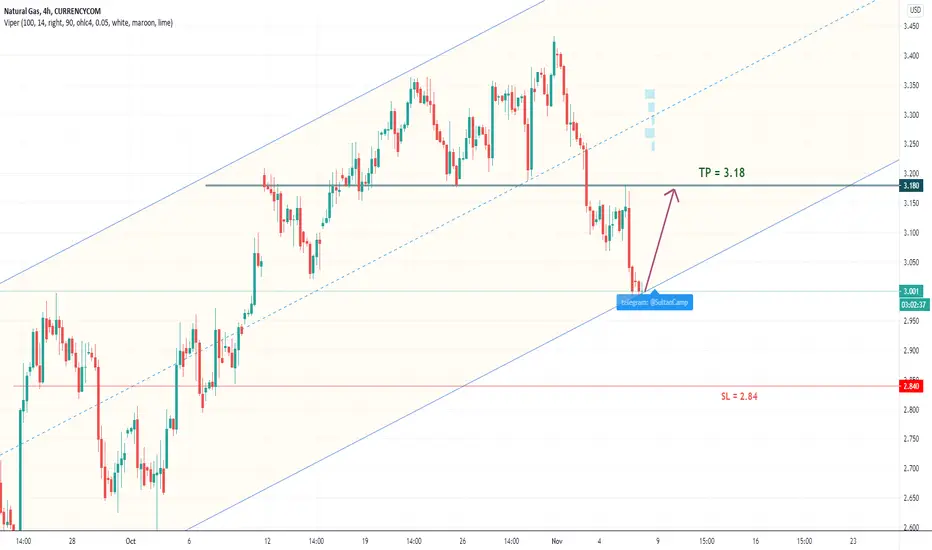
NATURAL GAS: long. /section fast transactions/Buy on 3.001
TP 3.18
SL 2.84
Information provided is only educational and should not be used to take action in the market.
This section is intended for short-term speculation. Be ready to leave a position at any time.
Natural GasAt Natural Gas, I found a very attractive chart. This is interesting to me. I found the highest performance back to the date 12 December 2005, with 16.475 points and the lowest performance on the date 18 February 1992 with 1093 points. I see a powerful movement every day with strong direction and seems not affected by the pandemic. Amazing. At this time, I need to watch on my watch list at moment. And when it comes to the best moment, I will make an excellent transaction for the long term.

NATURAL GAS Still some downside left before recoveryPattern: Channel Up on 1D.
Signal: Buy on the 0.500 Fibonacci retracement level.
Target: 3.350 (just below the Resistance).
** Please support this idea with your likes and comments, it is the best way to keep it relevant and support me. **
--------------------------------------------------------------------------------------------------------
!! Donations via TradingView coins also help me a great deal at posting more free trading content and signals here !!
🎉 👍 Shout-out to TradingShot's 💰 top TradingView Coin donor 💰 this week ==> TradingView
--------------------------------------------------------------------------------------------------------
NG: UNG: BOIL: Natural Gas testing support before moving higherFundamentals remain bullish. NG Natural gas futures are getting ready for December roll. November contract made a rally up to $3.1 on Wednesday and now is testing support at $2.97 - $2.95 level. A three dollar price level needs some digestion. To break above $3.2 December price will require support from colder weather forecasts and higher LNGs. Rise in seasonal demand is confirmed by weather forecasts for the second half of November and into December - January. Last week in October forecast has now turned colder predicting high national demand for the next week (NatGasWeather). Supply/demand balance is tightening. LNGs are at 8-8.5 bcf/d with expectations to increase to 10 bcf/d within the next a couple of weeks.
Technicals are pointing toward a pullback before the roll begins and prices move higher. Currently, support for November contract is seen at $2.97-$2.95 level. Even if lower prices are seen on Friday, the dip may represent a buying opportunity before the roll.

NG: UNG: BOIL: Natural Gas Upside Potential vs. Bearish WeatherNatural gas NG is getting ready to roll into higher priced December contract, Oct 25-29. The upside potential on a roll is $3.2 price level vs. current $2.8. However, weather forecast is bearish for the rest of the week and into early November. LNGs are higher at 8 bcf/d, but Cameron facility and Sabine pass are still blocked and expected to stay that way for the next a couple of weeks. NGI predicts trough in demand later this week. NatGasWeather predicts low national demand Tue -Fri on warming in high consumption areas. November contract may dip toward expiration.
Technical Indicators: MACD chart has formed a double bottom pointing to higher prices. RSI has potential for a move higher, but may also form an island top with a dip lower before going higher, should traders react negatively to bearish weather forecast for end of October - beginning of November.
The Volume bars on a price chart (see circle on top chart) showed limited buying at $2.8 level. Support for November contract is seen at around $2.7 level. Some analysts see support at $2.595 - $2.572 levels, should weather models lose TDDs later in October.
Higher prices on Monday afternoon were supported by cold shot over Plains and Rockies and trader optimism.


NG:UNG:BOIL: Natural Gas Futures testing supportNatural gas prices are testing support zone at $2.6-2.5. Price retracement on lighter US demand this week. However, LNG flows are back up to 7 bcf/d and are expected to keep increasing to 10 bcf/d later in October and November - December (NGI). Seasonal demand is expected to improve within the next 2 weeks. A cold shut this weekend, if confirmed, may change price action to bullish.

Will October be Déjà vu for NATURAL GAS?Quick observation here. NG traders that are deep into the commodity's technical dynamics agree that Natural Gas is trading on patterns that are cyclical on the very long-term.
If cyclical behavior and seasonality play a big part on this, then why should the month of October be any different? Every 4 years since 2012, NG makes a bottom around March-April, then rises aggressively up until October, which initiates a pull-back. That pull-back appears to be a Bull Flag for a new High a few months later.
Will history repeat itself?
** Please support this idea with your likes and comments, it is the best way to keep it relevant and support me. **
--------------------------------------------------------------------------------------------------------
!! Donations via TradingView coins also help me a great deal at posting more free trading content and signals here !!
🎉 👍 Shout-out to TradingShot's 💰 top TradingView Coin donor 💰 this week ==> AxelShadah
--------------------------------------------------------------------------------------------------------


Buy Natural GasNatural Gas and most oil and gas related commodities go up around winter (obviously). Not sure about this trade it had a good risk to reward ratio so obviously 👍. If taking this trade be careful and input multiple TPs.

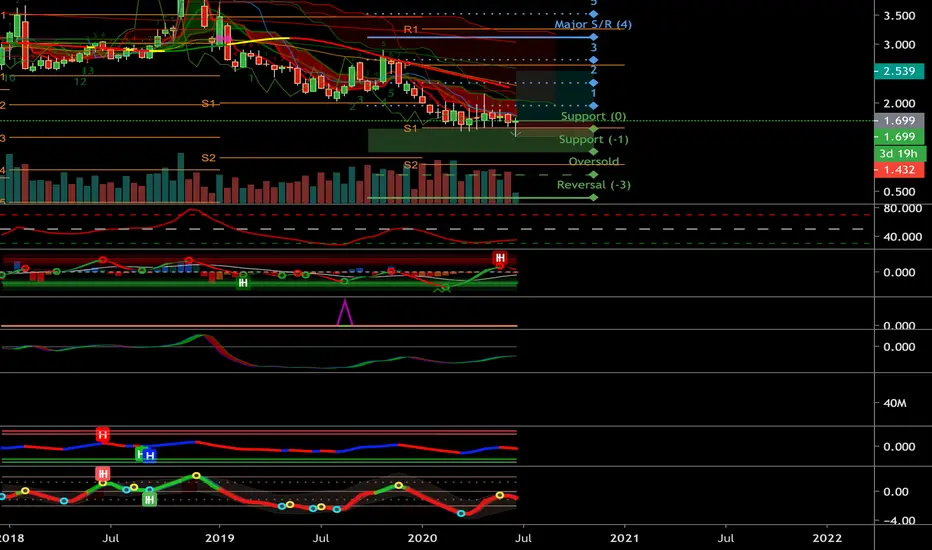
NG Major ReversalA ton of commodities are bottoming imo, this is one of them. Good r/r to long, recovery rally longs are always the best trades in terms of r/r.

SELL NATURAL GAS BELOW 20 EMA FOR 50 EMANATURAL GAS MOVING CLOSURE TO 50 EMA, A LITTLE SUPPORT AT 20 EMA. ADVICE TO SELL BELOW 20 EMA FOR TGT OF 50 EMA, A SHAPE OF REVERSE CUP WITH HANDLE IS ALSO FORMED IN MCX ON DAILY CHART. KEEP EARNING.

Perfect Falling Wedge Pattern: Bullish FormationThis is on the 2 HR chart on October Contract. Quite a bearish week. I still believe we are headed up. Very short time frame to have a full blown bearish continuation with winter right on the corner and demand expected to start rising with cooler temperatures. Also Hurricanes and storm season is upon us. Usually we see spikes in prices in September, October & November.
We’re reaching very strong support Zones. I believe this could have been a necessary correction for the bullish trend to come. I expect we go to somewhere around 2.7-2.8 where massive resistance is. We could go somewhat lower this week to where the scribbles are below the falling Wedge Pattern which gives us confirmation on a bullish run expected back to bullish trend upward lines.

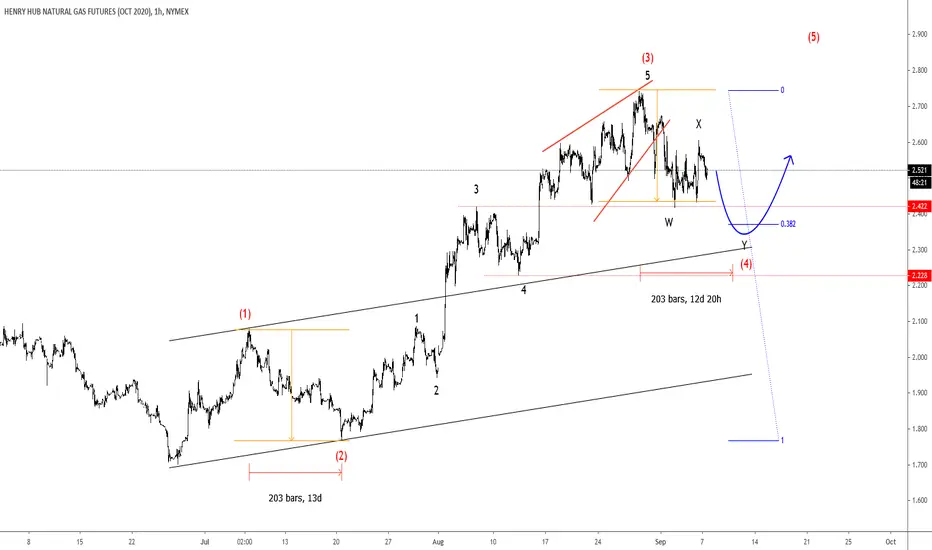
Natural Gas At Support - Elliott wave analysisHi traders,
Looking at natural gas, we are still tracking a correction in wave (4). Currently it is trading at 2.4 support level, which can be first potential turning point zone, however, in case of a deeper corrective W-X-Y, price can retest 38.2 Fibo. retracement and the base channel line (2.2 area), where support can also be seen.


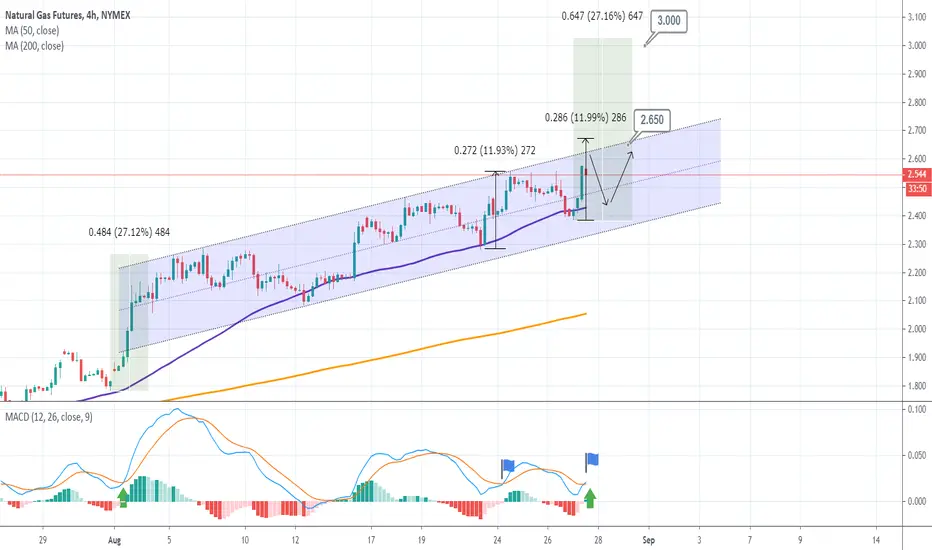
NATURAL GAS Trading PlanPattern: Channel Up on 4H.
Signal: Bullish on the 4H MA50 or if the Channel Up breaks upwards.
Target: 2.650 and if 2.680 breaks (+12% from low) potential extension towards 3.000 (+27% from low).
** Please support this idea with your likes and comments, it is the best way to keep it relevant and support me. **
!! Donations via TradingView coins also help me a great deal at posting more free trading content and signals here !!
NG: UNG: BOIL: Natural Gas Chart Forming a Top?Bullish factors: NG Natural gas price has been rallying for the past month reaching $2.5 level on increased consumption during summer months, improving LNG flows reaching 5.1 bcf/d in mid-August, and two tropical storms in the Gulf area threatening natural gas production. The fundamentals remain bullish going into mid September.
Bearish factors: Production is steady at about 92 bcf/day, while consumption has been declining to 83 bcf/day lately on cooling temperatures. Two tropical storms, Marco and Laura, are not expected to produce substantial disruption to natural gas production, but may produce loss in demand due to cooling temperatures and power outages.
Technical analysis: Divergence between price and volume is pointing toward a potential top. On a daily chart , RSI is above 70, approaching overbought territory. We have an unclosed gap at $2.77 level, which may be the next top.
National demand is expected to be cooling going into September. Overall demand will be driven largely by LNG exports, which are expected to remain steady at around 5 bcf/day, 10-20% below levels seen in the fall of 2019. The forward curve seems to be pricing in a more robust recovery in demand than actually observed.

NG: UNG: BOIL: Natural Gas Chart is Forming a TopBullish factors: NG Natural gas price has been rallying for the past month reaching $2.5 level on increased consumption during summer months, improving LNG flows reaching 5.1 bcf/d in mid-August, and two tropical storms in the Gulf area threatening natural gas production. The fundamentals remain bullish going into mid September.
Bearish factors: Production is steady at about 92 bcf/day, while consumption has been declining to 83 bcf/day lately on cooling temperatures. Two tropical storms, Marco and Laura, are not expected to produce substantial disruption to natural gas production, but may produce loss in demand due to cooling temperatures and power outages.
Technical analysis: Divergence between price and volume is pointing toward a potential top. On a daily chart, RSI is above 70, approaching overbought territory. We have an unclosed gap at $2.77 level, which may be the next top.
National demand is expected to be cooling going into September. Overall demand will be driven largely by LNG exports, which are expected to remain steady at around 5 bcf/day, 10-20% below levels seen in the fall of 2019. The forward curve seems to be pricing in a more robust recovery in demand than actually observed.
