Natural Gas weekly analysis Hey ,
the natural gas trend has been changed and the script is bullish at the current market scenario. There is a good position in the swing long.
Long: 209
Stop loss: 180
Target: 254
Time frame: 4-8 weeks
Naturalgassignals

Will October be Déjà vu for NATURAL GAS?Quick observation here. NG traders that are deep into the commodity's technical dynamics agree that Natural Gas is trading on patterns that are cyclical on the very long-term.
If cyclical behavior and seasonality play a big part on this, then why should the month of October be any different? Every 4 years since 2012, NG makes a bottom around March-April, then rises aggressively up until October, which initiates a pull-back. That pull-back appears to be a Bull Flag for a new High a few months later.
Will history repeat itself?
** Please support this idea with your likes and comments, it is the best way to keep it relevant and support me. **
--------------------------------------------------------------------------------------------------------
!! Donations via TradingView coins also help me a great deal at posting more free trading content and signals here !!
🎉 👍 Shout-out to TradingShot's 💰 top TradingView Coin donor 💰 this week ==> AxelShadah
--------------------------------------------------------------------------------------------------------

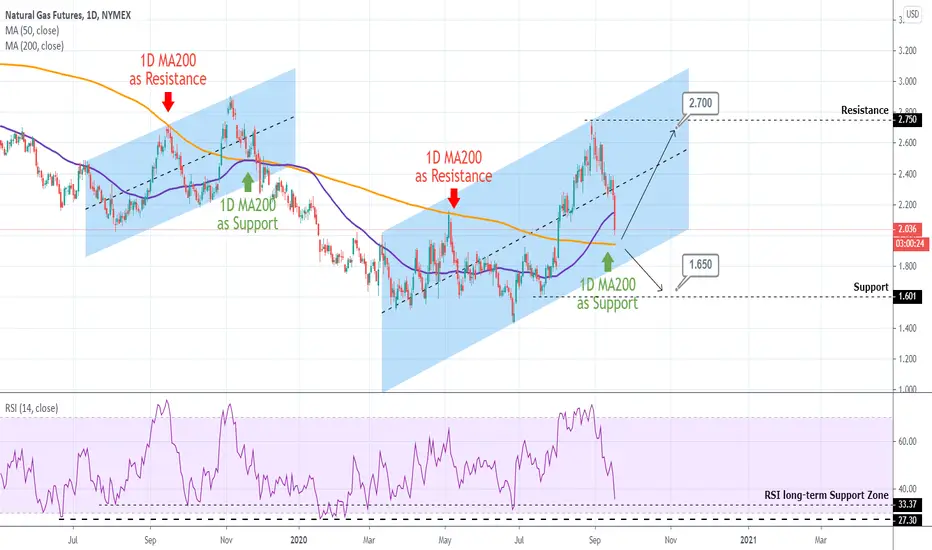
NATURAL GAS Trading PlanPattern: Channel Up on 1D.
Signal: (A) Buy as long as he price trades above the 1D MA200 (orange line) (B) Sell if it breaks below it.
Target: (A) 2.700 (right below the Resistance) (B) 1.650 (right above the Support).
*Note: the RSI is near its 1 year Support Zone. Only once this failed to initiate a bullish sequence.
** Please support this idea with your likes and comments, it is the best way to keep it relevant and support me. **
!! Donations via TradingView coins also help me a great deal at posting more free trading content and signals here !!
Shout-out to TradingShot's top TradingView Coin donor this week ==> CITIZENCAINE
Natural gas regular divergence, Short order
Regular divergence
Overbought
R1 Pivot
Short order at R1

NATURAL GAS Buy SignalPattern: Bullish Megaphone on 1D.
Signal: Bullish as the price bounced off the bullish trend-line. The 1D RSI is on an ascending Channel since February, indication that the bullish trend is getting stronger.
Target: 2.050 (Resistance).
** Please support this idea with your likes and comments, it is the best way to keep it relevant and support me. **

NATURAL GAS Buy SignalPattern: 1-month Channel Up
Signal: Bullish once the MACD turns bullish within the Triangle. Potential rebound zone as seen on chart.
Target: 2.030 (Resistance 1).
** Please support this idea with your likes and comments, it is the best way to keep it relevant and support me. **

NATURAL GAS Trading opportunitiesPattern: Channel Down with underlying Bearish Megaphone on 1D.
Signal: (A) Bearish if the price breaks the MA50 (blue line), (B) Bullish if the price breaks above the red Triangle.
Target: (A) 1.500 (just above the Support), (B) 2.140 (projected contact with the MA200 (orange line)).
Previous successful Buy Signal on Natural Gas:

NATURAL GAS Buy SignalPattern: Channel Down on 1D.
Signal: Bullish once the MACD makes the bullish cross.
Target: 1.700 (projected +15% rise from the low).
Previous signal:

NatGas Negative divergence and possible double-top on 4H!Going back to 2.375 by the end of next week if warmer weather and NatGas Storage numbers are supportive...

NATURAL GAS Sell SignalPattern: Channel Down on 1D.
Signal: Bearish as the price was rejected on the Lower High.
Target: 2.155 (the previous Lower Low and current Support). Extension can be made to 2.000 for risk seekers.

NATURAL GAS Sell SignalPattern: Channel Down on 4H.
Signal: Bearish as the price is near the Lower High.
Target: 2.350, which is the expected Lower Low based on fractal analysis.

NATURAL GAS Sell SignalPattern: 4H Channel Down.
Signal: Bearish after a Lower High was made yesterday.
Target: 2.641 (estimated Lower Low).

NATURAL GAS Buy Signal long termPattern: Fibonacci retracement.
Signal: Bullish as it rebounded on the 1M Suppport Zone.
Target: TP1 3.450 (0.382 Fibonacci) TP2 3.720 (0.500 Fibonacci).
