Nasdaq - Tech is rallying during 2026!💰Nasdaq ( TVC:NDQ ) is remaining totally bullish:
🔎Analysis summary:
The Nasdaq and the entire tech sector is about to finish a very strong year of 2025. Going into 2026, market structure remains totally obvious and is clearly showing massive upside potential. Every major dip, especially going into 2026, leads to a massive buying setup.
📝Levels to watch:
$25,000 and $21,000
SwingTraderPhil
SwingTrading.Simplified. | Investing.Simplified. | #LONGTERMVISION
NASDAQ 100 CFD

Nasdaq - Stocks are just heading higher!🚀Nasdaq ( TVC:NDQ ) is creating new all time highs:
🔎Analysis summary:
Tech stocks just finished an extremely strong year and we were offered quite a lot of buying opportunities during 2025. Looking at the higher timeframe, we could see a short term retracement going into 2026, but the underlying trend remains totally bullish.
📝Levels to watch:
$25,000
SwingTraderPhil
SwingTrading.Simplified. | Investing.Simplified. | #LONGTERMVISION

NASDAQ doesn’t move randomly. It hunts liquidity.CAPITALCOM:US100 Price is currently trading inside a broken OG zone, after a clear distribution phase from the premium area.
Market structure remains bearish, with lower highs and weak upside reactions.
Short-term outlook (15M)
• Price failed to hold above the broken OG zone
• No strong bullish displacement or acceptance above resistance
• Liquidity is still resting below current price
• Expectation: continuation to the downside to sweep short-term liquidity
Mid-term outlook (1H)
• Overall structure remains bearish
• Previous OG zone acting as resistance
• Unfilled liquidity remains below the range lows
• As long as price stays below the broken zone, shorts remain valid
My expectation
I expect price to take the liquidity below and deliver a minimum 50-point drop from the current levels.
Any pullback into the broken OG zone can be considered a sell opportunity, as long as structure does not shift.

NASDAQ 100 INDEX: Trade on the Long-Side, Breakout Incoming.Hello There,
the NASDAQ 100 INDEX recently formed interesting formational structures which caught my attention. Following the underlying price-actions a trade signal on the long-side is generated. Important here is to wait for the breakout above the neckline of the inverse head-and-shoulder formation.
__________________________________________________________________________________
REASON: Inverse head-and-shoulder formation, structural MA-bullishness, strong volume spikes.
__________________________________________________________________________________
Trade on the Long-Side Potential
ENTRY: 25600 - 25700
MINIMUM TARGET: 26200
EXPECTED TARGET RANGE: 26300 - 26500
MINIMUM STOP LOSS: 25200
__________________________________________________________________________________
In this manner, thank you for watching and happy new year!
__________________________________________________________________________________

Breaking: Fermi Inc. (NASDAQ; FRMI) Gearing for Bullish SpikeFermi Inc. (NASDAQ; NASDAQ:FRMI ) is eyeing a bullish breakout amidst bearish sentiment. The asset is set to break above the 61.8% Fib level to solidify the bullish thesis on $FRMI. The asset spike 7.58% in Tuesday's extended trading session.
With the RSI at 35, NASDAQ:FRMI is eyeing the $25 resistant zone as the asset is not overbought but on a position to capitalize on the dip and deliver a massive ROI.
Fermi Inc. (NASDAQ: FRMI) saw the price of their shares crater about 33% after the company revealed that a prospective anchor tenant ("First Tenant") for Fermi's Project Matador (the company's Advanced Energy and Intelligence Campus at Texas Tech University) terminated an agreement that would have advanced $150 million to help fund construction.
The company has billed Matador as a multi-gigawatt energy and data center development campus designed to support the accelerating needs of to-be-built AI infrastructure and "a first-of-its-kind energy campus to be built to power the AI revolution."
Fermi's announcement comes after it raised nearly $784 million in gross proceeds through the issuance of over 37 million shares at $21/share on October 2, 2025.
The First Tenant cancelation news and severe market reaction have prompted national shareholders rights firm Hagens Berman to open an investigation into whether Fermi may have previously misled investors about the strength of the First Tenant agreement.
Analyst Summary
According to 7 analysts, the average rating for FRMI stock is "Strong Buy." The 12-month stock price target is $30.86, which is an increase of 281.46% from the latest price.
About FRMI
Fermi Inc., doing business as Fermi America, operates as an energy and hyperscaler development company purpose-built for artificial intelligence era. It focuses on Project Matador, an approximately 11-gigawatt behind-the-meter energy generation and powered shell data center campus located in Amarillo, Texas.

Breaking: Antelope Enterprise Holdings Limited (AEHL) Surge 90%The shares of Antelope Enterprise Holdings Limited (NASDAQ: NASDAQ:AEHL ) surge over 90%. The asset is set to breakout of a bullish symmetrical triangle. With the RSI at 50, this gives more room for NASDAQ:AEHL to capitalize on the bullish spike.
In recent news, Antelope Enterprise Holdings Limited (NASDAQ: AEHL), today announced that its board of directors has approved a change of the Company’s fiscal year end from December 31 to September 30.
The Company plans to file a transition report on Form 20-F for the transition period of January 1, 2025 through September 30, 2025. The Company’s 2026 fiscal year will begin on October 1, 2025 and end on September 30, 2026.
CEO Ms. Tingting Zhang, stated: “This fiscal year change is intended to better align our reporting cycle with the Company’s operational and financial planning needs. We remain committed to high standards of financial reporting, transparency, and compliance.”
About AEHL
Antelope Enterprise Holdings Limited, through its subsidiaries, provides livestream e-commerce, and business management and information systems consulting services in the People's Republic of China and the United States. The company operates social media and various e-commerce platforms. It also provides business management consulting; information system technology consulting services, including the sales of software use rights for digital data deposit platforms and asset management systems.

NASDAQ100 Market Structure & Pullback Strategy📈 NAS100 / US100 — NASDAQ100
Index Market Trade Opportunity Guide (Day / Swing Trade)
🔵 Market Bias
Bullish Plan Active 🟢
Momentum structure remains positive with buyers defending higher demand zones on pullbacks.
🎯 Entry Strategy (Pullback-Based Execution)
Pullback-1: Buy above 25200 🔁
Pullback-2: Buy above 24900 🔁
📌 This plan focuses on buying controlled retracements within a bullish structure rather than chasing highs.
🛑 Risk Management (Stop Loss)
SL for Pullback-1: 25000
SL for Pullback-2: 24700
⚠️ Risk Disclaimer:
Dear Ladies & Gentlemen (Thief OG’s), adjust your Stop Loss based on your own strategy and risk tolerance.
I am not recommending using only my SL — risk management is fully your responsibility.
🏁 Take Profit / Exit Zone
Target: 26000 🎯
🚨 Police Force zone ahead:
Strong resistance + overbought conditions + potential bull trap + corrective risk detected.
➡️ Kindly escape with profits once price reacts in this zone.
⚠️ TP Disclaimer:
Dear Ladies & Gentlemen (Thief OG’s), I am not recommending using only my TP. Protect profits based on your own execution rules.
👀 Related Pairs & Assets to Watch ($ Correlation)
CAPITALCOM:US30 (Dow Jones) 🏭
Confirms broader US equity strength; divergence may warn of NAS100 slowdown.
FOREXCOM:SPX500 (S&P 500) 📊
Healthy correlation — continuation supports bullish NAS100 bias.
TVC:DXY (US Dollar Index) 💵
Sharp USD strength can pressure tech valuations.
TVC:US10Y / US Treasury Yields 📉
Rising yields = headwind for growth & tech stocks.
🧠 Fundamental & Economic Factors to Consider
🔹 Federal Reserve Outlook:
Rate-cut expectations or dovish commentary tend to support NASDAQ upside.
Hawkish tone or delayed cuts may trigger volatility or pullbacks.
🔹 Inflation Data (CPI / PCE):
Cooling inflation = bullish for growth stocks
Sticky inflation = risk of corrective moves
🔹 US Labor Market (NFP / Jobless Claims):
Weakening data supports rate-cut narrative → bullish NAS100
Overheating labor data may pressure equities
🔹 Big Tech Earnings & Guidance:
NAS100 is highly sensitive to mega-cap tech outlooks (AI, cloud, semiconductors).
Positive guidance fuels continuation; cautious outlooks invite corrections.
🔹 Upcoming High-Impact Events:
FOMC statements
US CPI / PCE releases
Major US tech earnings weeks
📌 Always reduce risk or lock profits ahead of high-impact economic releases.
🧩 Final Trading Insight
📈 Trend favors buy-the-dip, not emotional breakouts.
🎯 Respect resistance zones, secure profits early, and let structure — not emotions — guide execution.
👍 If this setup adds value, support with a LIKE, BOOST, or FOLLOW for more professional index trade plans.
Trade smart. Protect capital. Let the market pay you. 💼📊

SHOP Technical Outlook: SMA Pullback and Bullish Structure📈 SHOPIFY, INC. (SHOP) — Swing Trade Profit Playbook
Exchange: NASDAQ
Market Type: US Stocks
Trade Style: Swing Trade
Bias: Bullish Continuation
🧠 Market Thesis (Clean & Professional)
SHOP is showing bullish momentum confirmation after a Simple Moving Average (SMA) pullback, signaling renewed buyer strength and trend continuation potential. Price action remains constructive above key averages, favoring buy-the-dip and layered accumulation tactics rather than chasing a single entry.
This setup is designed for controlled risk participation while respecting volatility and pullbacks.
🟢 Trade Plan – Bullish SMA Breakout
Trend Status: Bullish
Trigger: Price holding above the Simple Moving Average (trend confirmation)
🎯 Entry Strategy (Layered Execution Style)
Instead of a single entry, this plan uses a layered limit-order approach, allowing flexibility and better average pricing during intraday or short-term pullbacks.
Example Buy Layers:
$150
$155
$160
$165
📌 You may add or reduce layers based on your own risk tolerance and position sizing model.
📌 This approach helps reduce emotional execution and improves average cost efficiency.
🛑 Risk Management
Stop Loss Zone: $145
This level invalidates the bullish structure and protects capital if momentum fails.
⚠️ Risk is personal — adjust stops based on your own system, timeframe, and position size.
🏁 Profit Objective
Primary Target: $190
Why this level matters:
Strong historical resistance
Overbought reaction zone
High probability of profit-taking pressure
📌 Scaling out partial profits near resistance is encouraged for capital protection.
🔍 Confluence Summary (Why This Works)
✔ SMA pullback confirmation
✔ Higher-timeframe bullish structure
✔ Layered entries reduce execution risk
✔ Clear invalidation & upside target
🌍 Fundamentals & Macro Factors Supporting SHOP
Shopify remains a core infrastructure player in global e-commerce
Growth driven by merchant services, payments, and subscriptions
Beneficiary of improving consumer spending trends
US tech sector strength continues to attract institutional flows
📊 Macro tailwinds to monitor:
US interest rate expectations
Consumer spending data
Nasdaq risk-on / risk-off sentiment
🔗 Related Symbols to Watch (Correlation Check)
NASDAQ:QQQ → Nasdaq strength supports SHOP momentum
NASDAQ:AMZN → E-commerce sentiment bellwether
NASDAQ:META → Digital commerce & ad-spend correlation
$SHOPUSD (Crypto proxy sentiment) → Risk appetite alignment
📌 Strong QQQ continuation increases probability of SHOP follow-through.
⚠️ Important Notes
This is a structured swing-trade idea, not a prediction.
Markets can invalidate any setup — discipline and risk control always come first.
✨ “If you find value in my analysis, a 👍 and 🚀 boost is much appreciated — it helps me share more setups with the community!”
#SHOP #Shopify #SwingTrading #USStocks #NASDAQ #BreakoutTrade #LayeredEntries #TechnicalAnalysis #RiskManagement #TradingViewIdeas 🚀📈

META Momentum Builds! Bullish Swing Trade Roadmap🚀 META: The Layered Entry Swing Play - AI Momentum Revival 📈
Executive Summary 💼
META Platforms sits at a pivotal technical juncture where institutional AI capex demand collides with short-term profit-taking. This swing trade targets the $720 resistance breach using a disciplined layered entry methodology — perfect for risk-managed traders seeking 3-5% upside with controlled downside.
📊 Trade Setup | Master Plan
Asset: 🔵 META (NASDAQ) | Meta Platforms, Inc.
Timeframe: Swing Trade (4-6 weeks)
Bias: 🟢 BULLISH (Support Zone Recovery)
Risk Appetite: Moderate to Aggressive
🎯 Entry Strategy | The Intelligent Layering System
Rather than chasing a single entry price, we employ a pyramiding buy-in method across key support zones. This reduces emotional trading and improves risk-reward at scale.
Multi-Layer Entry Points (Buy in Tranches):
Layer 1 (Initial Position): $638.50 — 2% account risk
Layer 2 (Dip Catch): $630.00 — 2% account risk
Layer 3 (Strength Reload): $650.00 — 2% account risk
Layer 4 (Breakout Confirmation): $660.00 — 1.5% account risk
Total Allocation: ~7.5% per full setup (adjust per your risk tolerance)
Rationale: Layering avoids the emotional cost of "missing" an entry and distributes your execution cost—professional traders call this dollar-cost averaging on entries.
🛑 Stop Loss | Discipline Wins Wars
Hard Stop: $610.00
Reasoning: Below this level, the daily chart's support at the 200-EMA fails. Loss = ~4-5% from average entry ($645), which is reasonable swing risk.
⚠️ DISCLAIMER: This stop-loss level is MY analysis only. You remain fully responsible for your risk. Consider your account size, leverage, and emotional tolerance before committing capital. Never risk more than 2% per trade.
🎪 Target Strategy | Know When to Take Profits
Primary Target (Resistance Police Force): 📍 $720.00
Why $720 Matters:
328-Period SMA (4-hour chart) typically acts as resistance during consolidated ranges
Overbought Territory Signal: RSI creeping above 70 = profit-taking zone
Technical Trap Warning: Large sellers often cluster here after gaps up
Psychological Level: Round numbers ($720) trigger algorithmic selling
Escape Plan: When price approaches $720, take 50% off the table to lock profits. Let remaining 50% run with a trailing stop at +3% below entry.
⚠️ DISCLAIMER: This target is NOT guaranteed. META could face: regulatory headwinds, macro rate shock, or competitor moves. You decide your exit—never marry a target. Protect your capital first.
📡 Related Pairs to Monitor (Correlation Watch) 🔗
1️⃣ NASDAQ:GOOG (Google / Alphabet Inc.) — POSITIVE CORRELATION (+0.82)
Key Insight: Both compete in AI advertising and data-center infrastructure. If GOOG rallies, META usually follows.
Watch: GOOG breaks above $200 = risk-on sentiment for META.
2️⃣ NASDAQ:TSLA (Tesla, Inc.) — MODERATE POSITIVE CORRELATION (+0.71)
Key Insight: Both are "mega-cap AI/Tech bets." TSLA weakness can drag META down (flight to safety).
Watch: TSLA support breaks = potential META correction into your layers.
3️⃣ NASDAQ:AMZN (Amazon.com) — POSITIVE CORRELATION (+0.76)
Key Insight: AWS AI infrastructure play; if AMZN capex concerns flare, META suffers (shared narrative).
Watch: AMZN guidance = signal for META's data-center spend outlook.
4️⃣ AMEX:SPY (S&P 500 ETF) — MODERATE CORRELATION (+0.68)
Key Insight: Macro beta. Fed rate decisions move SPY; SPY moves all mega-caps.
Watch: CPI data Dec 18, 2025 at 8:30 AM ET = critical catalyst.
5️⃣ TVC:VIX (Volatility Index) — NEGATIVE CORRELATION (-0.55)
Key Insight: Rising VIX = fear. META can gap down on broad market panic.
Watch: VIX above 20 = consider tightening your stop or waiting for another layer signal.
💡 Key Technical Confluences
✅ Why This Setup Works:
Layered entries = you're never "too early" or paying too much
52-week range sits between $480–$796 (META has room to $720) 📈
Analyst consensus = "Strong Buy" with targets ~$832 median
AI capex narrative = earnings growth driver into Q1 2026
Dividend pay date Dec 23 = pre-holiday consolidation likely
❌ Risks to Abort:
Breaking below $610 = trade is invalid; exit immediately
Regulatory shock (FTC enforcement) = gap down risk
Macro CPI shock Dec 18 = volatility surge, potential liquidation
Competitive loss to GOOG/AMZN AI = narrative reversal
📈 Risk Management Checklist
Before you trade this setup:
Do you understand layering reduces timing risk? ✅
Is your stop at $610 within your risk tolerance? ✅
Have you calculated max loss? (e.g., 7.5% × 2% per layer = ~$150 per $1000 risked) ✅
Is $720 target realistic in 4-6 weeks? (YES—analyst upside + technical confluence) ✅
Will you stick to your exit plan, or will greed override? ⚠️ (This is the real test!)
🎬 Action Plan | Execution Timeline
Week 1 (Dec 18–22): Place Layer 1 & 2 buy orders. Watch CPI data (Dec 18, 8:30 AM ET).
Week 2–3: Scale into Layers 3 & 4 on any dips. Monitor GOOG/AMZN correlation.
Week 4–6: Approach $720; take 50% profit at resistance. Manage trailing stop on remainder.
Exit Plan: TP hit = reduce risk. SL hit = accept loss, move on. No "hope trading."
📝 Disclaimer & Fun Caveat
🎭 This is a "playful but serious" swing-trade idea. It's designed for entertainment AND education—think of it as how a mischievous but disciplined trader (our "thief trader OG") approaches META with style, humor, and risk management.
✨ Closing Thought
If you find value in this analysis, a 👍 and 🚀 boost is much appreciated — it helps me share more setups with the community!
#META #SwingTrade #TechStocks #AITheme #LayeredEntry #TradingView #StockMarket #NASDAQ #Bullish #MoneyManagement
#RiskManagement #ProfitTaking #TechnicalAnalysis #StockAnalysis #TradeSetup #LongBias #2025Trading

NAS100 Shows Strong Bullish Structure After Pullback📈 NASDAQ100 (NAS100) | Bullish Swing Trade Opportunity 🎯
Market Trade Opportunity Guide — SMA Pullback Strategy
🔥 TRADE SETUP SUMMARY
Asset: NAS100/US100 (NASDAQ-100 Index)
Timeframe: Swing Trade
Strategy: Bullish Simple Moving Average (SMA) Pullback
Bias: 🟢 BULLISH CONFIRMED
📍 ENTRY POINTS
Flexible Entry Strategy:
✅ Any price level entry acceptable (DCA approach recommended)
✅ Optimal entry zones: SMA support pullback levels
✅ Consider scaling into positions on dips
✅ Volume confirmation at entry crucial for momentum
🛑 STOP LOSS MANAGEMENT
Primary SL Level: 25,200
⚠️ DISCLAIMER: This is a reference level only. Adjust your stop loss based on:
✓ Your personal risk management strategy
✓ Individual account risk tolerance
✓ Position sizing preferences
✓ Your trading experience & capital allocation
Your responsibility: Set SL that fits YOUR risk profile. Don't rely solely on suggested levels.
🎯 PROFIT TARGETS
Primary Target: 26,100
Key Resistance Factors:
📊 High voltage resistance zone
📈 Overbought conditions detected
⚡ Trap risk at elevated levels
💡 Recommend: Take partial profits, don't go all-in
⚠️ DISCLAIMER: TP level is reference only. Manage profits based on:
✓ Your personal trading objectives
✓ Risk/reward ratio preferences
✓ Market momentum confirmation
✓ Your own technical analysis
Exit Strategy: Capture gains systematically. Don't be greedy—take money when available.
📊 RELATED PAIRS TO MONITOR (Correlation Analysis)
Major USD Pairs to Monitor:
EUR/USD 💶 — Current: 1.1713 | Bias: 🔵 Bearish $ | Correlation: INVERSE (Risk sentiment driver)
GBP/USD 🇬🇧 — Current: 1.3381 | Bias: 🔵 Bearish $ | Correlation: INVERSE (Tech growth proxy)
USD/JPY 🇯🇵 — Current: 155.00 | Bias: 🟢 Bullish $ | Correlation: INVERSE (Carry trade impact)
USD/CAD 🇨🇦 — Current: 1.38 | Bias: 🔵 Bearish $ | Correlation: INVERSE (Risk-off correlation)
Correlation Insights:
Weaker USD = Better for tech stocks (positive NAS100). Stronger JPY carry = Risk-off mood (negative NAS100). Watch EUR/USD & GBP/USD for broader sentiment shifts—these are your early warning indicators for tech sector rotation.
🌍 FUNDAMENTAL & ECONOMIC FACTORS (December 2025)
Fed Monetary Policy 🏦
✅ Latest Decision (December 10, 2025):
Rate cut: 25 basis points (0.25%)
New target range: 3.50%-3.75%
3rd consecutive rate cut in 2025
Divided vote: 9 for cuts, 3 dissenting
Market Implication: Powell signals "patience" on further cuts—limited cuts expected in 2026 (only 1-2 projected). This is a headwind for aggressive tech rallies but supports intermediate tech strength.
Inflation Status 📊
PCE Inflation (September 2025): 2.8% (above 2% target)
Trend: Inflation moved UP since earlier 2025, remains "somewhat elevated"
Outlook: Expected to remain above 2% through 2026
Tariff Risk: Trump tariffs expected to push inflation higher in 2026
Market Implication: Persistent inflation limits Fed's ability to cut rates aggressively. Tech valuations face pressure from higher rates. Expect volatility from tariff-related inflation surprises.
Employment & Labor Market 👥
Job gains: Slowed significantly in 2025
Unemployment rate: Edged up through September (at 4.4%)
Fed assessment: "Downside risks to employment rose in recent months"
Tone: Labor market showing weakness, supporting rate cuts
Market Implication: Weaker jobs data = positive for equities (lower rates). But lack of October/November data due to govt shutdown creates uncertainty going into 2026.
Economic Growth 📈
GDP Growth (Fed projection 2026): 2.3% (raised from 2.0%)
Current pace: "Moderate expansion" of economic activity
Outlook: Modest growth expected, not recessionary
Market Implication: No recession expected. Growth supports equity rallies like NAS100, but tariffs could dampen 2026 growth trajectory.
Key Macro Risks for 2026 ⚠️
Tariff Impact: Trump tariffs likely to increase inflation and reduce growth
Rate Uncertainty: Fed Chairman succession unclear; policy direction murky
Government Data Gaps: October/November data delayed; information asymmetry high
Market Expectations Divergence: Fed members divided on future rate path
Bond Yields: Higher yields = headwind for high-multiple tech stocks
📅 KEY UPCOMING EVENTS TO WATCH
January 2026: Fed Chair decision; delayed employment/inflation data releases
Q1 2026: Tariff implementation timeline clarity
2026 FOMC Meetings: Only 1-2 rate cuts priced vs. 3+ in 2025
🎯 TRADE BIAS CONCLUSION
Technical: 🟢 Bullish (SMA support confirmed)
Macro: 🟡 Cautious (Fed pause, tariff uncertainty)
Composite: 🟢 BUY dips toward 25,200 | Target 26,100 | Manage risk aggressively
📌 RISK DISCLAIMER
✅ All trading involves risk. No guarantees on outcomes.
✅ Past performance ≠ future results
✅ Use proper position sizing & risk management
✅ Trade with only capital you can afford to lose
✅ This is analysis, not financial advice

NASDAQ: Bring On The Santa Rally! Short Term Buys!Welcome back to the Weekly Forex Forecast for the week of Dec. 22-26th.
In this video, we will analyze the following FX market: NASDAQ (NQ1!) NAS100
The NASDAQ is reaching towards the relative equal highs, and maybe with the help of a
Santa Rally, it gets their!
I like the fact that the market closed the last two days of last week with bullish candles. I expect to see some follow through into early next week.
Enjoy!
May profits be upon you.
Leave any questions or comments in the comment section.
I appreciate any feedback from my viewers!
Like and/or subscribe if you want more accurate analysis.
Thank you so much!
Disclaimer:
I do not provide personal investment advice and I am not a qualified licensed investment advisor.
All information found here, including any ideas, opinions, views, predictions, forecasts, commentaries, suggestions, expressed or implied herein, are for informational, entertainment or educational purposes only and should not be construed as personal investment advice. While the information provided is believed to be accurate, it may include errors or inaccuracies.
I will not and cannot be held liable for any actions you take as a result of anything you read here.
Conduct your own due diligence, or consult a licensed financial advisor or broker before making any and all investment decisions. Any investments, trades, speculations, or decisions made on the basis of any information found on this channel, expressed or implied herein, are committed at your own risk, financial or otherwise.

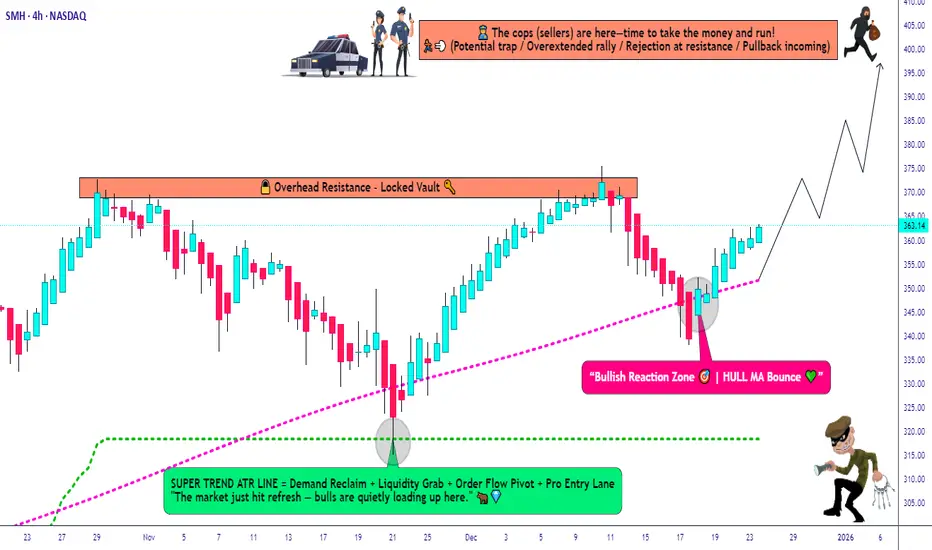
SMH Bullish Structure Confirmed — Pullback Strategy Active!🎯 SMH Semiconductor Heist: The $400 Target Caper 💰🚀
📊 Asset Overview
VanEck Semiconductor ETF (SMH) - NASDAQ Listed
Trade Type: Swing Trade (Bullish Setup)
Strategy Style: "The Thief Method" - Layered Entry Approach 🏴☠️
🔍 Technical Analysis Breakdown
📈 Bullish Confirmation Signals
✅ Supertrend ATR Indicator: Bullish pullback confirmed
✅ HULL Moving Average: Clean retest and bounce pattern detected
✅ Market Structure: Higher lows forming with momentum building
The setup is cooking like a perfectly timed bank job - all the technical stars are aligning! 🌟
💼 The "Thief Strategy" Game Plan
🎯 Entry Strategy (Layered Limit Orders)
Multiple Buy Limit Layers:
🥇 Layer 1: $340.00
🥈 Layer 2: $345.00
🥉 Layer 3: $350.00
💎 Layer 4: $355.00
Note: You can add more layers based on your position size and risk appetite! This "scaling-in" approach reduces timing risk and averages your entry price. Think of it as sending multiple agents into the vault instead of going all-in at once! 🕵️♂️
🛑 Risk Management
⚠️ Stop Loss Zone
Thief's Emergency Exit: $335.00
Disclaimer: This is MY stop loss level based on technical invalidation. You're the captain of your own ship! 🚢 Set YOUR stop loss based on YOUR risk tolerance and account size. Risk management is personal - what works for a $10K account differs from a $100K account!
🎯 Profit Target
💰 Take Profit Zone
Primary Target: $400.00
Reasoning:
🚧 Major resistance confluence zone ("Police Barricade" level)
📊 Historical supply zone where sellers previously appeared
⚠️ Potential overbought conditions expected at this level
🪤 Bull trap risk increases as retail FOMO kicks in
Disclaimer: This is MY target based on technical analysis. YOU make the final call! Scale out partially at psychological levels ($375, $385, $390) if you prefer to lock profits along the way. Remember: "Pigs get fed, hogs get slaughtered!" 🐷
🔗 Related Pairs to Watch (Correlation Analysis)
📱 Individual Semiconductor Stocks:
NASDAQ:NVDA (NVIDIA) - AI chip leader, ~10% weight in SMH
NASDAQ:AMD (Advanced Micro Devices) - Strong correlation with SMH
NASDAQ:AVGO (Broadcom) - Networking chips, infrastructure play
NYSE:TSM (Taiwan Semiconductor) - Foundry leader, bellwether for sector
NASDAQ:INTC (Intel) - Legacy chips, inverse correlation at times
NASDAQ:QCOM (Qualcomm) - Mobile chips, 5G exposure
NASDAQ:ASML (ASML Holding) - Chip equipment, leading indicator
📊 Broader Market ETFs:
NASDAQ:QQQ (Nasdaq-100) - Tech-heavy index with high SMH correlation
AMEX:SPY (S&P 500) - Overall market sentiment gauge
NASDAQ:SOXX (iShares Semiconductor ETF) - Direct competitor/confirmation
AMEX:XLK (Tech Sector SPDR) - Broader tech exposure
Key Correlation Points:
🔸 SMH typically moves with NVDA and AMD momentum
🔸 Watch NYSE:TSM for Asian market sentiment on chips
🔸 Rising NASDAQ:QQQ usually lifts all semiconductor boats
🔸 NASDAQ:SOXX divergence from SMH can signal sector rotation
🌍 Fundamental & Economic Factors
📰 Macro Catalysts to Monitor:
💡 Positive Factors (Bullish):
🤖 AI Boom Continuation: ChatGPT, autonomous vehicles, data centers = insatiable chip demand
🏭 CHIPS Act Funding: US government subsidies for domestic semiconductor production
📱 5G Rollout: Global infrastructure upgrades driving chip sales
🎮 Gaming & Crypto: GPU demand remains elevated
📈 Inventory Restocking Cycle: Post-2023 correction, supply chains normalizing
⚠️ Risk Factors (Watch Closely):
🇨🇳 China-Taiwan Tensions: Geopolitical risk (TSM produces ~90% of advanced chips)
💵 Fed Interest Rate Policy: Higher rates = lower tech valuations
📉 Economic Slowdown Fears: Recession = reduced corporate IT spending
🚫 Export Restrictions: US-China chip technology trade wars
📊 Inventory Glut Risk: Oversupply if demand weakens suddenly
📅 Key Events to Track:
Quarterly earnings from NVDA, AMD, TSM (guidance is crucial!)
Federal Reserve rate decisions (tech is rate-sensitive)
US-China trade negotiations
Monthly semiconductor sales reports (SIA data)
🎭 The Thief's Philosophy
This isn't your grandpa's "buy and hold" strategy - this is active swing trading with style! 😎 We identify the setup, execute with layers, manage risk like professionals, and exit before the party turns ugly. No emotional attachment, no hopium - just cold, calculated profit extraction! 🧊💰
Remember:
✨ The market doesn't care about your mortgage payment
✨ Technical setups fail sometimes - that's why we use stops
✨ Taking profits is NOT a crime (despite the "Thief" branding! 😂)
✨ Live to trade another day > revenge trading losses
✨ If you find value in my analysis, a 👍 and 🚀 boost is much appreciated — it helps me share more setups with the community!
🏴☠️ Happy Trading, Fellow Thieves! May your stops never get hit and your targets always fill! 💎🙌
NASDAQ NAS100 Technical Analysis and Trade IdeaThe NAS100 is currently in a strong bullish trend 🚀. Price has been pushing higher with momentum and is now trading into a key resistance zone. We could see a short-term pullback as traders lock in profits, but overall, the trend looks ready to continue ↗️.
Keep an eye on any market-moving events later today—they could either accelerate the trend or trigger a deeper retracement. If the bullish momentum holds, a pullback might offer a good opportunity to join the trend for a continuation trade 💪.
⚡ Key Points:
NAS100 trending bullish 📈
Approaching resistance, watch for pullback ↘️
Potential continuation trade on strength 🔥

OPEN: Time to Accumulate? Layer Entry Method Explained🎯 OPEN: The Heist is ON! 🏠💰 Strategic Swing Trade Setup
📊 Asset Overview
Ticker: OPEN (Opendoor Technologies Inc.)
Exchange: NASDAQ
Trade Type: Swing Trade
Bias: 🐂 BULLISH
🎭 The Master Plan: "Operation Real Estate Robbery"
Listen up, fellow wealth redistributors! 👋 Opendoor's chart is screaming opportunity louder than a house alarm at 3 AM. We're setting up a classic layered accumulation strategy (aka "The Thief's Multi-Pocket Approach") to maximize our position while managing risk like professionals.
🚪 Entry Strategy: The Layered Infiltration Method
Primary Approach: Multiple Limit Orders (Ladder Strategy)
Instead of going all-in at one price (rookie move 😅), we're spreading our capital across strategic levels:
Recommended Entry Layers:
🎯 Layer 1: $6.50
🎯 Layer 2: $7.00
🎯 Layer 3: $7.50
🎯 Layer 4: $8.00
Flexibility Note: You can adjust the number of layers and position sizing based on your capital and risk appetite. Some traders prefer tighter layers ($0.25 increments), others go wider. Make it yours! 💪
Alternative: If you prefer simplicity, current market price entry works too, but layering gives you better average cost basis on dips.
🛡️ Risk Management: The Escape Hatch
Stop Loss: $6.00
⚠️ Important Disclaimer: This SL level is based on technical structure, but YOU are the captain of your own ship. Adjust based on:
Your risk tolerance
Account size
Market volatility
Personal trading rules
Risk Management Tip: Never risk more than 1-2% of your total capital on a single trade. Set your position size accordingly!
🎯 Target: The Grand Exit
Primary Target: $10.00
At this level, we're expecting:
🚨 Strong resistance zone
📈 Potential overbought conditions
Possible bull trap area
💰 Excellent risk-reward ratio
Scaling Out Strategy (Advanced Move):
Consider taking 30-50% profits at $9.00-$9.50
Trail stop-loss on remaining position
Lock in gains progressively
Remember: Nobody went broke taking profits! 💵 If the market gives you money, take it. Don't get greedy waiting for the "perfect" exit.
🔗 Related Assets to Watch
Keep these correlated symbols on your radar for confluence:
📍 $Z (Zillow Group) - Direct competitor in real estate tech, strong correlation with OPEN's price action
📍 BLACKBULL:RDFN (Redfin Corporation) - Another proptech player, moves in sympathy with sector sentiment
📍 NASDAQ:EXPI (eXp World Holdings) - Real estate brokerage, broader sector health indicator
📍 AMEX:IYR (iShares U.S. Real Estate ETF) - Overall real estate sector strength/weakness gauge
📍 AMEX:XHB (SPDR S&P Homebuilders ETF) - Housing market sentiment indicator
Correlation Logic: When real estate tech and housing sectors show strength, OPEN typically benefits. Conversely, sector weakness can drag OPEN down regardless of individual fundamentals. Watch for divergences—they often signal important reversals! 🔄
📈 Technical Synopsis
This setup combines:
✅ Strategic layered entries for optimal positioning
✅ Defined risk with clear stop-loss
✅ Realistic profit target with strong R:R ratio
✅ Sector correlation awareness
✅ Flexible execution for different trading styles
The swing trade timeframe gives this setup room to breathe and develop, perfect for traders who don't want to be glued to charts all day! ⏰
⚡ The Bottom Line
This isn't financial advice—it's a strategic roadmap presented with personality! The "thief style" approach is all about:
🎯 Strategic positioning
🛡️ Risk management
💰 Profit-taking discipline
😎 Having fun while trading
Trade smart. Trade safe. Trade YOUR plan.
✨ If you find value in my analysis, a 👍 and 🚀 boost is much appreciated — it helps me share more setups with the community!
#OPEN #OpendoorTechnologies #SwingTrade #NASDAQ #StockMarket #TechnicalAnalysis #TradingStrategy #RealEstateTech #PropTech #BullishSetup #LayeredEntry #RiskManagement #TradingView #StockTrading #MarketAnalysis #TradingIdeas #SwingTrading #DayTrading

Nasdaq - The final blow-off top!⚰️Nasdaq ( TVC:NDQ ) can rally a final +25%:
🔎Analysis summary:
Just this month, we witnessed quite some volatility on the Nasdaq with a correction of about -10%. However, bulls immediately stepped in and clearly pushed price higher. Since there is still bullish pressure, a final blow-off top rally in the near future is quite likely.
📝Levels to watch:
$25,000 and $30,000
SwingTraderPhil
SwingTrading.Simplified. | Investing.Simplified. | #LONGTERMVISION

NAS100 Retest of POC: Bullish Break or Deeper Correction?I'm keeping a close eye on NASDAQ (NAS100) right now 📉📈. We’re seeing a deep pullback—a strong retracement that makes everyone ask the classic question:
Does this want to keep pushing lower and give us a bearish weekly candle, or is it gearing up to hold a level and rally back with the higher-timeframe trend?
For me, I’m a trend-continuation trader. Even if the weekly candle prints bearish, I’m not interested in selling into higher-timeframe strength. I’d rather stay patient and stick with the bigger trend direction 🧭.
Here’s the key level I’m watching:
If NAS100 can break back above the Volume Profile POC (Point of Control) — which is basically the high-value area acting as support right now — then I’ll be looking for long opportunities.
But if price breaks below the POC, that invalidates the idea and I’ll step aside. No need to force anything 👍.
Not financial advice ⚠️

NAS100 Trade Opportunity: Will Buyers Defend the Pullback?📊 NAS100 (NASDAQ-100) Swing Trade Opportunity 🚀
Bullish Pullback Setup | Super Trend ATR + TMA Confirmation
🎯 TRADE SETUP OVERVIEW
Instrument: NAS100 (NASDAQ-100 Index)
Timeframe: Swing Trade (4H-Daily)
Bias: BULLISH ✅
Setup Type: Super Trend ATR Line Pullback + Triangular Moving Average (TMA) Confirmation
🎬 ENTRY STRATEGY - "LAYERING METHOD" 📍
This strategy employs multiple limit order placement (Layer Entry Technique) to optimize entry points during the pullback phase.
Recommended Layer Entry Points:
🔵 Layer 1: 24,500
🔵 Layer 2: 24,600
🔵 Layer 3: 24,700
🔵 Layer 4: 24,800
⚡ Pro Tip: Scale layers based on your account size and risk tolerance. Each layer reduces average entry price.
🛑 STOP LOSS (SL)
Primary SL Level: 24,300
Strategy: Placed below the latest swing low + Super Trend confirmation
⚠️ DISCLAIMER: This SL is a guideline only. You must adjust based on your personal risk management strategy and account equity. Risk is YOUR responsibility.
🎁 PROFIT TARGETS (TP)
PRIMARY TARGET (TP1): 25,700 🎯
First resistance zone
Ideal for taking partial profits
Recommended exit: 30-50% position
SECONDARY TARGET (TP2): 26,200 🔥
Strong resistance + Historical overbought zone
⚠️ TRAP ALERT: Expect potential reversal or consolidation
Recommended exit: Remaining 50-70% position
Use trailing stop for final portion
📈 TECHNICAL CONFIRMATION
✅ Super Trend ATR: Aligned bullish
✅ TMA (Triangular MA): Pullback to key level confirmed
✅ Higher Lows Pattern: Intact
✅ Volume Analysis: Supporting move
🔗 RELATED PAIRS TO WATCH 💡
Positive Correlation (Move Together):
🔴 SPY (S&P 500 ETF) - $380-395 Range
Correlation: +0.92 | Often leads NAS100 lower-cap stocks
Key Point: If SPY breaks $390, expect NAS100 momentum confirmation
Watch for divergence signals
🔴 QQQ (Invesco QQQ Trust - Nasdaq 100 ETF) - $450-470 Range
Correlation: +0.99 | DIRECT tracking of NAS100
Key Point: Primary barometer for Nasdaq sentiment
Use for volume + volatility confirmation
🔴 TECH Sector ETF (XLK) - $205-215 Range
Correlation: +0.88 | Tech-heavy holdings overlap
Key Point: Tech rotation affects Nasdaq flow
Monitor for sector strength/weakness
Inverse Correlation (Move Opposite):
🔵 DXY (US Dollar Index) - $103-106 Range
Correlation: -0.65 | Stronger dollar = Risk-off mood
Key Point: If DXY spikes, expect NAS100 pullback extension
Monitor Fed rate expectations
🔵 TLT (20+ Year Treasury ETF) - $75-80 Range
Correlation: -0.58 | Rising yields hurt growth stocks
Key Point: Check 10Y yield trend for rate pressure
Watch Fed policy announcements
Key Monitoring Points:
📌 Earnings Season Impact: Tech earnings can create ±2% moves
📌 Fed Minutes/Announcements: Watch for rate guidance changes
📌 Market Breadth: Compare Advance/Decline lines for confirmation
📌 Volatility Index (VIX): Levels above 20 = Caution; Below 15 = Risk-on
📋 BEFORE YOU TRADE - CHECKLIST ✅
Is price currently at/near Layer 1 entry (24,500)?
Does current 4H chart show TMA pullback + Super Trend confluence?
Is volume confirming the setup?
Have you set your SL below 24,300?
Do you understand you're risking X to make Y?
Is this aligned with your trading plan?
🎓 FINAL NOTES
This is a mechanical swing trade setup designed for traders who use limit orders and layering technique. The confluence of Super Trend ATR + TMA creates higher probability entries during bullish pullbacks.
Remember: Trading involves substantial risk of loss. This idea is shared for educational analysis. Your trading decisions are YOUR responsibility alone.
Happy Trading! 🚀💎

SOFI Technologies — Strong 200SMA Support Sparks Swing Potential🚀 SOFI TECH STACK: The Fintech Heist - Layer Entry Swing Trade 📊💰
🎯 Executive Summary
Yo traders! 👋 Time to stack those profits like you're robbing Fort Knox! 💎 SoFi Technologies (NASDAQ: SOFI) is flashing a BULLISH CONFIRMATION signal pinned to the 200-day Simple Moving Average (SMA). This setup screams "BUY ME" for savvy swing traders! The fintech giant just crushed Q3 earnings with 36% YoY revenue growth and added 905,000 new members — that's 🔥 momentum, baby!
Current Price: $28.21 | 52-Week High: $32.57 | Market Cap: $34.02B ✅
📍 Technical Setup Breakdown
🎪 Bullish Thesis Confirmed (The Good News)
The 200-period SMA is acting like a SECURITY WALL 🛡️ supporting our bullish narrative. SOFI is respecting this key moving average on the daily chart, signaling institutional accumulation and strong bottom-forming behavior. With strong earnings tailwinds and expanding non-lending revenue (now 56% of total revenue!), this fintech is ready for liftoff! 🚀
💰 Entry Strategy: "Thief Layering" - Multiple Limit Orders 🎲
The "Thief Stacking" approach = Superior Risk Management! Instead of going all-in like a rookie, we deploy capital in tranches:
Recommended Layer Entry Zones:
🥇 Layer 1 (Buy Limit): $27.00 ← First wave of accumulation
🥈 Layer 2 (Buy Limit): $28.00 ← Secondary strength test
🥉 Layer 3 (Buy Limit): $29.00 ← Building momentum zone
💎 Layer 4 (Buy Limit): $30.00 ← Premium breakout entry (ATH proximity awareness!)
Strategy Win: This layering method scales your position while averaging down on dips — mathematically sound, emotionally smart! 📈 You can add/modify additional layers based on your risk tolerance and account size.
🛑 Stop Loss: The "Escape Route" 🏃♂️
Hard Stop Loss @ $25.00 ⚠️
This level represents ~11% downside risk from current levels and sits below major support structures. If SOFI breaks this zone with volume, the thesis is invalidated and we exit to fight another day. Remember: Protecting capital = Being alive to trade tomorrow! 💪
Disclaimer: This is YOUR trade setup. Risk management is personal — adjust your SL based on YOUR position size and account heat.
🎯 Profit Targets: "Police Barricade" Resistance Escape 🚨
Target: $37.00 📍
After crushing earnings, SOFI faces multiple headwinds at higher prices:
🚧 Overbought Confluence Zone: RSI approaching overbought territory + Fib resistance overhead
📊 Technical Resistance: Historical resistance cluster around $35-37 range
⚡ Momentum Trap Warning: Extended moves often reverse at psychological levels
Multi-Profit Take Strategy:
TP1 @ $32.50: Take 30% profits — Lock in the W! 🔐
TP2 @ $35.00: Take another 40% — Secure the bag! 💵
TP3 @ $37.00: Trail 30% with breakeven stop — Let winners run! 🎯
Pro Tip: Don't get greedy! The "Police Barricade" awaits those who overstay their welcome!
🌐 Correlated Pairs to Monitor (Market Context)
Keep your eyes on these relationships — they'll tell you if SOFI is moving on individual strength or sector momentum:
🔸 NASDAQ:UPST (Upstart Holdings) — 📈 Fintech peer correlate. Broader lending sector strength signals = SOFI momentum tailwind!
🔸 NASDAQ:COIN (Coinbase) — 🏦 Digital finance ecosystem player. Tech-forward consumer adoption trends directly impact fintech adoption rates.
🔸 SET:SQ (Block Inc) — 💳 Payments ecosystem leader. Fintech ecosystem health barometer — if SQ is strong, SOFI rides the wave!
🔸 NASDAQ:QQQ (Nasdaq-100) — 🔗 Tech sector correlate. Market risk appetite indicator — if QQQ tanks, watch for tech sector contagion signals!
🔸 NASDAQ:TLT (20+ Treasury ETF) — 🔀 Inverse relationship alert. If rates rise (TLT falls), fintech lending margins expand = bullish for SOFI profits! 📈 If rates fall hard, margin compression = caution flag! 🚨
Key Correlation Insight: Monitor these pairs in real-time during SOFI entry execution — they'll tell you if this is individual strength or sector-wide momentum! 🎯
📋 Trading Rules (Thief Code of Conduct) 🎭
✅ Entry ONLY when price touches your pre-set buy limit zones
✅ Size DOWN if fundamentals deteriorate (earnings miss, regulatory headwinds)
✅ Move stops to breakeven once TP1 is hit — Never give back free money!
✅ Take profits AT resistance — Fighting the market = broke traders
✅ Walk away if SOFI closes below $25.00 — Live to trade another day!
🔥 Why This Setup SLAPS Right Now 📱
✨ Q3 Earnings Crush: 36% revenue growth + profitability milestone achieved
🏦 Fintech Secular Trend: Younger generations ditching traditional banks for digital solutions
📈 Non-Lending Growth: 57% YoY expansion in SoFi Money, Invest, and Credit Card products
💰 Analyst Optimism: 6 of 11 analysts recommend BUY | Target range: $12-$38
🎯 Technical + Fundamental Alignment: The chart AND the fundamentals say "BUY ME"
✨ Gratitude Note
✨ If you find value in my analysis, a 👍 and 🚀 boost is much appreciated — it helps me share more setups with the community!
#SOFI #SoFiTechnologies #SwingTrade #Fintech #TradingSetup #NASDAQ #BullishSetup #TechnicalAnalysis #Daytrader #TradingIdeas #StockMarket #Crypto #FinanceGains #TradingCommunity #Bullish #EntryStrategy #RiskManagement #TP1 #SL #TradingWithBias

Will NAS100 Sustain Its Bullish Momentum After the Pullback?NAS100 🚀 Bullish Swing Setup | SuperTrend Pullback & Layered Entry Strategy
🎯 TRADE IDEA: NAS100 (US100) BULLISH SWING
Capitalize on a structured pullback in the NASDAQ 100! This plan leverages a proven indicator confluence for a high-probability long opportunity.
📊 ANALYSIS & CONFIRMATION:
Trend: Primary Bullish Trend is intact. ✅
Trigger: Price is pulling back into a demand zone, offering a favorable risk-to-reward entry.
Indicator: The SuperTrend ATR Line is acting as dynamic support on the 4H/Daily timeframe. A bounce from this level confirms our bullish bias.
⚡ STRATEGY: "THE THIEF" LAYERED ENTRY
This method uses multiple limit orders to average into a position, perfect for volatile markets like the NASDAQ.
Entry Zone: Look for entries between 25,200 - 25,600
Layer Example:
🟢 Limit Order 1: 25,600
🟢 Limit Order 2: 25,400
🟢 Limit Order 3: 25,200
👉 You can adjust the number of layers and prices based on your capital and risk appetite.
❗ RISK MANAGEMENT:
Stop Loss (SL): A decisive break below 24,800 would invalidate the bullish structure.
⚠️ IMPORTANT NOTE: This is MY protective stop. Dear Thief OG's 👑, you MUST adjust your position size and SL based on your personal risk management strategy. Protect your capital first!
🎯 PROFIT TARGETS:
Primary Target: 25,600 (Initial resistance & profit-taking zone).
Key Reasoning: We anticipate a reaction here due to:
Moving Average resistance.
Potential overbought conditions on lower timeframes.
A "trap" for late buyers.
👉 Smart Move: Consider taking partial profits at 25,600 and trailing your stop for the remainder. Escape the trap with your profits! 💰
⚠️ REMINDER: Dear Thief OG's 👑, your Take Profit (TP) is your own decision. Secure gains based on your trading plan and market behavior.
🔍 RELATED ASSETS & MARKET CORRELATION:
Watching these related instruments can provide confirmation and a broader market view.
TVC:DXY (U.S. Dollar Index): 🟡 NEGATIVE CORRELATION
A weakening Dollar ( TVC:DXY DOWN) is generally bullish for Nasdaq. If the Dollar is falling, it adds confidence to this long thesis.
USTECH (CFD on Nasdaq 100): 🟢 DIRECT CORRELATION
Moves in sync with NAS100. Perfect for cross-verifying price action and volume.
NASDAQ:AAPL , NASDAQ:MSFT , NASDAQ:TSLA (Mega-Caps): 🟢 HIGH IMPACT
These heavily weighted Nasdaq components drive the index. Bullish momentum in these stocks supports a rising NAS100.
FOREXCOM:SPX500 (S&P 500): 🟢 POSITIVE CORRELATION
A strong S&P 500 often lifts the Nasdaq. Monitor for overall U.S. market strength.
💬 Let me know your thoughts in the comments!
What's your entry strategy for the NAS100 this week?
#NAS100 #US100 #TradingView #SwingTrading #Bullish #SuperTrend #TradingStrategy #IndexTrading #LayeredEntry #ThiefStrategy

NASDAQ NAS100 Analysis and My Trade Plan📊 Currently analysing NAS100 (NASDAQ), we can see that price has broken structure to the upside, confirming bullish intent. Right now, NAS100 is retesting the value area and the Point of Control (POC) on the volume profile — a critical zone to watch 👀📈
⚠️ Price action is a bit precarious. After a strong impulsive move, we’ve now seen a deep and aggressive retracement, which opens the door for potential bearish movement this week.
📆 However, my higher-timeframe bias remains bullish, with the weekly chart still supporting upward continuation.
📌 My plan:
If price holds above the current POC, then breaks and retests cleanly, I’ll be looking for long opportunities. If it breaks below the POC, I will step aside and abandon the long bias 🚫
This is not financial advice — just my personal market outlook. 💬📉📈

Nasdaq NAS100 Analysis: The Conditions I Need Before Going ShortI'm keeping a close eye on NAS100 (Nasdaq) right now. 📉✨ On the 4H timeframe, price remains in a clean, sustained bearish trend, and I'm anticipating a potential continuation lower.
If price rejects the current level and fails to retrace through the 1H imbalance, and we see a rotation followed by a bearish break of structure, I'll be preparing for a short opportunity. 📊🔻
Not financial advice.

US100NASDAQ ( US - 100 )
- Completed " 12345 " Impulsive Waves
- Break of Structure
- Demand Zone
- RSI - Divergence
- Order Block

NAS100 Bullish Structure Break with Key Fibonacci Level in PlayThe NAS100 is now showing clear signs of strength, with a solid bullish move and a confirmed break of structure on the 4-hour timeframe 🚀. With this shift, the focus turns to how price behaves on the pullback.
The main level of interest is the 61.8% Fibonacci retracement of the current swing. A buy setup becomes valid only if price retraces and holds above the 61.8 level 🔥. Holding above this zone would indicate a shallow pullback — a strong sign that buyers are stepping in aggressively and maintaining control.
If price respects the 61.8 and then breaks structure to the upside again, that’s the confirmation needed to look for long opportunities 📊.
However, if price breaks below the 61.8 level, the idea is invalidated and should be abandoned. A deeper retracement may signal weakness, although it could also be a smart-money liquidity run before a continuation — either way, the priority is to see momentum hold above 61.8 to keep the bullish narrative intact ⚠️.
Not financial advice.
