NDX Nasdaq double bottom ?NDX Nasdaq100 is looking bearish for now.
I think we might see a double bottom before closing higher this year.
Looking forward to read your opinion about it.
Ndxshort

NAS SHORT HIGHER TIMEFRAMENot to be an alarmist or anything. But the nasdaq is looking weak in the knees right now. We needed to break that high to switch bullish. The market rejected it pretty harshly. You couldn't pay me to long NAS until we get a new high or SIGNIFICANT retracements to discount prices succeeded by 1hr shifts in orderflow and bullish structure.

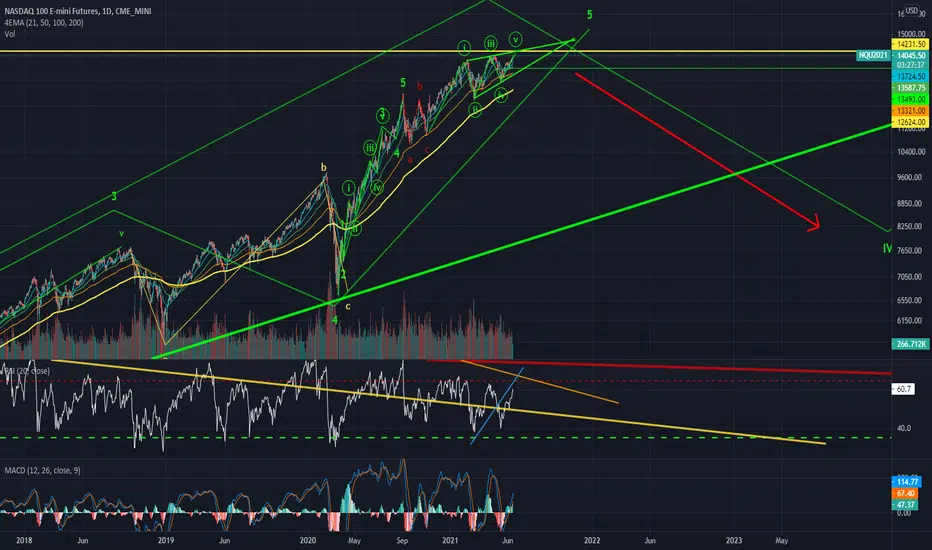
NDX W-Shaped RecoveryI think we might see the end of the war soon.
Russia says the first phase of its “military operation” in Ukraine is mostly complete.
I am considering a W-Shaped Recovery on NDX and a price target of $15670.
Looking forward to read your opinion about it.

Nasdaq100- New leg down?In my previous Nas100 analysis I said that I work with 3 bearish scenarios in Nasdaq's case, and the last scenario proved to be the correct one so far, with the index reversing from 15k zone resistance.
At this moment, the index is trading just above 14.400-14.500 zone support and I expect continuation to the downside.
In my opinion rallies around 15k should be sold and only the index above 15.500 would put a pause in this bearish scenario.
Bears can target 12.500, keeping in mind the last low as support also.
Best regards!
Mihai Iacob

Nasdaq Super Short 50% Crash IncomingLooking for a Super Short on the NASDAQ with entry set out in this chart. Buy the fear, sell the greed.... Which side are you on?

NASDAQRecounted NDQ and find it hard to imagine we fo not at least test the weekly ema 100, with the fact that yeilds are still heading to 2.1% USD is heading to $98-$99 & TA patterns show a failed bottom ST TL.. So probably we have a bearish Feb to start and bottom around 13,000

Nasdaq - Short - M FormationNASDAQ: BEARISH OUTLOOK
There is a confirmed Double Top (M Formation) showing further downside to come to around 14,483. I am worried with American indices at the moment. Omicron, talks of inflationary measures and increase Interest Rates is causing quite a bit of downside.

NDXNasdaq looks like it still has the ABC down happening, the SP500 looks like it want's to push higher, while the nasadq looks like a H&S pattern can play out dropping tech stocks to 14,000 to finish wave C. I really don't like the mixed indices. When DJIA was pointing down for wave 4 but SP500 & NASDAQ were pointing up the truth was revealed that the dow jones w4 bears had the power to correct all markets. So we need to watch closely. The Evergrand news seems to be priced in though, so let's see if the bulls can NUKE the head & shoulders pattern and break out above ATH. I would add the a big crash to 14k would likely be the gas needed to pump NDX over ATH(just a thought)

NASDAQ Futures Trend Analysis - EWBreaking down the Ichimoku cloud & Elliott Waves for the current PA.
Seeing confluent support in this region, though R/R is better on the put (short) side.


NDXWe hit my IH&S pattern but could not break up from the rising wedge. Instead we have broken down, I think we are heading to that weekly 50 ema at 13,500

$TSLA pullback incomingBouncing off spider ray and RSI70 , due for a pullback. ZOom in and head and shulders forming under the TL for a reversal.

NDX (Nasdaq) one of the possible moves. Possibility of dotcom2.0Hey, this is one of the possible moves in of $NDX, the index is overbought and it needs to cool off, maybe we see a market crash (or just a big correction) in February 2022.
Not financial advice. Do your own research.
P.S I will be glad if this is not gonna happen. If this happens many people will lose their savings.
P.P.S If we see market crash it will not be as 'light' as 2008 but more like as it was in 2000 (dot com crash) or even as hard as the Great Crash (1929 aka the Great Depression).

$NDX looking due for a moderate correctionNasdaq top 100 looks setup for a downside move within the month. Targeting an approximate 50% retracement seems reasonable. Significant bearish RSI divergence on 1d candles supports this move. Notice divergence and subsequent downside moves marked 2 previous times.

Ending DiagonalTracking this formation as an ending diagonal.
This might be THE ending diagonal.
The ending point can be a higher high or lower one.
Many times you'll see a bump up above the top of the diagonal before it crashes back through.
*Note: This is the exact same formation Bitcoin had a few months ago before it crashed 50%. The relation is palpable.
I see Bitcoin as the honest player in the game as far as price action and patterns go. Look at the two charts.
Diagonal remains valid unless be break above 15,000.
June High, July Low. Nasdaq to drop to close huge imbalances within the market on lower time frames.

Bearish Count confirmedDiamond forming now on the 5 min chart in wave iii-iv
Now that we know that yellow zone has been held as resistance, we should expect a continuation down. Not sure if crypto is leading or the nasdaq, but if you look at them they're very correlated now.
I was sweating a bit yesterday but that sharp selloff this morning confirmed that we have topped in the nasdaq.

Give me BLOOD!!Bearish count is intact and favored.
Bullish count is only possible IMO if we can rise above 13,800 again.
Otherwise, looks like we might get a steep drop soon.

Bulls MIALooks at how many times we've flipped at that yellow zone.
Past price action tells us a reaction is likely there.
Looks like we're hitting a wall.
If we can break through this zone, we'll push to new highs.
BUT,
The upward price action looks corrective to me.
C wave extended 1.382 of the A wave.
Bearish Bias remains.
Buying the SQQQ. Stop loss if the NDX breaks above 13,850 or so.

Hit ResistanceWe're right in my 2nd target zone for this rally.
Looks like the price action has gotten stopped in that zone.
I see this as a opportunity to short.
I would set my stop at 13,800.
Watch Crypto. See if it follows tech downward.
Or maybe they'll just PAMP it up again. Who knows with all this free money.

The End Seems NearDivergence on the RSI 4 times! Usually after 3 there's no going back but sometimes with things like Bitcoin or apparently the Nasdaq, you can have more because of the FOMO.
We hit the 2.5-2.618 fib extension from the prior wave I cycle as shown.
I'm thinking we enter a complex wave 4 of larger cycle degree soon.
It's gonna be nasty and a lot of tech companies are gonna go bust.
But the bad money needs to be cleansed and the free market needs to decide who is allowed to stay in the game.
I'm looking for a 40-60% pullback. We will enter a bear market for the next year or two if this happens. I think we're nearly there.
I need a further breakdown of the RSI to confirm it, but if we keep selling off this week and it accelerates, remember this chart.

Precision EngineeringSee that? Look at this with BTC overlaid.
The whole market is going down.
Freaking nailed it.
Added to my short position.
