XMRUSDT is testing a neckline 🦐XMRUSDT is testing a neckline of head and shoulder created on monthly resistance.
the price bounce on weekly trendline and on 0.5 fibonacci Level.
IF The price will break the neckline we can see a new impulse, otherwise the price could retest the weekly trendline.
According to Plancton's strategy, we can set a nice order
–––––
Follow the Shrimp 🦐
Keep in mind.
🟣 Purple structure -> Monthly structure.
🔴 Red structure -> Weekly structure.
🔵 Blue structure -> Daily structure.
🟡 Yellow structure -> 4h structure.
Here is the Plancton0618 technical analysis, please comment below if you have any question.
The ENTRY in the market will be taken only if the condition of Plancton0618 strategy will trigger.
Necklinebreak

FCPO TRADING: 143) A POSSIBLE DEEP BULLISH GARTLEY PATTERNhi, this is haidojo trading and the number is 143...consolidation breeds advanced patterns...likewise, now we might face a possible deep bullish gartley pattern...it is compatible with the formation of the "neckline" in my previous analyst...don't aim high on this one...even if it works, it will just rise back mildly...not that kind you wanto hold for swing trade...nor mid-term period...
for the bullish gartley pattern, buying range frm 2650-2560...Stop-loss below that range...tp 2685...no extended target...
higher resistance : 2750
immediate resistance : 2710
lower support : 2560-2605 the possible neckline for "head-and-shoulder"
WARNING!
RISK DISCLAIMER : this is juz a trading idea...trading stocks, futures or forex might incur a huge risk to your account/funds… DON’T LOSE MONEY THAT YOU CANNOT AFFORD …any idea(s) of trading in this episode SHALL NOT be regarded as a hint of BUYING or SELLING. It is MERELY a trading journal and it has been used for educational purpose only… trade at your own risk!
**your "LIKE" and "FOLLOW" are my main source of motivation to continue posting more valuable contents...TQ**


BYND- Danger zoneShort it at the supply zone (132 to 140) and close the position at the target lvl coincides with SMA 200!

SGR - Head and Shoulders set upstandard head and shoulders short set up with a break of the neckline, should be some strong support down at 2.20 so a good short term target is 2.25
MACD sell signal also on the daily being signaled.

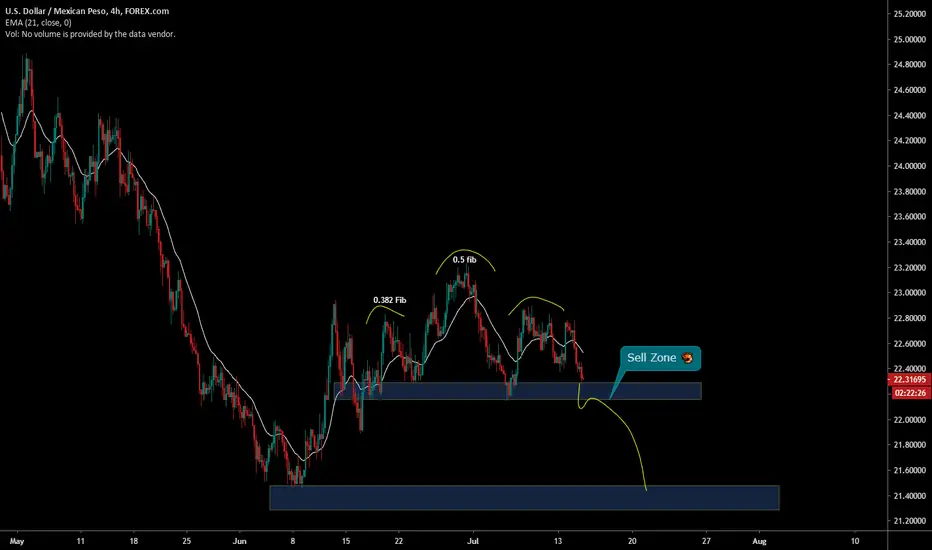
USDMXN on head and shoulder 🦐The market created and head and shoulder pattern between wthe 0.382 and the 0.5 level of the fib retracement.
If the market will break below the neckline we can set a nice short order according with our strategy.
–––––
Follow the Shrimp 🦐
Here is the Plancton0618 technical analysis, please comment below if you have any question.
The ENTRY in the market will be taken only if the condition of Plancton0618 strategy will trigger.
Nice inverse SHS- Formation. Could be a very nice trade!Beautiful SHS-Formation with a clean Neckline. I have 2 targets ...

Double Bottoms on NKNBTC chartA Double Bottom pattern going to form on NKNBTC chart. As it shown on the chart, bottoms are around 297 sats and neckline is around 309 sat. if neckline breaks then price can go up to 315 and 320+ .

EURUSD - SHORT -- NECKLINE BREAK PENDINGHEAD AND SHOULDER PATTERN FORMED ON 4HR...WAITING FOR PRICE TO BREAK NECKLINE BEFORE OPENING A SHORT POSITION. WE ARE EXPECTING PRICE TO MAKE AN EQUIVALENT DROP IN COMPARISON TO THE HEAD TO NECKLINE LENGTH. IT SHOULD ALSO BE NOTED THAT PRICE IS AT A KEY RESISTANCE LEVEL ON MULTIPLE TIMEFRAMES.

GBPCAD > Long Trade Idea!!Hey friends👋 Support this idea with like if it's helpful to you, leave me a comment below that will help me a lot 🙏.
Analysis of #GBPNZD
now we have broken the neckline and have not yet reached the structure level I predict a continuation higher to 1.72200 area.
i will look to get involved with members inside the signal service in a long trade if provided us a chance to
⚠ Please note the ideas is valid only if it happened as I said above
Thanks for taking the time to read my idea please do not forget to hit the like it's my only reward🙌
Check today analysis below
Stay safe everyone
_____________________________________________________________________________
Before trading our ideas make your own analysis.
_____________________________________________________________________________
Disclaimer: this information is not a recommendation to buy or sell. It is to be used for educational purposes only

USD/CAD SELL SIGNAL Hey tradomaniacs,
welcome to another free trade-plan.
Important: This is meant to be a preparation for you. As always we will have to wait for a confirmation.
Market-Sell-Order: 1,40255
Stop-Loss: 1,40775
Target 1: 1,39600
Target 2: 1,39250
Target 3: 1,38660
Stop-Loss: 52 pips
Risk: 1-2%
Risk-Reward: 3,06
LEAVE A LIKE AND A COMMENT - I appreciate every support! =)
Peace and good trades
Irasor
Wanna see more? Don`t forget to follow me.
Don`t forget to follow me.

ABG Shipyard Limited Classic Rounding Top Formation
Classic Rounding Top Formation on since 2009 - 2016
Neckline Price Breakout
Continious downtrend since then.

DXY - Inverse Head & Shoulder EntryDXY (4h) has broken the neckline on a Inverse Head & Shoulder.
Entry confirmation (although a late entry) will still warrant a 108 PIP move.
"Price is a graph of human behavior over time. If u want to appear in a place most humans are not u must have behaviours that are not common within that system." Kaz
Team Fractal from the Kazonomics ecosystem signing off.

{SWC}——TGUAN, Double Top or Potential Breakout?Thank you for your continued support :)
Strategy: Bollinger Band Breakout
Bias: Bullish. TGUAN traded actively with average volume after the correction phase done at support 3.30 back in early December.
TGUAN challenged RM3.65 earlier. The profit taking activity brought TGUAN back to retest support at 3.30.
TGUAN recently challenged again recent high resistance. It closed at 3.66 above Bollinger Upper Band.
If TGUAN successfully made a neckline breakout, SWC believes it can achieve 4.00 based on the accumulation. Time needed.
3.88 will be another crucial resistance zone which to take note for.
S: 3.58, 3.50
R: 3.88, 4.00
If you find this idea helpful, dont hesitate to drop us a like and welcome to comment below! :)

EUR/JPY: Day-Swingtrade-OpportunityHey tradomaniacs,
welcome to another free signal!
Important: Wait for the retracement back to neckline-area and previous trendline before you sell.
-----------------------------
Type: Day-Swingtrade
Market Sell: 121,260
Stop-Loss: 121,790
Target 1: 120,650
Target 2: 120,310
Target 3: 120,000
Stop-Loss: 53.0 pips
Risk: 1-2%
Risk-Reward: 2,33
-----------------------------
LEAVE A LIKE AND A COMMENT - I appreciate every support! =)
Peace and good trades
Irasor
Wanna see more? Don`t forget to follow me.
Any questions? PM me. :-)

S&P500 Index - Head and Shoulder formed- After today's drop to the neckline, a Head and Shoulder formation had formed.
- Short term trend is reversed as the index is unable to achieve a Higher High and broke down below the uptrend.
- If the index break down below the neckline, we should see the index heading towards 2900 (measurement based on the H's height)
- Be prepared to short it but wait for confirmation before entering a short position.

USDJPY Small double Bottom Retest!!!Despite negative US data, USDJPY formed retest on broken double bottom neckline, I have placed a possible long term trade to the upside.

AUDCHF SHORT SIGNALThe AUDUSDs present a short signal offering about 85pips opportunity. The appearance of a double top and the market ranging at the neckline, leave us with an option to wait for a neckline breakout and a possible retest to short the market to the 0.67590 area

AUDCHF breaking neckline of H&SWait for confirmation retest of neckline then look to long this for about 80ish pips!!!

TSLA Short to 180Ahoy there mateys! Let's dive right in.
TSLA fundamentals are arguably weak, the EV market is becoming more and more competitive. We're seeing strong entry into this market from the likes of Volvo, BMW and now even Porsche has a nice EV coming. We can also see demand softening for TSLA clearly evidenced by recent price drops on the vehicles. In a period of rising demand, you do not lower prices, therefore you can infer we are seeing weaker demand for TSLA's offerings. TSLA stock has long had a price in moat on the EV market which is arguably being eroded as others develop their technology.
TSLA also has some potential liabilities related to Elon's loud mouth and defiant attitude towards the SEC and that really doesn't have much in terms of upside, but plenty of downside. Another speculative component of this short, the really high turnover in TSLA's financial and accounting departments. Especially after a quarter of posting record revenue and EPS. You have to wonder if there are some greater accounting issues at play when you see senior accounting staff quickly departing the company.
Now, we can tear apart TSLA fundamentals all day. Looking at this from a technical and pattern oriented perspective we have a great short opportunity lining up. An arguably overvalued business with success priced in, facing a lot of uncertainty, is a prime short.
We can see head and shoulders pattern forming on the weekly chart. The neckline has now broken and we are seeing the price fall below the 200 MA line (consistent with the neckline of the head and shoulders pattern). We can also see the 50 MA crossing the 100. I think we will see a reversal of the long-term uptrend, signaled by this neckline break, and TSLA should fall sub 200 as it searches for its next support level. A fib 78% retracement puts us at the 180 price level.
To be fair, I've been trading this short since 280 -- now with the neckline break and this fall under the 200 MA I have increased confidence in this short and am entering a larger position. I'm expecting this to be trading sub 200 by the end of June 2019. I will be keeping an eye out for any price bounces to increase my short position.
This is not investment advice, just my own thoughts and analysis. Trade at your own risk.
Thanks for reading!

gbpaud H1 SELL sell already activated however price is still near entry for those who wish to enter now:
1- head and shoulders pattern
2- break of neckline
3- break of trend line

AUDNZD H1 SETUPreasons to take the trade sell : ( waiting for a better momentum candle to confirm the break )
1- double top forming
2- break of the the double top neckline
3- bearish hidden divergence on rsi

XAU/USD: H&S breakout - Huge Potential WaitingDaily Chart:
On Daily, Gold has beautifully breakout the neckline of Head and Shoulder pattern.
Waiting some retest, or maybe just little reverse , then Sell gold for huge profit
SL is when Daily candle bar close above the neckline.
