USDMXNThis Weekly FORECAST
Opportunity for USDMXN. This setup trading idea is for intraday. >> TAYOR
Risk Factors:
1. Market conditions, unexpected news, or external events could impact the trade.
2. Always use risk management strategies to protect your capital.

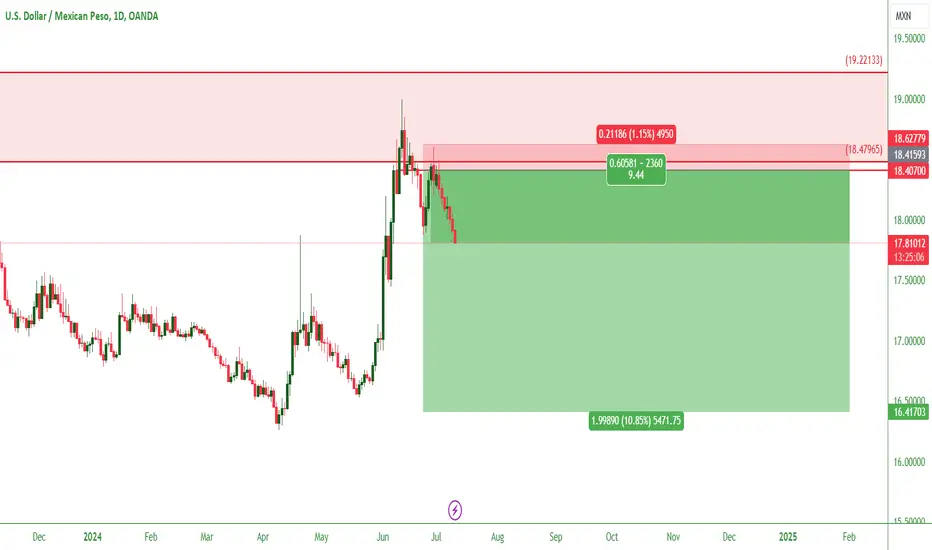
USDMXN SWING TRADEHow can i say no to this perfect analysis !
look at the beautiful chart
oh my godness ~
lets gooooo !!!!!

USDMXN Short Analysis - Trade Update Last week, the price of USDMXN rejected the significant psychological level of 19.00. From the COT index, we observed that the pair had been muted for an extended period. However, I saw value in buying MXN leading into July. 🌞
🚨 Trade Update:
The trade is currently running 597 pips in profit! 🎉
St
USD/MXN: Bullish Momentum Expected Amid Demand Area RetestThe USD/MXN currency pair is showing promising signs of a bullish continuation as it retests a recognized demand area. This zone has historically provided strong support and is now positioned to potentially fuel a further upward movement. Large speculators are currently on the bullish side, while re

USDMXN - Looking Bullish USDMXN has broken the major downtrend line with some strength and appears to be making a corrective move at the moment. (possible retest)
Now we have to wait how it will react at the Fibonaci levels that converge with the retest of the bearish trendline and with our daily SMMA (Red line), if there

USDMXN breaking higherIntraday Update: The USDMXN has broken channel resistance and the 38% retracement at 8.1359, which should put the 18.47xx level back in play in the day(s) ahead.

USD/MXN Bullish?We are expecting a pullback to the supply zone that is we are targeting which is 18.08 . The dollar is gaining strength and we don't know wether this is a short term gain or a long term gain but fundamentals will tell us more

Analysis of USD/MXN Monthly ChartAnalyzing the USD/MXN monthly chart, it looks like we're witnessing some interesting developments. The pair has been in a descending channel since early 2020, but it recently broke above the descending trendline. This could signal a shift in momentum.
Key levels to watch:
Support around 16.50 has

USDMXN finds support The USDMXN is finding some support at the 50% retracement of the April 2024 lows to June 2024 highs at 17.6200. This is also where the 50dma resides as well. In order to complete an AB=CD move we thought the risk may be back towards 17.4800, however a move back above previous support at 17.8700 whic

USDMXN nearing previous support Intraday Update: The USDMXN has pivoted off the 50% retracement at 17.63 and is nearing the previous support at 17.88 which should find sellers intraday.

See all ideas
Trade directly on the supercharts through our supported, fully-verified and user-reviewed brokers.


Frequently Asked Questions
The current rate of USDMXN is 18.44395 MXN — it has decreased by 0.03% in the past 24 hours. See more of USDMXN rate dynamics on the detailed chart.
The value of the USDMXN pair is quoted as 1 USD per x MXN. For example, if the pair is trading at 1.50, it means it takes 1.5 MXN to buy 1 USD.
The term volatility describes the risk related to the changes in an asset's value. USDMXN has the volatility rating of 1.11%. Track all currencies' changes with our live forex heatmap and prepare for markets volatility.
The USDMXN showed a 2.69% rise over the past week, the month change is a 0.64% rise, and over the last year it has increased by 9.36%. Track live rate changes on the USDMXN chart.
Learn how you can make money on rate changes in numerous trading ideas created by our community.
Learn how you can make money on rate changes in numerous trading ideas created by our community.
Currencies are usually traded through forex brokers — choose the one that suits your needs and go ahead. You can trade USDMXN right from TradingView charts — just log in to you broker account. Check out the list of our integrated brokers and find the best one for your needs and strategy.
When deciding to buy or sell currency one should keep in mind many factors including current geopolitical situation, interest rates, and other. But before plunging into a deep research, you can start with USDMXN technical analysis. The technical rating for the pair is buy today, but don't forget that markets can be very unstable, so don't stop here. According to our 1 week rating the USDMXN shows the buy signal, and 1 month rating is buy. See more of USDMXN technicals for a more comprehensive analysis.