NEO long term rising wedgeNeo has formed a rising wedge, this is a bearish continuation pattern unfortunately.. However this may lead to an inverse H&S, eventually. Short term profits can be made while price is within the wedge, but overall long term the chart pattern is bearish, however the longer term outlook is pretty bullish if you are a dedicated hodler. Short term a rejection may occur at 50MA.
NEOBTC

NEOBTC H&S + VOL for quick short Look at that beautiful H&S , VOL/SQZ & RSI. What a sight to see for all you lower EMA Forex traders out there.
I ’ll keep this one short and try to publish later some sort of update but with the classic trendline pattern we are seeing now is in direct correlation with the fundamentals of a classic H&S TO neckline so that would make 1368s the ideal TP 1 with 1379 the pivot / support.
Read carefully everyone and treat everyone as you would like to be treated.
It’s already cold outside and with the cold world no need to be just as cold. Fucking reptiles over in the city make me miss Miami/LA (I’m from here for FFS)
As always Stop limit is the number one priority
— The past hour long we got phenomenal news about South Korea just as we did about France yesterday looks like they’re both acknowledging crypto as currency so I said it first I think back in 2015 (Re-tweeted recently) that 2020 would be the year of integration :)
Disclaimer
Note : T his is strictly conjecture based on my own technical analysis and not any information based on any sources from the GOP Or federal government/treasury dept / ay institution of any form this example is for educational purposes only and should not be relied upon for any other use. Please invest responsibly and make all decisions based on your head; not your gut. Any projections or figures provided in this analysis are Forward-looking statements And have no basis Other than my own opinion and not information related to the GOP, SEC or wall sf in general. Just the wiz doing what he always did best — Disclaimer must be extended and extensive So forgive me as I need to truly emphasize None of the information obtained in conducting this analysis was provided by insider trading in anyway shape or form.
Certain information set forth in this presentation contains “forward-looking information”, including “future oriented financial information” and “financial outlook”, under applicable securities laws (collectively referred to herein as forward-looking statements). Except for statements of historical fact, information contained herein constitutes forward-looking statements and includes, but is not limited to, the (i) projected financial performance of the Company; (ii) completion of, and the use of proceeds from, the sale of the shares being offered hereunder; ( iii ) the expected development of the Company’s business, projects and joint ventures; (iv) execution of the Company’s vision and growth strategy, including with respect to future M&A activity and global growth; (v) sources and availability of third-party financing for the Company’s projects; ( vi ) completion of the Company’s projects that are currently underway, in development or otherwise under consideration; ( vi ) renewal of the Company’s current customer, supplier and other material agreements; and ( vii ) future liquidity, working capital, and capital requirements. Forward-looking statements are provided to allow potential investors the opportunity to understand management’s beliefs and opinions in respect of the future so that they may use such beliefs and opinions as one factor in evaluating an investment.
These statements are not guarantees of future performance and undue reliance should not be placed on them. Such forward-looking statements necessarily involve known and unknown risks and uncertainties, which may cause actual performance and financial results in future periods to differ materially from any projections of future performance or result expressed or implied by such forward-looking statements.
Although forward-looking statements contained in this presentation are based upon what management of the Company believes are reasonable assumptions, there can be no assurance that forward-looking statements will prove to be accurate, as actual results and future events could differ materially from those anticipated in such statements. The Company undertakes no obligation to update forward-looking statements if circumstances or management’s estimates or opinions should change except as required by applicable securities laws. The reader is cautioned not to place undue reliance on forward-looking statements.
Enjoy your weekend. <3 TGIF all!
-m.T

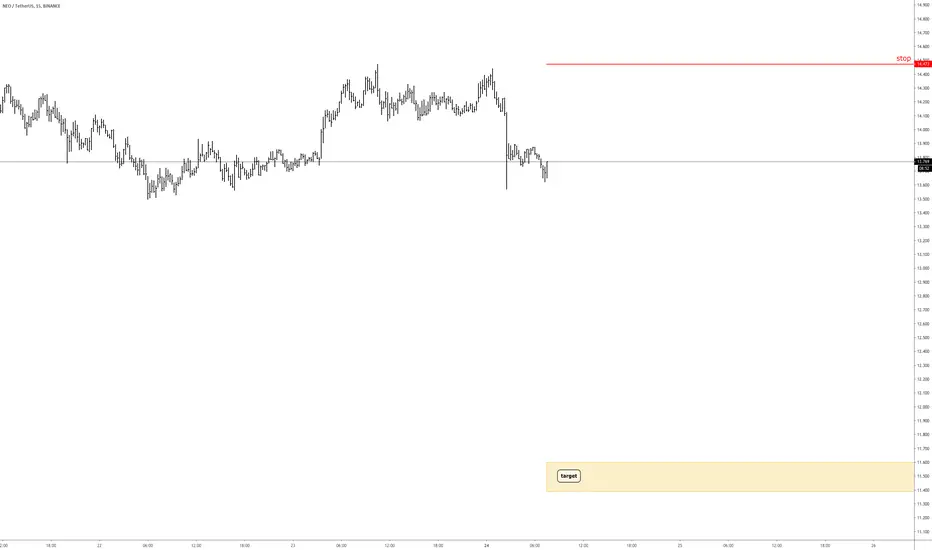
NEOUSDT: Buying a pullbackLonged Chinese Ethereum targeting resistance ~ $13
If you take a look on the chart you'll see that NEOUSDT is very often has a buyback on a daily from the current zone ($10.5 - $11).
Information is just for educational purposes, never financial advice. Always do your own research.

NEO Break up or down? Ascending triangle|Structural Resistance Evening traders,
Today’s technical analysis will be on NEOBTC which is testing its critical structural resistance that needs to break for a bullish bias
Points to consider,
- Structural resistance in confluence with .382 Fibonacci
- Respecting ascending support line
- RSI testing its resistance
- Stochastics in lower high projections
- Volume clearly declining
NEO is testing an important level where a break will negate key technical indicators and change the overall maker structure.
The Ascending support line that is being respected puts emphasis on a probable ascending triangle as NEO puts on consecutive higher lows.
The RSI is near its apex where it must break its resistance for a bullish bias. Stochastics is currently neutral with stored momentum in both directions, it is however trading in a lower high projection.
The volume is clearly declining signalling that an impulse move is imminent, which is true as NEO is in a trade location.
Over all, in my opinion, NEOBTC is probable to break structural resistance, it needs to close above with a retest to confirm an S/R flip.
What are your thoughts?
Please leave a like and comment
And remember,
“Confidence is not "I will profit on this trade." Confidence is "I will be fine if I don't profit from this trade.”
― Yvan Byeajee

NEO Symmetrical Triangles?A symmetrical triangle has formed between trendlines on the NEOUSD pair. This is a bullish symmetrical triangle as the first impulse wave was bullish which upon breakout of the triangle will lead to a second wave. A few H&S patterns can also be identified but I haven't listed these as their impact on daily charts is minimal.

NEO/BTC 8H (Binance) Big fat ascending triangle in formationNEO is at triangle support and seems like it's done with correction from last high.
Let's long this retracement, targets are in safe zone for short/mid term, but long term looks good also and can grow way higher.
In fact, in case the patter would be broken, hold some for big ROE!
Entry= 0.001264 - 0.001238
Take Profit= 0.001375 | 0.001473 - 0.001542
Stop Loss= 0.001127
Risk/Reward Ratio= 1:1 | 1:1.79 | 1:2.35
Expected Profit= 9.91% | 17.75% | 23.26%
Possible Loss= -9.91%
Fib. Retracement= 0.382 | 0.618 | 0.786
Margin Leverage= 1x | 3x | 5x

Daily Chart on NEOUSDTDaily Chart setup on NEO, Watching for a bounce off the 200 day SMA
Lets see if this can ever get back up to $100USD


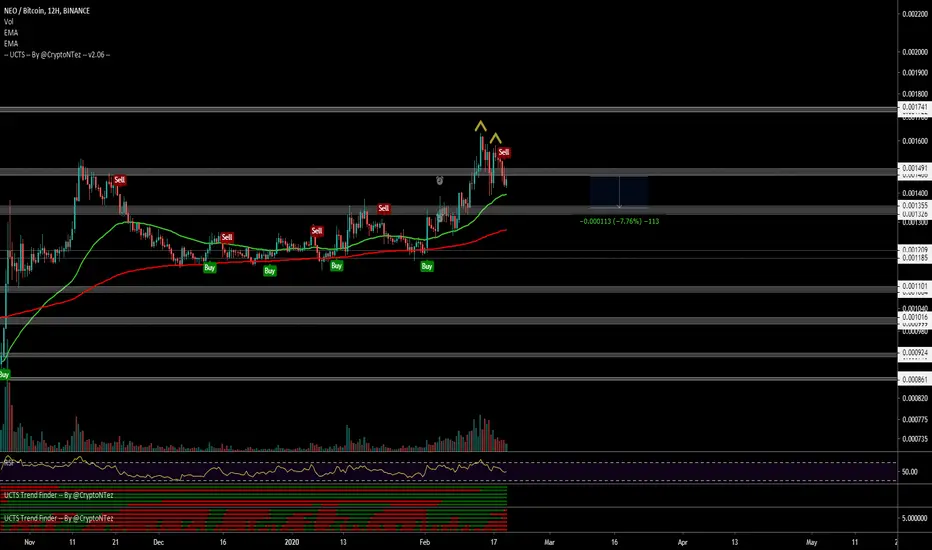
$NEO, Not able to hodl ~1500 sats making a LH$NEO
Not able to hodl ~1500 sats for the second time making a LH & now falling below it.
Rejection from here could be interpreted as S/R flip and entry for a short position w/ 1st target at ~1350 sats..
UCTS Sell signals on the 12H and lower TFs
#NEO
Neo (NEOUSDT) short.All description on the chart.
Please, don't forget to like and follow.
Thank you.

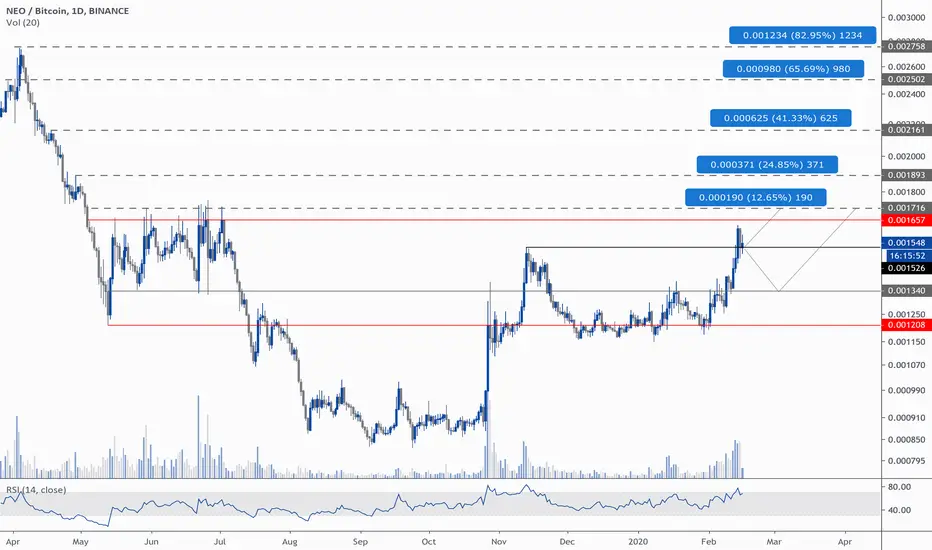
NEOBTC 1-Day ChartTo me this chart is saying quite a few things.
When zooming out I can see a historical support and resistance level is .00133820
On the day chart, we have completed an inverse head and shoulders.
After our breakout we have managed to start to form a neutral pennant suggesting it will breakout either way.
A fib retrace suggest that we have bounced off the 50% which is a very big bullish sign.
Buying range is between .00139 and .00134
Selling range is between .0015 and .0016
Sell Loss is set at .00131

$NEOUSDBITFINEX:NEOUSD
Great example of polarity change big plus is hidden divergences on indicator.
Up trend should resume soon.

NEO/BTC BINANCE4H candles
As long as the price stays in the uptrend parallel channel,
it will continue the bullish movement
MACD crossing bearish (bullish at 1D candles)
volume rising
Good Luck

Neo Still is in a Great buy ZoneHello Traders,
After crossing a important downtrend line, form an reverted head and shoulders and does a pullback the neck line. Neo is in a excellent buy zone and excellent target.
Please, push like button and follow us on Tradingview and in our Social Medias.
Best Regards, Sandro e Gustavo.

$NEOBTCBITFINEX:NEOBTC
Back tested broken neck line of cup and handle on even inverted head and shoulders.
Currently making big engulfing bar. More upside with targets as per chart.

#NEO - Sleeping Giant!The coin has been gradually moving upwards for a number of recent days. Several important resistances were broken and flipped into supports.
I can see a huge demand, bulls are much stronger than bears. Moreover, there is a hidden bullish divergence on the 4H chart which can push the price upwards locally.
Targets on the chart mentioned for long-term holding, as I expect to see a great run in 2020 from $NEO. The last level which must be broken is 0.0017, then the asset will turn ultra-bullish and continue growing thanks to the hype.
NEO/BTC LONGHello guys,
I am thinking of opening long trading with 1-3 btc in NEO / BTC parity.
I hope that the price will come here around 1-2 months.
Sharing is not an investment advice.
I am trying myself.

NEO woken up, aiming for my 4rd target nowHey guys welcome for a fresh crypto update, please like and follow to support us
--------------------------------------------------------
i published NEOBTC update in Oct 2019 and almost predicted the exact bottom
as of now NEO prices have grown by more than 90%
already my given two targets have been completed and now NEO is looking to aim for the 3rd and 4th target which i've predicted for long term
you can clearly see this in below chart
--------------------------------------------------------
now targets are still same so i wont waste your precious time, just be in the game...
Thanks for reading...
For the most profitable premium trading services DM me or contact me through twitter or telegram
--------------------------------------------------------
this is Husain Zabir, signing out
Thankyou...

NEO - Inverse Head and Shoulders - 50% TargetNEO appears to have completed a negative leaning inverse head and shoulders pattern. Given the head height, I place the target at around .00022. I'm long here.

NEOBTC ready to rise?Welcome fellow tradingviewers,
NEO/BTC is showing some real vital signs. With the mini-Altseason we have had the last couple of weeks NEO has been holding back. But now it might just be time to shine!
Monthly:
- We saw a beautiful bullish engulfing candle back in October, indicating more upside.
- The months after october have been slow indicating more upside.
Weekly:
- The last candle closed in a bullish engulfing cande, indicating more upside momentum.
- We are currently testing the 50MA, indicating downside momentum, unless we break it on the first try and find support.
- Weekly MACD crossed bullish, indicating more upside momentum.
- RSI neutral.
Daily:
- This daily candle is looking like a bullish engulfing, which upon close would indicating more upside momentum.
- Daily cup and handle can be found with the breakout level around 1500 sats.
- we are above all MA's and have used them as support, indicating more upside momentum.
- MACD crossed bullish, indicating more upside momentum.
- RSI is neutrals.
In summary:
The most important resistance to break right now would be the 1500 sats area. If this area breaks, the C&H pattern will be breaking out.
The C&H pattern has a target around 2100-2200 sats, if this C&H pattern is going to show us some real strentgh then we might be heading even higher towards the 2600 sats area, but this is too soon to say right now.
Let's focus on what is going to happen in the 1500 sats area first.
This analyses is only intended to share my idea, to educate and entertain you guys.
This should not be considered as financial advice.
I hope you guys enjoyed this analyses, if you did don't forget to leave a Like!
If you want to share your thoughts, please do so in the comments below!
Kind Regards,
FORALLCRYPTO


