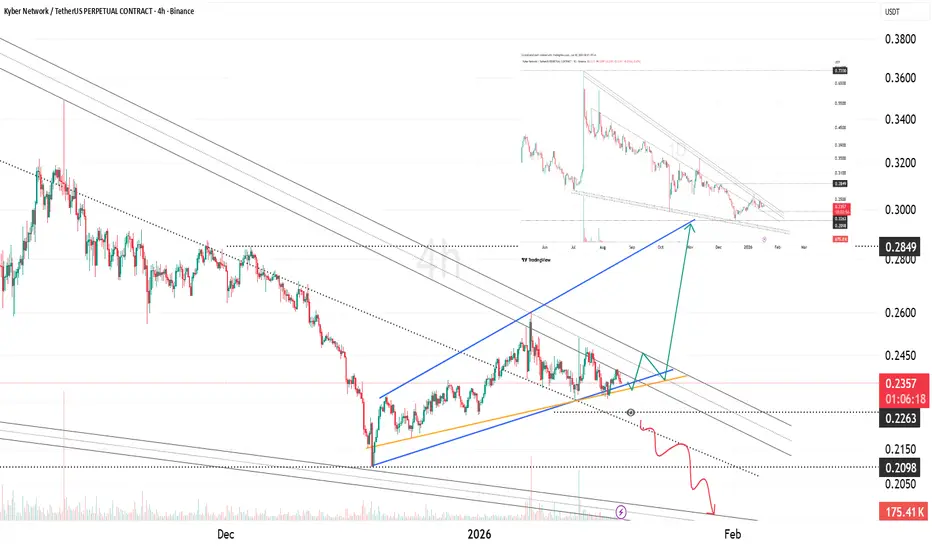
KNC Ascending Broadening Wedge | Expansion Phase at Key SupportKNC is forming an Ascending Broadening Wedge on the 4H timeframe, marked by expanding volatility and higher lows.
Price is currently reacting near the lower boundary of the structure. Holding this zone keeps the bullish expansion scenario active, with upside continuation toward upper resistance zones. A confirmed breakdown below support would invalidate the setup and open downside continuation.
This structure favors volatility expansion rather than range contraction.
Network
#QNTUSDT #4h (Bitget Futures) Bull flag near breakoutQuant regained 50MA support after breaking out of the falling wedge, bullish continuation seems likely.
⚡️⚡️ #QNT/USDT ⚡️⚡️
Exchanges: Bitget Futures
Signal Type: Regular (Long)
Leverage: Isolated (6.0X)
Amount: 4.6%
Current Price:
100.30
Entry Zone:
99.22 - 96.92
Take-Profit Targets:
1) 106.59
2) 112.99
3) 120.11
Stop Targets:
1) 90.95
Published By: @Zblaba
GETTEX:QNT BITGET:QNTUSDT.P #4h #Quant #RWA quant.network
Risk/Reward= 1:1.2 | 1:2.1 | 1:3.1
Expected Profit= +52.1% | +91.3% | +134.8%
Possible Loss= -43.6%
Estimated Gaintime= 1-2 weeks

LTO - Massive Support => Bullish Potential!Hello TradingView Family / Fellow Traders. This is Richard, also known as theSignalyst.
⚔️ LTO is retesting a massive zone , which marks the intersection of two key rejection points:
1️⃣ The $0.02 support level and psychological round number
2️⃣ The lower red trendline, acting as an oversold area
📚 According to my trading style:
As #LTO hovers around the blue circle zone, I’ll be watching for bullish reversal setups (such as a double bottom pattern, trendline break, and so on).
🏹 Moreover, from a medium-term perspective:
For the bulls to shift momentum in their favor, a break above both the upper red trendline and the blue structure is required.
📚 Always follow your trading plan regarding entry, risk management, and trade management.
Good luck!
All Strategies Are Good; If Managed Properly!
~Rich

Bollinger Squeeze and resistance break to go longA squeeze on the Bollinger Bands could be happening in the coming days. This usually indicates consolidation, and an exit from such a pattern is generally explosive. You can see that it has already happened once on Pi.
So, a good squeeze on the BB followed by a breakout of the 'bounce zone' would be a strong long position, with a stop-loss (SL) around 1.6.
The previous analysis suggested a long position, but the price did not respond accordingly to the support, so I hope you didn’t enter a long position.
That's it for today. Have a good week, guys!

Wait for the bounce ...The price has already tested the support and failed to break it. The best thing to do now is to wait for a re-entry into the zone with an upswing and good momentum. Do not take a position if the price exits slowly. Wait for another re-entry or a different type of signal, like a retest of the new upper resistance.
A good SL could be the previous resistance, which can now act as strong support.
Have a great weekend, everyone!

Amazing day for Pi – what's to come?Today was a big day for Pi. We are getting closer to the ATH of 3.4.
The market should not have any reason to reverse in the coming days, but it's important to watch the new level of 3.0 that we need to break. The price can range or continue to retrace a bit (to the SL zone). Another possible scenario is a bearish triangle break (green arrow), which Pi seems to do a lot since the launch.
You should have all the important levels on the graph to help you make decisions in the coming days.
Have a good week, guys!

TradingView 2024 Community AwardsThe 2024 Community Awards are here and they’re better than ever! All of you have made this ceremony a celebration of achievements, revelations and lessons. Enough with the sentimentalities — let’s go straight to the numbers!
In 2024, our community posted 771,813 public Ideas. Credit where credit is due. This number is a testament to your commitment to spreading trading knowledge and sharing your unique insights.
We’re grateful to see so many of you use the TradingView platform to have your voice heard and work appreciated ( and judged maybe, looking at you, picky hard-to-please traders ).
👉 Some more numbers:
✔️ Public scripts published: 60,078
✔️ Comments posted: 785,559
✔️ Public chat messages posted: 10,176,868
✔️ Minds Posted: 471,823
✔️ Minds Comments: 448,370
✔️ Ideas selected for Editors' Picks: 8,686
🤑 Editors' Picks Rewards paid (value): $46,200
🏆 And now — the winners!
Drumroll please… 🥁
🚀 Most Boosted Idea
The trading community couldn’t get enough of these. The most rocket-fueled, fire-starting ideas of 2024 that had traders hitting "Boost" without hesitation.
XAUUSD:29/2 Today’s Analysis and Strategy by @ActuaryJ
Liquidity as the Key to understanding the Market by @glazirovaniysirok
BTC Market Cycle | Repetitive and Predictable Market Cycle by @TeeBusa
🎬 Most Boosted Video Idea
When a single idea is so compelling, traders practically demand to see it in motion. These video ideas topped the charts and had everyone pressing play.
XAUUSD | GOLDSPOT | New perspective | follow-up details by @darcsherry
A Trading Plan Is Important For Success - Here Is Mine by @fxtraderanthony
USDJPY - beginning stages of a drop! by @Taneesha
📊 Most Boosted Educators
The true market whisperers. These educators turned complex charts into lightbulb moments, proving that great teaching is just as valuable as a great trade.
Don't Get Duped by the RSI by @ParabolicP
Powerful Fibonacci Trading Strategy For Beginners by @VasilyTrader
The Ultimate Guide on Elliott Waves in Crypto Trading by @Skyrexio
💬 Most Commented Ideas
Some ideas spark interest. Others start full-on debates. These top three had traders talking, arguing, and dissecting every detail throughout the year.
🅱️ Final Warning: A 50% Capitulation Drop Will Lead To 30K by @MasterAnanda
Bitcoin: How a Great Idea Became a Speculative Mania. by @holeyprofit
BITCOIN POTENTIAL EUROTLX:4K Target On Potential Major BEARISH FLAT by @noble1ones
🎥 Most Commented Video Ideas
A video idea so thought-provoking, the comment section became a trading battleground. These were the three that had traders weighing in with strong opinions and fresh insights.
SPY: What next? by @Steversteves
Why will Ethereum drop toward 2500 level by @ShinForex1
NVDA Video Update Correction vs Reversal by @RealMacro
💬 Most Commented Education Ideas
Knowledge is power, but discussion makes it unstoppable. These top three educational ideas sparked the most conversations, debates, and "aha!" moments in 2024.
DECEMBER ALTCOIN ANALYSIS REQUEST by @weslad
Predicting Bitcoin's Cycle Using the Elliott Wave Theory, Part 2 by @XForceGlobal
Bitcoin REALISM by @Mayfair_Ventures
🧠 Most Upvoted Minds Posts
Big-brain energy at its finest. These posts weren’t just read—they were respected, earning nods from the sharpest minds in the community.
AMD Mind Analysis by @FiboTrader1
Gold Mind Analysis by @Bullionbuzz
XAU/USD Mind Analysis by @Med_In_Trade
⚙️ Most Boosted Pine Scripts
A script so powerful, traders couldn’t help but hit boost. These top three stood out as game-changing tools that made trading smoother, faster, and smarter.
Machine Learning Adaptive SuperTrend by @AlgoAlpha
Linear Regression Oscillator by @ChartPrime
DTFX Algo Zones by @LuxAlgo
🌲 Most Commented Pine Scripts
The scripts that made devs and traders alike drop everything to talk about them. These three had the community dissecting every line of code.
Mxwll Price Action Suite by @MXWLL-Capital-Trading
Ichimoku Oscillator by @LonesomeTheBlue
Live Economic Calendar by toodegrees by @toodegrees
📚 Most Commented Pine Libraries
The libraries that had coders, quants, and strategy builders obsessed. These weren’t just resources; they were the foundation for countless new trading tools.
HTFCandlesLib by @Trendoscope
Order Block Drawing by @TFlab
ottlib by @ismailcarlik
Trading isn't a solo sport — the best ideas, tools, and insights come from a thriving community. These winners didn’t just post content — they shaped the conversation in 2024, sparking discussions, refining strategies, and making TradingView an even better place for traders of all levels.
To celebrate their contributions, each of the winners in every category will receive a one-year Premium plan for free. All selections are final and won’t be debated (gotta keep it fair and free from vote-stuffing shenanigans) Keep those great ideas coming! Prizes will be assigned before the end of February, so stay tuned. And who knows? Maybe next year, it’ll be your name on this list. 🚀

SWING IDEA - NETWORK 18 MEDIANetwork 18 Media , a prominent player in the media and entertainment industry, is showing signs of a promising swing trade opportunity based on several key technical indicators.
Reasons are listed below :
75-80 Support Zone : The 75-80 level is a crucial support zone that has held multiple times, indicating strong buying interest at these levels.
Bullish Engulfing Candle on Weekly Timeframe : The formation of a bullish engulfing candle on the weekly chart suggests a reversal of the previous downtrend and indicates strong buying pressure.
0.618 Fibonacci Support : The stock has retraced to the 0.618 Fibonacci support level and is now bouncing back, indicating a potential reversal and continuation of the uptrend.
Breaking Consolidation Phase of 2+ Months : Network 18 Media is breaking out of a consolidation phase that lasted over two months, signaling the beginning of a new bullish trend.
Decisive Break Above 50 EMA : The price has decisively broken above the 50-day exponential moving average, confirming the bullish sentiment and providing a strong support level.
Target - 105 // 120 // 135
Stoploss - weekly close below 81
DISCLAIMER -
Decisions to buy, sell, hold or trade in securities, commodities and other investments involve risk and are best made based on the advice of qualified financial professionals. Any trading in securities or other investments involves a risk of substantial losses. The practice of "Day Trading" involves particularly high risks and can cause you to lose substantial sums of money. Before undertaking any trading program, you should consult a qualified financial professional. Please consider carefully whether such trading is suitable for you in light of your financial condition and ability to bear financial risks. Under no circumstances shall we be liable for any loss or damage you or anyone else incurs as a result of any trading or investment activity that you or anyone else engages in based on any information or material you receive through TradingView or our services.
@visionary.growth.insights

(CELR) celer network "activity in palestine" Celer network through crunchbase.com data shows a 10% activity from Palestine. Data by semrush.

(GLM) golem network "most active in russia"data provided by crunchbase.com per semrush shows Golem is most active in Russia.

RENDR: $2.10 | for 2022 +800% Payback Project is cool
Packaging reminds me of Nvidia and ATi Radeon back in Half Life era 1999
Concept idea is siilaer to OMG in 2015
claiming for metaverse category
clever and sould be a good deal to get volume at sub 1.0

XRP 2025 Bull runWe are getting ready for a new payment system and the many possibilities for digital solutions both for P2P but also B2B.
We want to believe that many will come at once in the form of countries that want to join.
From 2 to X our guess is 57.

LTC - 4 long years
It has once again been an outstanding experience to prepare for yet another bull run, which has now begun 📈. We have previously witnessed similar periods and understand that it requires a long and challenging effort to maintain our position and index during these uncertain times. This period will test our endurance and strategies, but we are proud to have maintained our stability and achieved remarkable results in previous bull runs 🏆. We look forward to future challenges and continue to strive for excellence in our endeavors 💪.

(BTC) bitcoin "volume"The volume measures of now versus the past are at a height that is as high as when Bitcoin was at a previous all time high years ago. The main difference now versus then in case people have already forgotten is the fact that the halving means a difference in value for mining and the capacity to hold blocks, mine block, transact blocks. The current volumes are high as they ever were in the past with a decrease in mining value and an increase in large in flows from ETF transactions with holdings being done through Coinbase to afford outsiders that want to use bitcoin to invest without being the physical holder of the BTC.
The price of Bitcoin falling due to such high volumes is less likely when taking into consideratipn where the volume came into play in the first place and the halving change values.
Will there be people that will use Bitcoin to transact during the Olympics to keep their transactions private internationally? How likely is the usage of Bitcoin in the real world coming? The sooner the realization of Bitcoin as a transactional digital currency internationally is understood the stronger the usage.
You will have to make your own mind about whether the volume can go higher in the pink dot range and if the value of Bitcoin in your own mind is going to continue to increase, remain neutral thus allowing the pink dots to slowly decrease in height, or physically decrease in share value per BTC.

(BTC) bitcoinrank, % rank, median; info dots chart graph volume of buying power, note, graph indicator progress, process; make zone, ideas.

RiO: $0.118 | A placement Agency had this at $0.01 cent.. sold to early with 2x profit missed out the 20x ...
maybe revenge trade when new banker takes over
as majority holdr is dispensing shares
a link between real word and digital
with rioverse as flagship product ahead of its time

BTC bitcoinmapping a trajectory, the purple line is really the more important one I've noticed from all the lines in this particular injector frame. See how the lines are similar; the kind of stuff the people like to seem and compare.

ATEM/USDTNew Gem on Web3 network . ready for explode
500,000$ mc , 60K follower in X , just 2 exchange listed (Gate , kucoin )

GRPN, THE LITTLE COUPON APP THAT COULD (EARNINGS CHART)Can it keep going? Technically, yes. I see numbers up to $40.
However, I'm posting this because I see this idea as far more likely to occur is some form.
It looks like a potential top is about to occur.
At these levels, with momentum, a drop could take price as low as $4. If not lower, down to $2.
It's hard to be bullish on this stock with a chart like this.
In other words, I'm saying, I don't know if there is more upside, and if there is, I'm okay with missing it because I'd rather not be wrong and ultimately lose money on the downside.
Mostly a question of risk vs reward.
I would ultimately be bearish overall.
I think the pink zone might see a top and I think we could see trends break all the way down to the blue zone.
Current pattern is highlighted.


#SCRT/USDT 1D (ByBit) Falling broadening wedge breakoutSecret Network is about to regain support, seems ready for short-term recovery towards 100EMA & 200MA resistances.
⚡️⚡️ #SCRT/USDT ⚡️⚡️
Exchanges: ByBit USDT
Signal Type: Regular (Long)
Leverage: Isolated (2.4X)
Amount: 5.0%
Current Price:
0.3480
Entry Zone:
0.3458 - 0.3218
Take-Profit Targets:
1) 0.3999
2) 0.4497
3) 0.4995
Stop Targets:
1) 0.2785
Published By: @Zblaba
$SCRT #SCRTUSDT #Secret #Privacy
Risk/Reward= 1:1.2 | 1:2.1 | 1:3.0
Expected Profit= +47.5% | +83.3% | +119.1%
Possible Loss= -39.8%
Estimated Gaintime= 1-2 months
scrt.network

ETH TO BREAK THE $2K MARK BEFORE RETRACEMENT!Good day my fellow crypto traders, HODlers, speculators and critics! Before I get into the technical side of things I would like to mention to those who are not aware of the ZKSync release which is a huge milestone in the ZK-rollup space. In laymen's terms ZKSync is an update that offers low gas and fast transactions, without compromising on security. The ZKSync era is also here to make the Ethereum network more decentralized, through making it possible for retail traders to operate nodes on the network as the GPU requirements have dropped dramatically to 8GB. This will help prevent large institutions running nodes to centralize the the network and instead give everyone the ability to run their nodes with less processing power.
Now that, that is out the way here is my explanation for my prediction on the market structure of ETH in both the short and long term.
Short term bullish flag formation (yellow): We are currently channeling a bullish flag fomration within a bearish flag formation. To focus on the bullish flag formation, the price prediction before a retracement is due, is roughly $2400, however, this will not happen over night per say as we have a few levels of resistance we have to cross before this is possible, first one being the $2k and roughly $2.1 marks.
Elliot wave indicator 1-5: In order to be more confident in the potential retracement out of the bearish flag formation to the predicted levels of $1.4k, the Elliot wave formation must be completed which would mean the price reaching $2.4k, or the price would bounce off the $2.1k mark resulting in a double top before the price begins to move down in the days/weeks to come. These low prices will most probably only be found nearing the end of the year, into early 2024, before the bull market begins in full swing.
Bearish flag formation (white): This price prediction in the longer term is highly possible due to the fact that a constant higher high and full swing bull market structure is a bit premature at this time, regardless of the narrative being shifted into a bullish point of view. It would not be healthy if the market continues rapidly to the up side and would most definitely result in an over inflated price, which in return would result in a major retracement offsetting the strengthening of much needed support and resistance levels for future price action.
Please be aware that this article in no shape or form is direct financial or trading advice and should only be used as a metric to add extra confluence to your already existing analysis and do-diligence on this specific topic. Be safe out there and trade responsibly, even if the market is looking unstoppable, ESPECIALLY if the market is looking unstoppable, this generally is a sign that the market is far from it.
Thank you for reading to this point! feel free to like and follow for more daily articles like this. Comment your opinion on this topic, whether you agree or not, every opinion strengthens the case for or against certain changes made to my perspective.
