#EURUSD Roadmap if the Plaza Accord Scenario is ConfirmedFed and NY Fed Actions on USD/JPY: Last week, reports emerged that the Federal Reserve Bank of New York conducted so-called "rate checks" on USD/JPY — technical consultations that often precede currency intervention. This was indeed interpreted by the market as a signal of readiness to support the yen, although no direct interventions have occurred yet — only the possibility of them.
Important: Despite the absence of direct interventions, the market reacted to the rumors: the dollar weakened against the yen, and the dollar index pulled back, as investors remember the power of coordinated actions similar to the Plaza Accord.
The news is generally credible, however, it's important to note that we're currently only discussing the possibility of intervention and talks about a new version of the Plaza Accord — not an actual agreement or joint operations. Real economic consequences will depend on whether practical actions follow the statements and "rate checks."
If the news is confirmed. Here's my new roadmap for the pair:
Weekly chart analysis. Identifying key historical levels.
Daily chart analysis. Determining impulse movement targets and projected correction levels.
Summary:
We've broken out of the accumulation zone on impulse from the news.
Nearest target: 1.22
Next target: 1.24 (possible sideways movement, partial profit-taking, position accumulation)
If intervention news is confirmed:
New target: 1.28
Correction (likely): 1.24
Final target: 1.30
Reversal.
And here's where it gets interesting.
Weak #USD = Strong #BTC
Newsignal

Balaji Amines: Trend Reversal from Descending Channel?Balaji Amines (NSE: BALAMINES) has been trading within a well-defined Descending Channel for several months. This structure is characterized by lower highs and lower lows, indicating a sustained corrective phase. However, the recent price action suggests a potential structural shift.
Technical Observations:
Channel Breakout: The price has decisively breached the upper resistance trendline of the parallel channel.
Volume Participation: As noted, this move is accompanied by a spike in volume, which is a critical filter. A breakout with volume suggests that institutional interest is returning to the stock at these valuations.
Change in Polarity: The stock is attempting to transition from a "Mark-down" phase to a potential "Accumulation/Mark-up" phase.
Key Technical Levels:
Immediate Support: The upper trendline of the channel (which was resistance) should now act as support during any pullbacks.
Trade Invalidation: The bullish thesis relies on the price sustaining outside the channel. A daily close back inside the channel structure (below ~1,120) would invalidate the breakout and suggest a "Bull Trap."
Technical Resistance (Upside): Looking at the previous market structure, potential supply zones exist near the previous swing highs (~1,350 and ~1,450 zones).
Risological Note: We monitor Descending Channels because they provide clear boundaries of risk. A breakout often signals that the "Sellers are exhausted," but we always wait for the close to confirm the move.
Disclaimer: This analysis is for educational purposes only and discusses technical chart patterns. It is not financial advice or a recommendation to buy or sell. Please consult a SEBI registered investment advisor.
DONT FORGET TO LIKE AND FOLLOW FOR MORE IDEAS.
CHECKOUT THE LINKS BELOW TO FIND MY TRADING STRATEGY.

Apple Stock Setup: Momentum and Patterns Point Toward New ATHA deep dive into Apple’s latest technical setup, analyzing MACD momentum, RSI strength, and emerging chart patterns that signal a potential breakout toward a new all-time high around $290.

1 Hour TF - GOLD Next Buying Level- Droid TradingGold in Consolidation Zone B/W Strong Resistance or OB-FVG
New Buying Level - 3680-85 ( Strong Buying)
Again Tapping 3610-3615 ( Buying Possible After Bullish candle 1 hour Closing Above)
1 hour candle Closing Above Strong Resistance - Buying Possible ( 3670-75 to Target ATH )
Wait for entry, don't in hurry, Keep SL, Book Profit as Your Daily Target
Entry only in Level

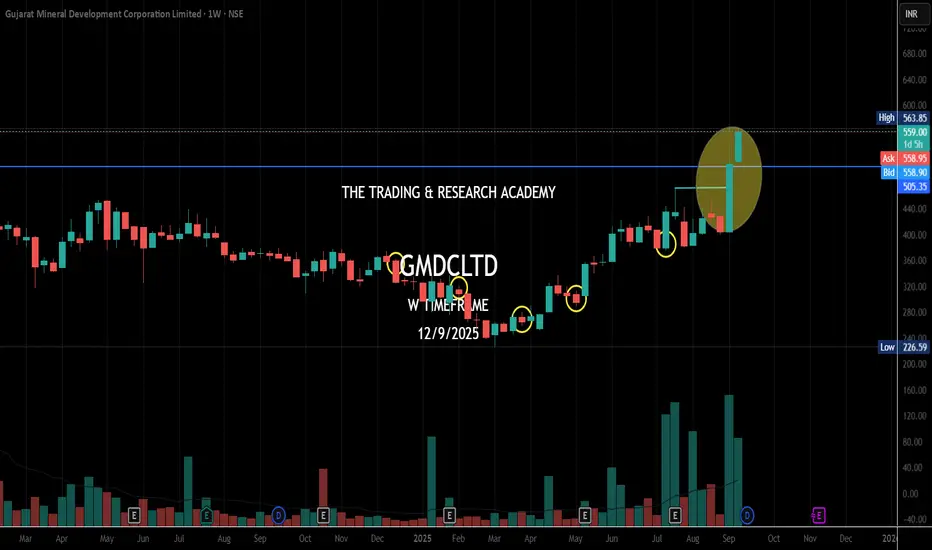
Chart Speaks - #GMDC#GMDCLTD : ENGAGED WITH MYANMAR TO PROCURE RARE-EARTH MINERALS|| GOVT HAS ASKED PSUS, PRIVATE COS TO SEE PROSPECTS OF SAMPLE COLLECTION FROM MINES IN NORTHEAST MYANMAR
GMDC is up36% in 2 days! Chart Speaks, Someone knew this already. Look at the chart
#chartspeaks
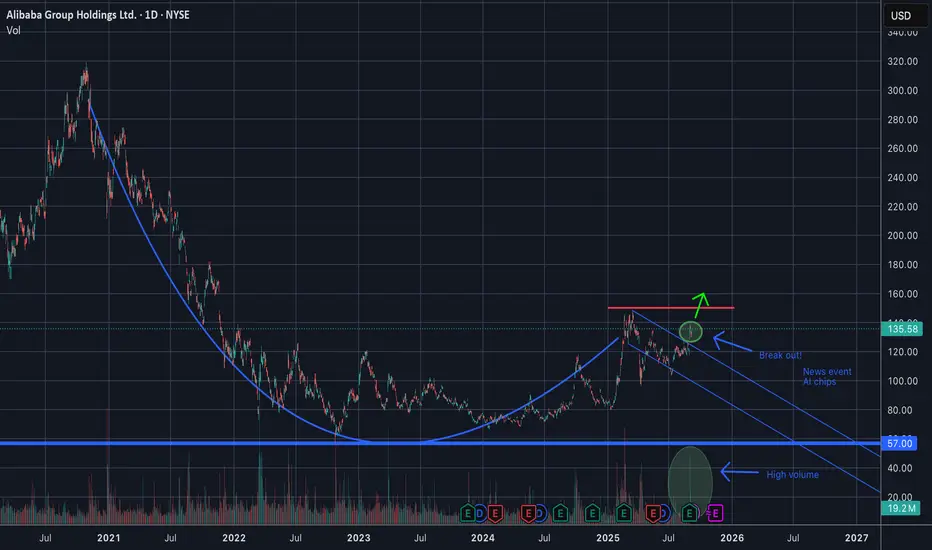
BABA Cup and Handle Breakout?The BABA chart has been perfectly forming a cup and handle pattern since the downturn in 2021.
Then BABA recently announced its AI Chips. This news event seems to have broken the stock out of its handle, indicating it will start a bull run.
BABA is a solid company with big plans and I believe it should have no problem reaching ATH's.
Thoughts?
USDJPY | NFP helped pushed Price down since USD is weakIt looks like the price has moved into our area of interest. All that remains is to secure our position and anticipate further downward movement.
Right now, the price is at a previous high-volume area. We'll have to observe closely to see if this changes the bias, providing us with bullish intent or continuing on a bearish trend.
For now, we wait and watch the market closely.

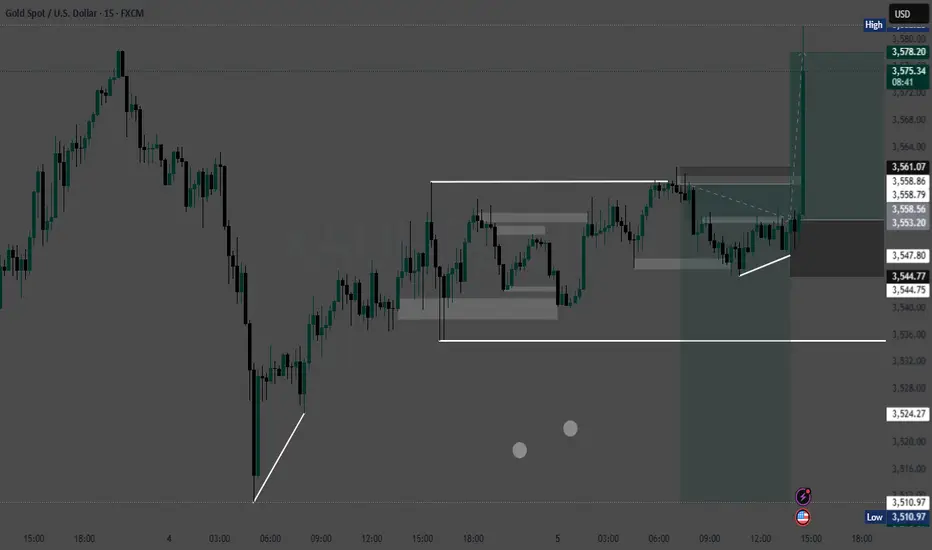
NFP numbers came in softer than expectedlooks like the weak NFP numbers came in softer than expected, and gold (XAU/USD) reacted bullishly just as anticipated.
Dollar weakness on the back of the softer labor data boosted demand for gold.
Gold surged above resistance at $3,578, confirming the breakout scenario we mapped.
Market sentiment now favors a continuation toward the $3,600+ zone, unless profit-taking slows momentum.
Charts Speak #Sharada Cropchem
Sharada Cropchem
Charts always lead the News! This is yet another example where price was leading & News came later.
Stock was under accumulation since June with higher qty. In fact since May 25, it was getting bought in average 2-3M qty weekly. What a planned buying..
28th May, 4 June, 18th July were nice buying alarms for us. Today it was just a final nail in the coffin.
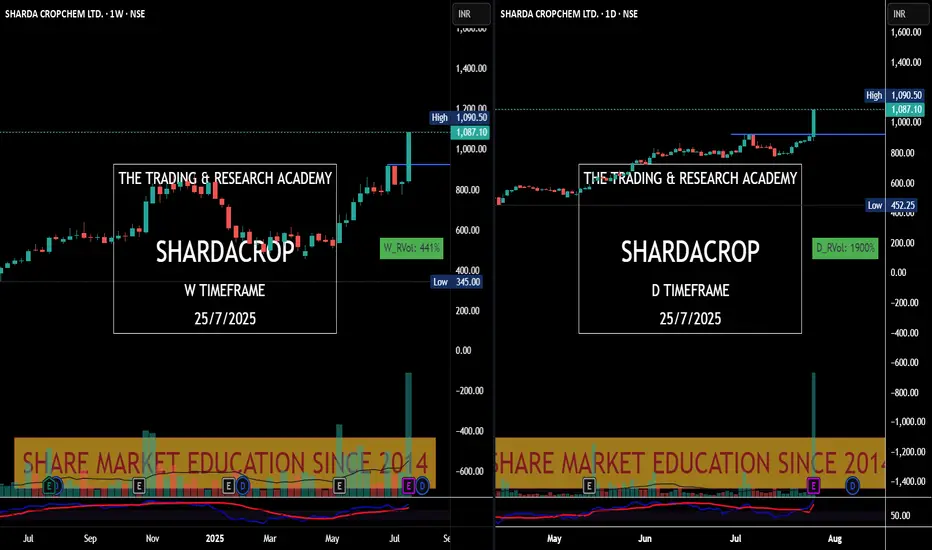
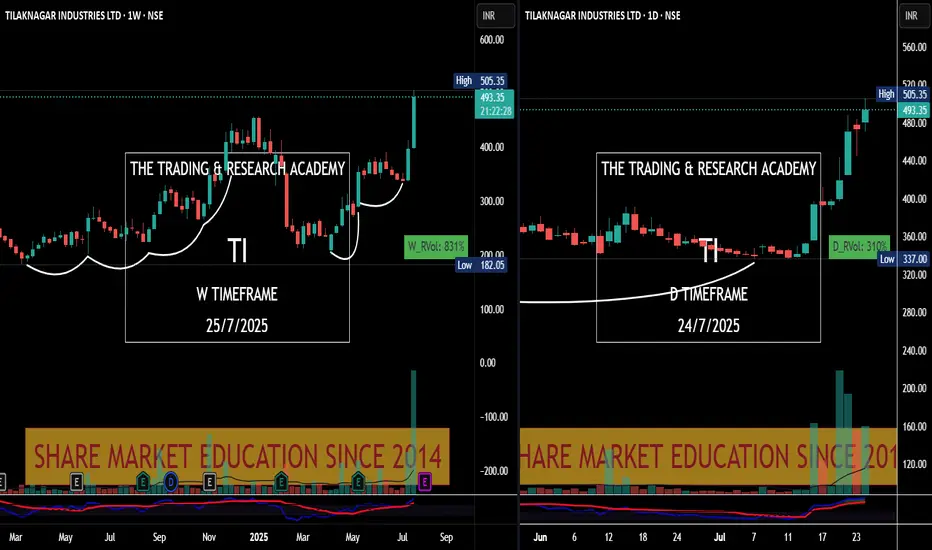
Chart Speaks- Tilak Nagar Ind
#Price leads the #News! Tilak Nagar Ind #tilaknagar see the chart v/s News.
News came yesterday, have a look at chart. Someone was accumulating it since long.
Chart Speaks
Volume spikes on down moves add to selling pressure.📉 BTCUSDT – 1H Chart Technical Outlook
🔍 Structure Insight:
Bitcoin is currently trading within a descending channel, forming lower highs and lower lows, indicating persistent bearish pressure. Price action appears compressed between key trendlines, hinting at an imminent breakout.
---
🔻 Scenario 1: Bearish Breakdown (Primary Bias)
If BTC fails to hold above the lower boundary of the range, a decisive break below could trigger a sharp move toward the 103,650–103,000 demand zone. The structure supports continuation to the downside if the price rejects resistance again.
🧊 Bearish Confluence:
Price is unable to break above dynamic resistance.
Momentum remains weak near the mid-range.
Volume spikes on down moves add to selling pressure.
---
🔼 Scenario 2: Bullish Breakout (Alternative View)
A breakout above the descending trendline and confirmation candle could flip bias short-term bullish. This would target the 105,400+ region as the next liquidity area.
⚡ Bullish Signs to Watch:
Break and retest above trendline resistance.
Bullish engulfing or breakout candle with volume.
---
🔍 Key Levels to Monitor
Support: 103,650 / 103,000
Resistance: 105,000 / 105,400
Breakout Zones: Watch for clean breaks and retests outside the wedge pattern.
---
📌 Conclusion:
BTC is coiling within a tightening range. The breakout direction will likely dictate the next short-term trend. Maintain flexibility — breakout confirmation is key before positioning.
🚨 Not financial advice — always DYOR before trading!

Gold (XAU/USD) Bearish Trendline Breakout – Short Set.Trend Channel: Price had been moving within a clear ascending channel. Recently, price action tested the lower trendline and appears to have broken below it, indicating potential bearish momentum.
Ichimoku Cloud: The price has moved below the Ichimoku cloud, which adds further bearish confirmation. This breakdown of both the trendline and the cloud indicates a possible shift in trend direction.
Volume Spike: A slight increase in volume during the breakout suggests growing interest from sellers.
Entry Signal: The chart marks a zone (circle) where traders should watch for a red candle confirmation. A bearish close below the trendline supports initiating a short position.
Targets:
TP1 (Take Profit 1): Around the 3,240 zone — this is a moderate support area and a conservative profit target.
TP2 (Take Profit 2): Around the 3,160 zone — this aligns with a previous demand zone and represents a deeper corrective move.
Trade Strategy:
Entry: After confirmation with a red candle below the trendline and Ichimoku cloud.
SL (Stop Loss): Ideally placed above the trendline or recent high to protect against a false breakout.
Conclusion:
If the price holds below the ascending channel and the Ichimoku cloud, the setup favors short sellers. Watch closely for bearish candlestick confirmation before entering. TP1 and TP2 offer clear targets based on past support zones.
Would you like a follow-up with live price tracking or updated levels?

XAUUSD Update: Bullish or Bearish? Key Levels to Watch! 🚨 Attention Traders! 🚨
XAUUSD is making waves and breaking through key levels! 🔥 The price is currently battling between 2980 and 2989 — will we see a breakout soon?
Bearish Alert: A dip below this range could lead us to targets like 2860 and 2850. ⚠️
Bullish Opportunity: A move above 2989 could trigger buying opportunities, with targets around 3004 and 3027. 🚀
💬 Let’s Talk Strategy! What’s your take on this? Share your insights as we ride this golden wave together and unlock new opportunities! 💰

$XRP Eyes $10 as SEC Case ClosesAnalysts predict that XRP CRYPTOCAP:XRP could reach $10 by 2030 after the SEC officially dropped its lawsuit against Ripple. Ripple CEO Brad Garlinghouse confirmed that the regulator will not appeal the court’s decision, marking the end of the legal battle that began in 2020. As of March 24, 2025, XRP CRYPTOCAP:XRP trades at $2.46, up 2.17% in the past 24 hours, with a market cap of $143.29 billion.
Despite bullish prospects, challenges remain. Market volatility and competition from Ethereum and stablecoins could slow growth. Analysts at InvestingHaven believe XRP’s success depends on Ripple’s network expansion, though crypto market instability remains a key factor.
While a 306% rise to $10 by 2030 seems feasible, today’s market is less competitive than in 2017 when XRP CRYPTOCAP:XRP surged 64,000%. Investors are closely watching regulatory changes and macroeconomic conditions that could impact the coin’s future trajectory.

STRONG REVERSAL COMMING FROM NEW ATH ALERT!📈 Description:
This is a 2-hour timeframe analysis of Gold, the market is currently consolidating between a strong support zone 📉 and a weekly high resistance level 📈. Two possible breakout scenarios can be expected:
✅ Bullish Scenario: If the price holds the strong zone at 3028 and gains momentum, it may break out above the weekly high 🚀.
❌ Bearish Scenario: If the price breaks below this strong support zone i.e 3028, it could trigger a downward move toward a lower support level 📉.
👀 Traders should watch for breakout confirmations before entering trades! 📊📉📈
follow risk management

#MUBARAKUSDT continues its downtrend📉 Short BYBIT:MUBARAKUSDT.P from $0,14040
🛡 Stop loss $0,15196
🕒 1H Timeframe
⚡️ Overview:
➡️ The main POC (Point of Control) is Nan
🎯 TP Targets:
💎 TP 1: $0,12395
💎 TP 2: $0,10611
💎 TP 3: $0,09178
📢 Monitor key levels before entering the trade!
BYBIT:MUBARAKUSDT.P continues its downtrend — watching for further movement!

Gold (XAU/USD) 4H Chart Analysis: Resistance Test & Potential BrPrice Trend:
The chart shows a steady upward movement in the price of gold, starting from late February into March 2025. The price is currently around $2,917.25 and has reached near the resistance level marked on the chart.
Resistance Zone:
The resistance area, located between $2,911 and $2,920, seems to be a crucial level. Gold has faced difficulty breaking through this level multiple times, as seen in the sideways movement after hitting the resistance.
Target Level:
The target above this resistance zone is marked around $2,960, indicating the potential for further price appreciation if gold can break above the current resistance.
Price Action and Potential Breakout:
There's a potential for a breakout as the price appears to be forming a bullish structure near the resistance, indicating that if gold manages to break above this zone, it could continue its upward trajectory toward the target area.
Volume and Market Sentiment:
The volume indicators on the lower part of the chart are not heavily discussed here, but there might be a correlation with market strength. The chart suggests potential consolidation before a move upward if the resistance breaks.
Conclusion:
Gold is currently testing the resistance area, and if it successfully breaks through, it could aim for the target level around $2,960. Keep an eye on this price level as it could signal further bullish movement.

NEWS MOVE ALERT PPI AND UNEMPLOYEEMENT CLAIM.🚨 Gold Trading Update 🚨
Hey Traders! 👋
Here's the current scenario: Gold is heading towards the 2950-2955 level. Expect a possible fake-out, followed by a sharp drop. 📉
🔍 Key Insight: There’s an FVG on the H1 chart, signaling a potential sell-off before we see another GOLD rally. 🚀
Today’s News: PPI report 📊 drops, so expect a significant market move! Gold might respect the FVG and target these levels for a potential buy:
👉 2970
👉 2980
👉 3000
⚠️ Tip: Follow my strategy and always use proper risk management with a 1:2 risk-to-reward ratio. 💡
Happy Trading! 💰📈

XAUUSD NFPGold price remains depressed above $2,900, US NFP awaited
Gold price edges lower on Friday amid some repositioning ahead of the crucial US NFP release. Rising trade tensions, the risk-off mood, and a weaker USD lend support to the precious metal. Bets for more interest rate cuts by the Fed contribute to limiting losses for the XAU/USD pair.
Signals update shortly

XAUUSD📌Gold price holds the previous rebound from weekly lows early Wednesday.
📌Fresh haven demand on tariff uncertainty and US economic woes underpin Gold price.
📌Gold buyers stay hopeful amid bullish daily RSI, while the 21-day SMA at $2,883 holds.
🔥Buy Gold
$2905 -> $2903
SL $2900
TP 1->$2908 >2->$2912 >3->$2920
🔥Buy Gold
$2889 -> $2887
SL $2882
TP 1->$2895 >2->$2903 >3->$2910
🔥Sell Gold
$2946 -> $2948
SL $2953
TP 1->$2940 >2->$2930 >3->$2920

News TradingLet’s talk about news trading in Forex . While news trading is extremely lucrative it’s one of the most risky things a trader can do and experience. News and data cause extreme volatility in the market and as we always say “volatility can be your friend or your enemy” . Let’s take a deeper dive into news trading, which news and data affect the TVC:DXY precious metals such as OANDA:XAUUSD and other dollar related currency pairs. We will also cover having the right mindset for trading the news.
1. Understanding News Trading in Forex
News trading is based on the idea that significant economic data releases and geopolitical events can cause sharp price fluctuations in forex markets. We as traders, aim to profit from these sudden price movements by positioning ourselves before or immediately after the news hits the market. However, due to market unpredictability, it requires a strategic plan, risk management, and quick decision making.
2. What to Do in News Trading
1. Know the Key Economic Events – Monitor economic calendars to stay updated on high-impact news releases.
The most influential events include:
Non-Farm Payrolls (NFP) – A report on U.S. job growth that heavily influences the U.S. dollar.
Consumer Price Index (CPI) – Measures inflation, impacting interest rate decisions and currency valuation.
Federal Open Market Committee (FOMC) Meetings – Determines U.S. monetary policy and interest rates, affecting global markets.
Gross Domestic Product (GDP) – A key indicator of economic growth, influencing currency strength.
Central Bank Statements – Speeches by Fed Chair or ECB President can create large market moves.
2. Use an Economic Calendar – Websites like Forex Factory, Investing.com, or DailyFX provide real-time updates on economic events.
3. Understand Market Expectations vs. Reality – Markets often price in expectations before the news is released. If actual data deviates significantly from forecasts, a strong price movement may occur.
4. Trade with a Plan – Whether you are trading pre-news or post-news, have clear entry and exit strategies, stop-loss levels, and a defined risk-to-reward ratio.
5. Monitor Market Sentiment – Pay attention to how traders are reacting. Sentiment can drive price action more than the actual data.
6. Focus on Major Currency Pairs – News trading is most effective with liquid pairs like FX:EURUSD , FX:GBPUSD , FX:USDJPY , and OANDA:USDCAD because they have tighter spreads and high volatility.
3. What NOT to Do in News Trading
1. Don’t Trade Without a Stop-Loss – Extreme volatility can cause sudden reversals. A stop-loss helps prevent catastrophic losses.
2. Avoid Overleveraging – Leverage magnifies profits but also increases risk. Many traders blow accounts due to excessive leverage.
3. Don’t Chase the Market – Prices may spike and reverse within seconds. Jumping in late can lead to losses.
4. Avoid Trading Without Understanding News Impact – Not all economic releases cause the same level of volatility. Study past reactions before trading.
5. Don’t Rely Solely on News Trading – Long-term success requires a balanced strategy incorporating technical analysis and risk management.
4. The Unpredictability of News Trading
News trading is highly unpredictable. Even when a report meets expectations, market reactions can be erratic due to:
Market Sentiment Shifts – Traders might focus on different aspects of a report than expected.
Pre-Pricing Effects – If a news event was anticipated, the market might have already moved, causing a ‘buy the rumor, sell the news’ reaction.
Liquidity Issues – Spreads widen during major news events, increasing trading costs and slippage.
Unexpected Statements or Revisions – Central banks or government agencies can make last-minute statements that shake the market.
5. How News Affects Forex, Gold, and the U.S. Dollar
1. U.S. Dollar (USD) – The USD reacts strongly to NFP, CPI, FOMC statements, and GDP reports. Strong economic data strengthens the dollar, while weak data weakens it.
2. Gold (XAU/USD) – Gold is an inflation hedge and a safe-haven asset. It often moves inversely to the USD and rises during economic uncertainty.
3. Stock Market & Risk Sentiment – Positive economic news can boost stocks, while negative reports may trigger risk aversion, benefiting safe-haven currencies like JPY and CHF.
6. The Right Mindset for News Trading
1. Accept That Volatility is a Double-Edged Sword – Big moves can mean big profits, but also big losses.
2. Control Emotions – Fear and greed can lead to impulsive decisions. Stick to your strategy.
3. Risk Management is Key – Never risk more than a small percentage of your capital on a single trade.
4. Adaptability – Be prepared to change your approach if market conditions shift unexpectedly.
5. Patience and Experience Matter – The best traders wait for the right setups rather than forcing trades.
Thank you for your support!
FxPocket

XAUUSD BULLISH PATTERN CHARTHEY,
all my trader friends if you see m30 there is strong support at 2895 to 2899 so posible to gold fall and retest the area of this level and pull back to 2915.
if powell speaks is good for currency that time so we see gold fall wanna gold again buy from 2895.
BUY scenerio target 2916 this position all trader booked their 50% profit and half for continue to 2940

EUR RALLY ON ECB MEETING?Trading Plan for ECB Rate Decision
1. BASELINE 📊
- Market Expectations for Interest Rates: The market is anticipating a rate cut by the ECB, with a forecasted main refinancing rate of **2.90%** down from **3.15%**. The STIR markets have priced in a 50 bps cut, suggesting strong expectations for a reduction.
- Upcoming Event Predictions: Consensus is that the ECB will cut rates by either 25 bps or 50 bps to stimulate the economy due to lower inflation and weaker-than-expected growth.
- Trend Analysis: The ECB has been lowering rates since last year in response to economic challenges. This trend is likely to continue.
- Pre-positioning Observation: The flat movement in the proprietary euro index suggests cautious pre-positioning, indicating that significant moves might occur post-announcement.
2. SURPRISE⚡ :
- 25 bps Cut: If the ECB cuts rates by **25 bps**, it could lead to an upside in the euro due to repricing, as the market has priced in a 50 bps cut.
- 50 bps Cut: If the ECB cuts rates by **50 bps**, it might be seen as expected, leading to a less significant market reaction.
3. BIGGER PICTURE 🌐
- Short-term Play: If the ECB cuts rates by **25 bps**, initiate a short-term intraday trade on the predictable directional volatility, taking advantage of the potential upside in the euro due to repricing.
- Long-term Play: The broader expectations for future interest rates remain unchanged, suggesting that neither scenario will alter the bigger picture significantly.
