2026 - A prosperous year is coming!🙏2026 will be a very prosperous year:
-> Focus on financial health
-> Focus on physical health
-> Focus on social health
and always remember to keep your #LONGTERMVISION
SwingTraderPhil
SwingTrading.Simplified. | Investing.Simplified. | #LONGTERMVISION
Newyear

HAPPY NEW YEAR - 2026Happy New Year Everyone
Let's have a wonderful year, keep things simple and enjoy our time!!!

NQ Power Range Report with FIB Ext - 1/2/2026 SessionCME_MINI:NQH2026
- PR High: 25504.00
- PR Low: 25448.50
- NZ Spread: 124.0
Key scheduled economic events:
09:45 | S&P Global Manufacturing PMI
Session Open Stats (As of 12:25 AM)
- Session Open ATR: 333.71
- Volume: 26K
- Open Int: 275K
- Trend Grade: Long
- From BA ATH: -2.9% (Rounded)
Key Levels (Rounded - Think of these as ranges)
- Long: 26521
- Mid: 25264
- Short: 24008
Keep in mind this is not speculation or a prediction. Only a report of the Power Range with Fib extensions for target hunting. Do your DD! You determine your risk tolerance. You are fully capable of making your own decisions.
BA: Back Adjusted
BuZ/BeZ: Bull Zone / Bear Zone
NZ: Neutral Zone

Ethereum (ETH) Waiting for Cycle Completion Before the Real MoveAt the current stage, Ethereum is not ready to trend.
Market geometry and cycle rules indicate that price still requires
one final corrective drop before the primary move can begin.
Key observations:
• Price is ranging, not expanding
• Volatility is compressed
• The cycle structure remains incomplete
This is a time-consumption phase, not an execution phase.
Forcing positions here goes against structure.
My focus is on:
✔️ Completion of the downside leg
✔️ Cycle maturity
✔️ Structural reset
Once this process is complete,
the main move begins —
and historically, these moves tend to reach their objectives quickly.
This is not a prediction.
It’s a cycle-based, geometry-driven framework.
Patience is the setup.

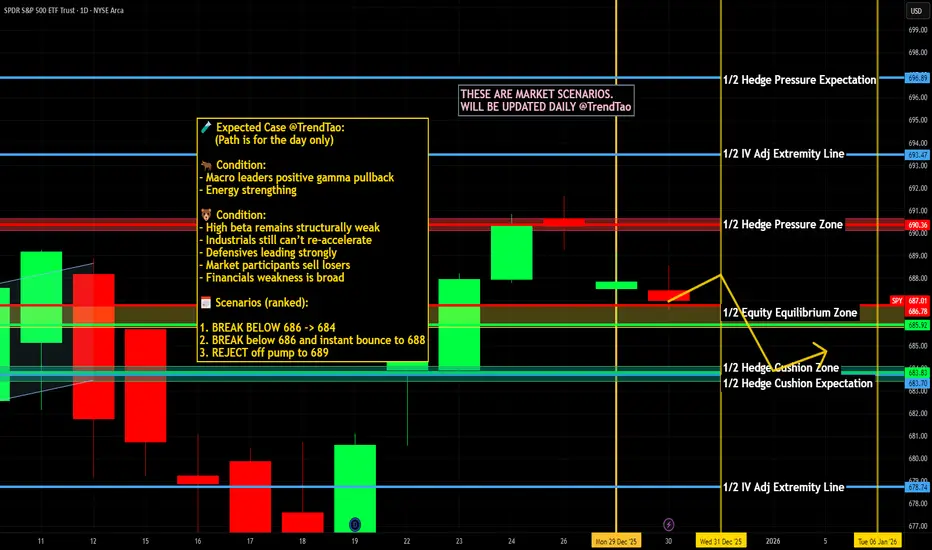
$SPY & $SPX Scenarios — Wednesday, Dec 31, 2025🔮 AMEX:SPY & SP:SPX Scenarios — Wednesday, Dec 31, 2025 🔮
🌍 Market-Moving Headlines
• Thin year-end liquidity: Last full trading day of the year — moves can look exaggerated on light volume.
• Labor data check-in: Jobless claims remain one of the few real-time macro reads as markets close out 2025.
• Positioning over fundamentals: Window dressing, tax considerations, and book-closing flows matter more than narratives today.
📊 Key Data & Events (ET)
8 30 AM
• Initial Jobless Claims (Dec 27): 220,000
⚠️ Disclaimer: For informational use only — not financial advice.
📌 #SPY #SPX #JoblessClaims #YearEnd #Markets #Trading
When Indexes Disagree: Evidence-Based Clues Heading Into 2026Market Context: Why Futures-Based Index Analysis Matters
When equity markets approach historical extremes, surface-level price action often hides important structural information. This is especially true when analyzing cash indices alone. Futures markets, by contrast, provide continuous pricing across all trading sessions, including the Globex (Extended Trading Hours) session, offering a more complete picture of participation, liquidity, and risk transfer.
By focusing on US equity index futures rather than cash indices, traders gain visibility into how markets behave outside regular trading hours — often where meaningful positioning occurs. This becomes particularly important when markets are near all-time highs and internal alignment begins to fracture.
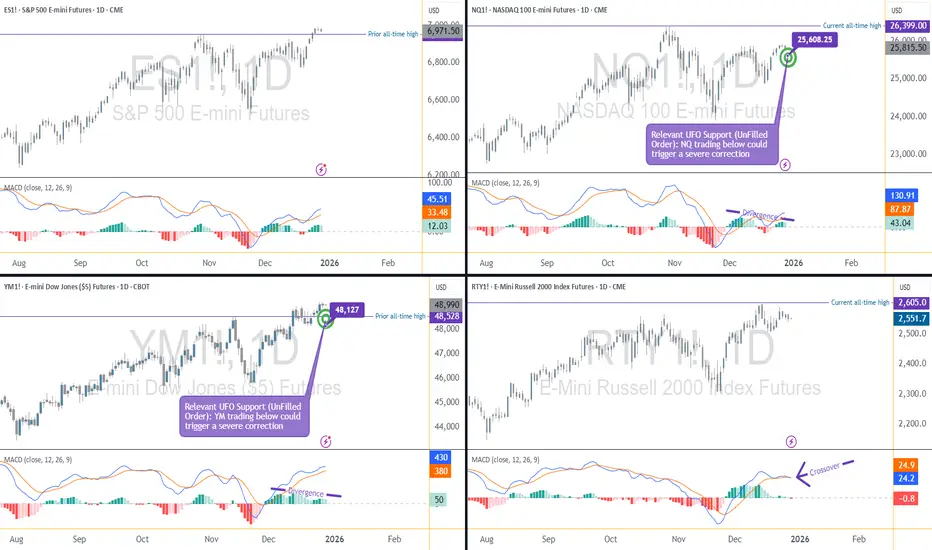
In this analysis, attention is placed on the four most relevant US equity index futures:
E-mini S&P 500 Index Futures (ES)
E-mini NASDAQ 100 Index Futures (NQ)
E-mini Dow Jones Index Futures (YM)
E-mini Russell 2000 Index Futures (RTY)
Together, these markets represent large-cap growth, broad market exposure, industrial and value-oriented components, and small-cap participation. When these indexes move in harmony, trends tend to persist. When they diverge, conditions often become more fragile.
All-Time Highs in Focus: Who Is Leading and Who Is Lagging
A defining characteristic of the current environment is disagreement among indexes, despite elevated price levels.
The E-mini S&P 500 Index Futures (ES) has recently pushed to a new all-time high. This reflects ongoing strength in the broader market and confirms that headline risk appetite remains intact.
In contrast, the E-mini NASDAQ 100 Index Futures (NQ) has failed to confirm this strength. Despite previous leadership, NQ is currently trading below its all-time high. This matters because the NASDAQ is heavily weighted toward technology and growth-related stocks, including those linked to artificial intelligence (AI) — sectors that provided a significant portion of upside momentum throughout 2025.
Meanwhile, the E-mini Dow Jones Index Futures (YM) is trading above its prior all-time high. This is notable because the Dow has a more diversified sector composition and is less concentrated in high-growth technology names. Its relative strength suggests that current market resilience may be coming from areas outside of the technology complex.
Finally, the E-mini Russell 2000 Index Futures (RTY) remains below its all-time high. Small- and mid-cap stocks often act as a confirmation layer for broader economic participation. When large-cap indexes make new highs while small caps lag, it can signal uneven economic traction and rising internal imbalance.
This combination — ES and YM showing strength, while NQ and RTY lag — forms the foundation of the current intermarket tension.
Momentum Evidence: What MACD Is Revealing Across Indexes
Price alone rarely tells the full story near extremes. Momentum indicators, when used correctly, help evaluate the quality of participation behind price movement.
In this case, the MACD indicator reveals important divergences across multiple indexes.
The NQ is displaying a bearish momentum divergence, where price remains elevated but momentum fails to confirm. This suggests that upside participation is narrowing rather than expanding.
The YM — despite being one of the strongest indexes — is also showing a bearish divergence on MACD. This is particularly important because divergences forming in strong markets often precede broader shifts, not because price must reverse immediately, but because momentum strength is no longer accelerating.
The RTY presents the most advanced signal set. It is not only showing a bearish divergence, but also a MACD crossover, which can be interpreted as early-stage downside momentum attempting to assert itself.
The ES, while not currently exhibiting the same degree of momentum weakness, stands increasingly isolated. When leadership narrows to one index, risk becomes asymmetric rather than evenly distributed.
Structural Risk Zones: Interpreting UFO (UnFilled Orders) Support
Momentum divergences alone do not constitute actionable signals. They require structural confirmation.
This is where UFO support and resistance levels (UnFilled Orders) become relevant. UFO zones represent areas where liquidity previously failed to transact fully, often acting as structural support or resistance when revisited.
In the current structure, two UFO support zones stand out due to their proximity to price and their relevance to both the strongest and weakest markets:
NQ: UFO support ending near 25,608.25
YM: UFO support ending near 48,127
These levels are significant because they sit directly beneath current price action. As long as price remains above these zones, structure remains intact despite momentum warnings.
However, a violation of such UFO supports would represent a meaningful shift. It would indicate that buyers previously willing to defend these levels are no longer present, allowing momentum divergences to express themselves more fully.
Conditional Scenarios: What Would Confirm a Broader Risk Shift
Rather than anticipating outcomes, evidence-based analysis focuses on conditions.
From a structural standpoint, bearish scenarios would gain credibility if:
NQ trades below 25,608.25, violating its nearby UFO support
YM trades below 48,127, removing structural support from the strongest index
Weakness emerging simultaneously in both the weakest and strongest indexes would suggest that divergence is resolving through price rather than consolidation. In such a case, broader downside expansion could develop, potentially manifesting as a sharp corrective phase.
Importantly, this framework does not assume that such a move must occur. It simply defines what conditions would matter if they do.
Illustrative Trade Framework (Educational Example Only)
For traders studying downside scenarios, a hypothetical bearish framework could be structured as follows:
Trigger: Confirmed daily close below relevant UFO support
Risk Definition: Invalidation above reclaimed structure
Objective: Next lower structural liquidity zone
Reward-to-Risk: Favorable only if structure breaks decisively
This framework is illustrative and intended solely to demonstrate how structure, momentum, and confirmation can align. It does not imply expectations or outcomes.
E-mini vs. Micro E-mini Contracts
All four equity index futures discussed — ES, NQ, YM, and RTY — are available in both E-mini and Micro E-mini formats. Both versions track the same underlying index and move tick-for-tick together. The difference lies in how risk is expressed.
ES / MES Tick size: 0.25 index points = $12.50 (ES) | $1.25 (MES)
NQ / MNQ Tick size: 0.25 index points = $5.00 (NQ) | $0.50 (MNQ)
YM / MYM Tick size: 1 index point = $5.00 (YM) | $0.50 (MYM)
RTY / M2K Tick size: 0.10 index points = $5.00 (RTY) | $0.50 (M2K)
Across all four indexes, Micro E-mini contracts represent one-tenth of the tick value of their E-mini counterparts.
Margin requirements vary by broker and market conditions. From a structural perspective:
ES / MES required margin = ~$22,500 (ES) | ~$2,250 (MES)
NQ / MNQ required margin = ~$33,500 (NQ) | ~$3,350 (MNQ)
YM / MYM required margin = ~$14,250 (YM) | ~$1,425 (MYM)
RTY / M2K required margin = ~$9,500 (RTY) | ~$950 (M2K)
This difference allows traders to express the same market thesis with far greater precision, especially when working around tight structural levels or conditional triggers.
With momentum divergences developing and key structural zones nearby, position sizing flexibility becomes critical. Micro E-mini contracts make it possible to:
Scale exposure gradually
Reduce concentration risk
Align risk more closely with invalidation levels
The analysis remains identical across E-minis and Micros — only the risk calibration changes.
Risk Management Considerations
Divergences can persist longer than expected, especially in strong trends. Acting without confirmation often leads to premature positioning.
Key principles include:
Waiting for structural validation
Defining risk before engaging
Managing exposure across correlated instruments
Avoiding overconfidence near historical extremes
Markets rarely turn because of opinion. They turn when structure and participation change.
Final Takeaway: Evidence Over Assumptions
As 2025 comes to a close, US equity index futures present a market that is strong on the surface but fractured underneath. Leadership is narrowing, momentum is diverging, and structural levels are increasingly relevant.
Whether these signals resolve through consolidation or correction remains unknown. What matters is that the evidence is now visible — and futures markets provide the clarity needed to observe it.
Data Consideration
When charting futures, the data provided could be delayed. Traders working with the ticker symbols discussed in this idea may prefer to use CME Group real-time data plan on TradingView: www.tradingview.com - This consideration is particularly important for shorter-term traders, whereas it may be less critical for those focused on longer-term trading strategies.
General Disclaimer
The trade ideas presented herein are solely for illustrative purposes forming a part of a case study intended to demonstrate key principles in risk management within the context of the specific market scenarios discussed. These ideas are not to be interpreted as investment recommendations or financial advice. They do not endorse or promote any specific trading strategies, financial products, or services. The information provided is based on data believed to be reliable; however, its accuracy or completeness cannot be guaranteed. Trading in financial markets involves risks, including the potential loss of principal. Each individual should conduct their own research and consult with professional financial advisors before making any investment decisions. The author or publisher of this content bears no responsibility for any actions taken based on the information provided or for any resultant financial or other losses.
ADA Masterclass: Spotting the Perfect TradeHappy New Year, everyone! I hope 2025 is off to a fantastic start for you, filled with success, joy and of course, profitable trades. ADA has been a shining example of technical precision in recent months, offering reliable and rewarding setups. Let’s explore what the charts are telling us as we move forward into the new year.
Market Overview:
ADA has consistently respected key technical levels. Recently, the market completed a perfect ABC correction to the trend-based Fibonacci extension 1:1 at $0.7655, almost to the dollar. Following this correction, ADA has seen a strong rally, now approaching critical resistance levels, while the $1 support zone emerges as a pivotal area.
Key Observations and Levels:
1.) Resistance Zone – $1.079–$1.1108
ADA is approaching the 0.618 Fibonacci retracement of the broader downtrend from $1.3264 to $0.7624, located at $1.1108.
This level is a significant resistance zone, marking a potential turning point where sellers could step in to take control.
2.) Short Trade Idea:
A short trade setup can be executed at $1.1108, targeting the $1 support zone for a potential 8–9% gain.
Trade Setup Details:
Entry: $1.1108
Stop Loss: Above the 0.666 Fibonacci retracement.
Target: $1
Risk-to-Reward Ratio: 3:1
Risk: 2.75%
3.) Support Zone at $1:
The $1 level remains a critical support zone due to multiple confluences:
Psychological significance as a round number.
A single print zone between $1.001–$1.003, indicating a key liquidity area.
Alignment with the 0.382 Fibonacci retracement of the current wave (1st January low to 3rd January high).
Anchored VWAP from the recent lows is also sitting at $1, adding further weight to this level as a strong support zone.
Long Trade Idea:
A long trade can be considered if ADA revisits the $1 support zone, but ensure to wait for volume confirmation to validate buying strength before entering.

NQ Power Range Report with FIB Ext - 1/2/2025 SessionCME_MINI:NQH2025
- PR High: 21320.50
- PR Low: 21243.75
- NZ Spread: 171.75
Key scheduled economic events:
08:30 | Initial Jobless Claims
09:45 | S&P Global US Manufacturing PMI
11:00 | Crude Oil Inventories
Lift back near Tuesday's open
- Possible NYSE vol spikes with economic events to start the year
Session Open Stats (As of 2:15 AM 1/2)
- Weekend Gap: N/A
- Gap 10/30/23 +0.47% (open < 14272)
- Session Open ATR: 375.49
- Volume: 55K
- Open Int: 251K
- Trend Grade: Bull
- From BA ATH: -4.9% (Rounded)
Key Levels (Rounded - Think of these as ranges)
- Long: 22667
- Mid: 21525
- Short: 19814
Keep in mind this is not speculation or a prediction. Only a report of the Power Range with Fib extensions for target hunting. Do your DD! You determine your risk tolerance. You are fully capable of making your own decisions.
BA: Back Adjusted
BuZ/BeZ: Bull Zone / Bear Zone
NZ: Neutral Zone

Happy Crypto New Year 2025! 🎉💰Happy Crypto New Year 2025! 🚀✨💰🎉
As we welcome another exciting year, let’s remember: 🔑 Your crypto wallet is like your toothbrush—keep it safe, private, and never share it! 🪥
🌟 2025 Crypto Resolutions for Success:
1️⃣ DYOR (Do Your Own Research): Before you HODL, read, learn, and understand. 📚
2️⃣ Embrace the DCA (Dollar-Cost Averaging) : Timing the market is tough; consistency is 🔑.
3️⃣ Secure Your Assets : Use hardware wallets and enable 2FA. Don't get rugged this year! 🔒
4️⃣ Stay Updated: Crypto trends change faster than your favorite meme coins’ charts. 📰
🚀 Fun Crypto Fact:
If you invested $10 in Bitcoin in 2010, you’d have over $250 million today. Start small—dream big! 🌌
🎭 Entertaining Thought:
"Crypto is the only market where people panic when prices are low and celebrate when it’s expensive. Let’s flip that mindset in 2025!" 🤔🎉
💡 Pro Tip for the Year:
The next bull run is built in the bear market. Learn, strategize, and prepare—2025 could be your year! 💼📈
To our amazing community:
This year, let’s not just trade—let’s grow, innovate, and dominate. Together, we’ll explore new opportunities in blockchain, NFTs, DeFi, and beyond. 🌍✨
🎊 Here’s to a prosperous, joyful, and crypto-filled New Year! Drop your 2025 crypto goals in the comments! Let’s inspire each other.
💬 #HODL #CryptoNewYear #Blockchain2025

Bitcoin's 2024 Halving to 2025 Peak: Will BTC Reach $294K?📌Historical Observations
- 2012 Halving → 2013 Top:
Duration: ~1 year.
Price increase: ~8,600% (from ~$12 to ~$1,150).
- 2016 Halving → 2017 Top:
Duration: ~1.5 years.
Price increase: ~2,900% (from ~$650 to ~$19,500).
- 2020 Halving → 2021 Top:
Duration: ~1.5 years.
Price increase: ~900% (from ~$8,600 to ~$69,000).
- 2024 Halving → Projected 2025 Top:
Halving price: ~$64,000.
📌Identified Patterns
- Time from Halving to Peak: Peaks occur around 1.33 to 1.5 years after the halving.
- Diminishing Returns: Growth rates decrease with each cycle:
2012 to 2016: ~66% reduction in returns.
2016 to 2020: ~69% reduction in returns.
Expected reduction for 2024 cycle: ~60-70%.
📌Projection for the 2024 Cycle
Duration to Peak:
Add 1.33 to 1.5 years to the halving date (April 2024).
Projected top: June to October 2025.
Price Growth:
Assuming diminishing returns, we estimate 300% to 360% price growth from the halving price.
Next Top Price=Halving Price×(1+Growth Rate)
300% growth: $64,000 × 4 = $256,000.
360% growth: $64,000 × 4.6 = $294,400.
📌Final Projection
Next Bitcoin Peak Price: Estimated between $256,000 and $294,400.
Timing: Likely between June and October 2025.
Here’s to a successful and prosperous trading year ahead! 🎉
You’ve got this! Let’s make 2025 your best trading year yet.
~ Rich

7 Mindset Checks for Trading Success in 2025!Are You Psychologically Ready to Be a Trader? 🎯
As we step into the New Year, it's the perfect time to reflect on whether you're truly prepared to take on the world of trading. Here’s a checklist to assess your mindset and psychological readiness for the challenges ahead.
1️⃣ Do You Get Angry When You Lose?
If you tend to get upset over a lost game or seek revenge, trading might amplify those emotions. With money at stake, it's easy to blame external factors like the news, politics, or distractions for a losing trade.
But here's the truth: losses are part of the process. Successful traders embrace losses as learning opportunities and focus on the next profitable setup instead of dwelling on the past.
Remember: Revenge trading is a trap. The market doesn’t cause losses—you do. Instead of seeking revenge, take responsibility, learn, and move forward.
“The best fighter is never angry.” – Lao Tzu
2️⃣ Do You Think You’re Always Right?
Ego is a trader's biggest enemy. Trading isn’t about being right or wrong—it’s about making money.
If your ego drives your decisions, you might overestimate your abilities, skip your trading plan, and take unnecessary risks. Stay humble and let the market teach you.
Ego-filled traders may call themselves analysts or influencers, but true traders prioritize discipline over arrogance.
3️⃣ Do You Fasten Your Seatbelt Every Time You Drive?
Wearing a seatbelt is a simple yet critical risk management habit. Similarly, in trading, risk management is everything.
Professional traders focus on controlling risk, not chasing rewards. Trading without a stop loss is like driving without a seatbelt—one mistake can ruin everything.
Remember: the market can go anywhere. Be prepared for every outcome.
4️⃣ Are You a Follower?
Successful traders carve their own paths. Blindly copying others’ strategies or trades on social media undermines your independence.
You chose trading to be your own boss—embrace that responsibility. Develop and trust your own trading plan, tailored to your goals, personality, and style.
“If you don’t design your own life plan, chances are you’ll fall into someone else’s plan. And guess what they have planned for you? Not much.” – Jim Rohn
5️⃣ Can You Wait for the Green Traffic Light?
Patience is a cornerstone of trading success. Waiting for the right setup and following your plan with discipline ensures long-term profitability.
Self-discipline isn’t innate—it’s built over time. Commit to your plan, refine your strategy, and trust the process.
“The market pays you to be disciplined.”
6️⃣ Are You Committed to Long-Term Goals?
Just as a long-term relationship or fitness journey requires dedication and focus, so does trading. Jumping from one strategy to another only leads to inconsistency.
If your strategy is profitable, stick with it. Master it. Repetition and consistency turn your strategy into a money machine.
Successful trading is supposed to be boring. Embrace the grind.
7️⃣ Do You Finish Your Popcorn Before the Movie Starts?
If patience isn’t your strength, trading might test you. Most of your time as a trader is spent waiting—for setups, for trades to play out, and for profits to materialize.
“The stock market is a device for transferring money from the impatient to the patient.” – Warren Buffett
📚 The Takeaway
Trading isn’t just about charts and strategies—it’s a test of your psychology, discipline, and patience.
As we welcome the New Year, let’s focus on improving not just our trading skills but also our mindset. A strong foundation in trading psychology leads to better decision-making and long-term success.
Work on your human psychology, develop your risk management, and commit to the journey. Remember, successful traders are made, not born.
Here’s to a successful and prosperous trading year ahead! 🎉
You’ve got this! Let’s make 2025 your best trading year yet.
~ Rich

Trading the Santa Rally: How to Ride the Supposed Year-End SurgeThe Santa Rally — a festive event characterized by silent nights and active markets. Every December, traders whisper about it with a mix of excitement and skepticism. But what exactly is this supposed year-end market surge? Is it a gift from the markets or just a glittery myth? Let’s unwrap the truth.
🎅 What Is the Santa Rally?
The Santa Rally refers to the tendency for stock markets to rise during the last few trading days of December and sometimes even the first few days of January. It’s like a financial advent calendar, but instead of dark chocolate, traders hope for green candles.
The origins of this term aren’t entirely clear, but the event is widely observed. Analysts cite everything from holiday cheer to quarter-end, year-end portfolio adjustments as possible reasons. But beware — like a wrongly wrapped gift, the rally doesn’t always deliver what you expect.
🎄 Fact or Festive Fiction?
The Numbers Don’t Lie (Mostly):
Historical data does show that markets have a knack to perform well during the Santa Rally window. For instance, the S&P 500 SPX has delivered positive returns in about 75% of the observed periods since 1950. That’s better odds than guessing who’s going to win the “Ugly Sweater Contest” at the office.
Not Guaranteed:
However, let’s not confuse correlation with causation. While historical trends are nice to know, the market isn’t obliged to follow tradition. Geopolitical events, Fed decisions, or even a rogue tweet can easily knock this rally off course (especially now with the returning President-elect).
🚀 Why Does the Santa Rally Happen?
1️⃣ Holiday Cheer : Investors, like everyone else, might be more optimistic during the holidays, leading to increased buying momentum. After all, not many things can say “joy to the world” like a bullish portfolio.
2️⃣ Tax-Loss Harvesting : Fund managers sell off losing positions in early December to offset gains for tax purposes. By the end of the month, they’re reinvesting, potentially pushing prices higher.
3️⃣ Low Liquidity : With many big players sipping mezcal espresso martinis on the Amalfi coast, trading volumes drop. Lower liquidity can amplify price movements, making small buying pressure feel like a full-blown rally.
4️⃣ New Year Optimism : Who doesn’t love a fresh start? Many traders sign off for the quarter on a positive, upbeat note and begin setting up positions for the year ahead, adding to upward swings.
⛄️ The Myth-Busting Clause
While these factors seem plausible, not every Santa Rally is a blockbuster. For example, in years of significant economic uncertainty or bearish sentiment, the holiday spirit alone isn’t enough to lift the market.
🌟 How to Trade the Santa Rally (Without Getting Grinched)
1️⃣ Set Realistic Expectations : Don’t expect a moonshot. The Santa Rally is more of a sleigh ride than a rocket launch. Focus on small, tactical trades instead of betting the farm on a rally (and yes, crypto included).
2️⃣ Watch Key Sectors : Historically, consumer discretionary and tech stocks often perform well during this period. Consider these areas, but always do your due diligence.
3️⃣ Manage Your Risk : With low liquidity, volatility can spike unexpectedly. Tighten your stop-losses and avoid overleveraging — Santa doesn’t cover margin calls.
4️⃣ Keep an Eye on Macro Events : Is the Fed hinting at rate cuts (hint: yes it is )? Is inflation stealing the spotlight (hint: yes it is )? These can overshadow any seasonal trends.
☄️ Crypto and Forex: Does Santa Visit Here Too?
The Santa Rally isn’t exclusive to stocks. Forex markets can also see year-end movements as hedge funds, banks and other institutional traders close out currency positions.
Meanwhile, traders in the crypto market have gotten used to living in heightened volatility not just during the holidays but at any time of the year. More recently, Donald Trump’s win was a major catalyst for an absolute beast of an updraft.
🎁 Closing Thoughts: Naughty or Nice?
The Santa Rally is a fascinating mix of tradition, psychology, and market mechanics. While it’s fun to believe in a market jolly, it’s better to stay prepared for anything out of the ordinary.
So, are you betting on a rally this year, or are you staying on the sidelines? Let’s discuss — drop your thoughts in the comments below and tell us how you’re planning to trade the year-end rush! 🎅📈

Happy Rabbit New Year!- Welcome back to 1T Crypto Market Cap.
- Happy Lunar New Year of the Rabbit to everyone !
Happy Tr4Ding !

Gold analysis in 1h time frameHello guys, I hope you are doing well.
You can see the gold chart in the 1-hour time frame.
At the moment, there is no particular movement because it is the Chinese New Year. For now, we are witnessing a low volatility market in the mornings for ten days.
This previous high is still maintained, which is now a resistance level that prevents the price from continuing higher.
Currently, it has reached a 15-minute support zone, which is still valid.
By seeing the signs of growth and candlestick patterns, we can hope that you can have a candle close above this resistance level and there will be no obstacles to advance to reach the 2042-2044 areas.

BTC/USD Bullish movementHello Crypto Enthusiasts,
🚀 Exciting news! Master Chef is back in the kitchen, ready to serve up some piping hot hypotheses on crypto tokens, including potential meme tokens for us all to feast our eyes on! 🍲 Today, let's delve into why BTC is set to soar to new heights.
1.) 📈 EMA Health Check: The 4-hour time frame EMAs are looking fit and fabulous. Could this be the start of a glorious trend continuation? Let's explore!
2.) 🚀 Bullish Pennant Unveiled: Post-recent pump analysis reveals a promising bullish pennant formation. Buckle up for potential upward swings!
3.) 🌕 Bullish Moon Vibes: Riding the wave of a bullish moon cycle. The stars (and the moon) are aligning for a probable continuation of the upward trend.
Hold on to your seats, as my next post and surprise live video session won't just be about the crypto classics. I've got my eyes on a mysterious meme token that has captured my interest. 🕵️♂️
Tap that ❤️ and hit the share button if you're hungry for more insights and want me to uncover a hidden gem in my upcoming posts.
Let's cook up some crypto magic together! 🔮✨ #CryptoMagic #BitcoinRising #HiddenGems 🚀🌙

happy new year 2024✨(BTC)❤️❤️Thanks for boosting 🚀 and supporting us!
📈First idea (signal) in new years
📊 (Entry) : 43225
🔴 Stop Loss : 43707
🎯 Take Profit : 42828-42437-42103-41688
🔗 For more communication with us, In the footnote and send a message in TradingView.
👨🎓 Experience and Education: Our trading team has five years of experience in financial markets, especially cryptocurrencies.

BULLISH EURUSDEURUSD looks bullish for todays london and new york session. Targets are slightly below the 1.10 level. Stops below asia low at 1.0910. Use proper risk management.

Insights into Bitcoin Futures as 2024 brings new regulations inIntroduction to Bitcoin Futures
Bitcoin Futures represent a significant intersection of traditional financial markets and the innovative world of cryptocurrencies. They allow traders to speculate on the future price of Bitcoin, providing a way to hedge against price volatility or to profit from price movements. As we step into 2024, the potential approval of spot Bitcoin ETFs is poised to further transform the landscape for Bitcoin Futures.
The Impact of Spot Bitcoin ETF Approval
Spot Bitcoin ETFs are directly tied to the current price of Bitcoin (spot price). Their likely potential approval by U.S. regulators could have substantial implications for the Bitcoin market. Firstly, it's expected to increase market liquidity by providing an accessible avenue for traditional investors to enter the cryptocurrency space. Secondly, it could lead to greater price stability and potentially higher prices due to increased demand. However, it's also important to consider the potential risks, such as amplified market reactions to regulatory news and changes in the underlying asset.
Parallel Analysis of Other ETFs
To understand the potential impact of a Bitcoin ETF, it's instructive to look at the introduction of other commodity and currency-based ETFs:
GLD (Gold ETF): Following the introduction of GLD, which is linked to COMEX Gold Futures (GC), the gold market saw increased liquidity and interest from new investor segments, contributing to significant price rallies.
GLD Performance Chart
SLV (Silver ETF): Similar to GLD, the introduction of SLV, linked to COMEX Silver Futures (SI), led to increased investor participation and price movements in the silver market.
SLV Performance Chart
FXE (Euro ETF): Linked to CME Euro Futures, FXE provided investors an easy way to gain exposure to euro currency movements, affecting trading volumes and price volatility.
FXE Performance Chart
USO (WTI Crude Oil ETF): Tied to NYMEX WTI Crude Oil Futures, USO's introduction affected the oil market by providing more access and potentially contributing to price movements during significant market events.
USO Performance Chart
Historical Implications for Bitcoin
The history of these ETFs suggests a pattern: the introduction of an ETF could lead to increased market participation and, often, significant price movements. For Bitcoin, the approval of a spot ETF could similarly increase market participation and price volatility, at least in the short term. Over the long term, it could help stabilize and mature the market as more institutional investors get involved.
Forward-Looking Insights
Given the potential approval of spot Bitcoin ETFs, traders and investors in Bitcoin Futures might expect several scenarios. An immediate increase in volatility could be likely as the market adjusts to the influx of new participants. Over time, we might see a more liquid and stable Bitcoin market.
Planning for a Risk-Defined BTC Opportunity:
Risk Management : Experienced traders prioritize risk management. Using stop-loss orders or hedging techniques is imperative to avoid undefined risk exposure.
Precision in Entries and Exits : Aligning entries and exits with relevant market price levels can help manage risk. When a price point generates a bounce, the trader stays in the trade; if a price level is violated, the disciplined action is to exit the trade promptly for a predetermined loss.
Relevant Price Levels for BTC : Currently, BTC shows relevant resistance levels starting at 51,585 and support between 39,640-34,295.
Proposed Trade Plan:
ENTRY: 39,640
STOP-LOSS: 34,295
TAKE PROFIT TARGET: 51,585
This trade plan offers a 2.23 Reward-To-Risk ratio, providing a structured approach to capitalizing on potential market movements.
In order to manage risk and use the right contract size, traders need to take into consideration the Point Value for BTC Futures being $25 per point.
Traders should prepare for both the opportunities and risks this change could bring, considering strategies that allow flexibility and risk management.
Conclusion
The potential approval of spot Bitcoin ETFs in 2024 is set to make waves in the Bitcoin Futures market. Drawing parallels from the history of other ETFs, we anticipate increased market participation and potential price movements. As we navigate this evolving landscape, staying informed and adaptable will be key to capitalizing on the opportunities and navigating the challenges ahead.
When charting futures, the data provided could be delayed. Traders working with the ticker symbols discussed in this idea may prefer to use CME Group real-time data plan on TradingView: www.tradingview.com This consideration is particularly important for shorter-term traders, whereas it may be less critical for those focused on longer-term trading strategies.
General Disclaimer:
The trade ideas presented herein are solely for illustrative purposes, forming a part of a case study intended to demonstrate key principles in risk management within the context of the specific market scenarios discussed. These ideas are not to be interpreted as investment recommendations or financial advice. They do not endorse or promote any specific trading strategies, financial products, or services. The information provided is based on data believed to be reliable; however, its accuracy or completeness cannot be guaranteed. Trading in financial markets involves risks, including the potential loss of principal. Each individual should conduct their own research and consult with professional financial advisors before making any investment decisions. The author or publisher of this content bears no responsibility for any actions taken based on the information provided or for any resultant financial or other losses.

Happy Holidays and Happy New Year! ❄️
Dear traders,
This year:
☃️ I shared with you 1200+ forecasts, signals and analysis posts.
🎄 I did 25+ live trading sessions,
🔴 I wrote 50+ educational articles,
❄️ I recorded 70+ educational videos.
Thank you so much for supporting my work,
thank you for great feedbacks and reviews.
Thank you for your participation in live sessions and your involvement.❤️
I promise to do even better next year.
Happy New Year, traders!
All the best!✨

Essential Overview of Current Gold Market TrendsGold prices are finding demand in the last trading session of the year during the Asian market, amidst cautiously optimistic market sentiment and the recent weakness of the US dollar. Investors are gearing up for the year-end flow and refraining from placing any new directional bets on gold prices, keeping the precious metal in a consolidating phase around $2,070.
In the coming days, risk sentiment, USD movements, and profit-taking actions could significantly impact gold prices as traders shift to the sidelines ahead of the extended Lunar New Year weekend.
On Thursday, gold prices experienced two-way trading activity, initially making a fresh three-week high before stabilizing below the $2,070 level. In the first half of the day, gold benefited from the prolonged weakness of the US dollar and subdued yields on US Treasury bonds, as strong US bond auctions and the Federal Reserve's mild interest rate hike expectations supported the metal.
However, the US dollar made a robust recovery from its yearly lows against its major counterparts, aided by the modest increase in US Treasury bond yields. Traders employed profit-taking measures against shorting the US dollar in thinner liquidity conditions on Friday.
Investors shrugged off mixed economic data from the US, allowing the US dollar to breathe a sigh of relief. The pending home sales index in the US, a forward-looking indicator based on signed contracts rather than closings, declined by 5.2% compared to a year ago, as reported by the National Association of Realtors. Meanwhile, the US Department of Labor revealed that state unemployment claims increased by 12,000 in the previous week to 218,000.
In summary, the gold market is witnessing fluctuations driven by varying factors such as USD movements, risk sentiment, and economic data. As the year comes to a close, investors remain watchful, and the gold prices may experience further adjustments in response to changing market dynamics.
Wishing you a happy new year
Best regards !

Unlocking 2024: New Year Resolutions for Traders 📊🎉Hello TradingView Family, this is Richard, and I want to wish you all a Happy New Year.
As we embark on a fresh trading journey in 2024, let's commit to success. Here are six trading dos and don'ts to guide us to a prosperous year ahead! 🌟 #NewYearNewTrades
📌Dos:
------
💹 Quantum Leap Mastery: Elevate your trading game with quantum computing finesse. Delve into the quantum frontier to revolutionize your analytical prowess and stay ahead of market dynamics.
🌊 Zen Trader Mindset: Infuse mindfulness into your trading routine. Meditate to sharpen focus, maintain emotional balance, and cultivate the calm needed to navigate the stormy seas of the financial markets.
🌱 Green Investment Oasis: Transform your portfolio into an eco-friendly haven. Invest in sustainable enterprises, aligning your financial goals with a commitment to a greener and socially responsible future.
💪 Crypto Gym Workout: Treat cryptocurrencies like a dynamic workout. Regularly flex your knowledge muscles to keep up with the ever-evolving crypto landscape. Adapt and incorporate new technologies and tokens into your trading regimen.
🤖 AI Symbiosis Champion: Embrace artificial intelligence as your trading ally. Master the art of synergizing human intuition with cutting-edge machine learning models to make informed decisions in the ever-evolving financial landscape.
🌐 Global Macro Maestro: Become a maestro of global macroeconomics. Develop a nuanced understanding of geopolitical events, economic policies, and their impact on markets. Let your trading decisions resonate with a symphony of global financial insights.
📌Don'ts:
------
💢 FOMO Detox Retreat : Break free from the fear of missing out. Establish a disciplined approach and resist impulsive trading decisions fueled by market hype. Not every trend is a golden opportunity; discernment is key.
⏪ Overleveraging Rehab: Embark on a journey of overleveraging detox. Opt for a risk management strategy that preserves your investments. Shun the allure of excessive leverage and prioritize the long-term health of your portfolio.
📵 Influencer Mirage Avoidance: Don't let social media influencers dictate your trades. Filter out the noise and focus on fundamental analysis. Flashy social media posts don't always translate to sound investment advice.
🔄 Prediction Addiction Intervention: Break the cycle of prediction addiction. Acknowledge the unpredictability of markets and cultivate adaptability. Develop a flexible strategy that thrives in the face of unexpected events.
⚖️ News Overdose Balance: Maintain a healthy news consumption diet. While staying informed is crucial, too much news can lead to information overload. Choose reliable sources, strike a balance, and avoid unnecessary stress in your trading journey.
🚫 Hype Bubble Avoidance: Steer clear of hype bubbles. Be it in stocks, cryptocurrencies, or emerging markets, exercise caution and perform thorough due diligence. Prudent decision-making beats riding speculative waves.
💼 May your 2024 trading journey be a symphony of strategic brilliance and disciplined.
📚 Always adhere to your trading plan, including entry points, risk management, and trade management.
Happy New Year Everyone 🎊
~Richard Nasr

🔥 XAU/USD - 2023 is Ending , Ready for 2024 ?We are approaching the last days of the year and soon the annual gold candle will be closed! Last year, the lowest price of gold (Low) was $1,614 and the highest price (High) was $2,070, but finally the 12-month or one-year candle closed at $1,823! In 2023, the price of gold recorded the lowest price (Low) of $1804 and managed to record the highest historical price (ATH) by reaching the price of $2146! At the moment that I am writing this to you, gold is trading in the range of $2070 And I would like you to tell me what price you think gold will close in the next 2 days and 8 hours, and share your prediction of the possible trend of gold in 2024 in the comment section below !
Please share your opinion about the possible trend of this chart with me and support us with your likes and comments.
Best Regards , Arman Shaban

xauusd dancig around 2050 znoeGold is fluctuating in a sideway cycle in the last days of the 2023 year and will close the candle of the year tomorrow on 2070 or a little lower.
A suitable position for fluctuation has been created, which can be purchased until the ceiling of 2083 and 2086.
i'm going to get long position.
