NFLX 2H Chart – Bullish Breakout with 4.68:1 RRR Trade SetupTicker: NFLX (Netflix, Inc.)
Timeframe: 2-hour
Current Price: $1,210.44
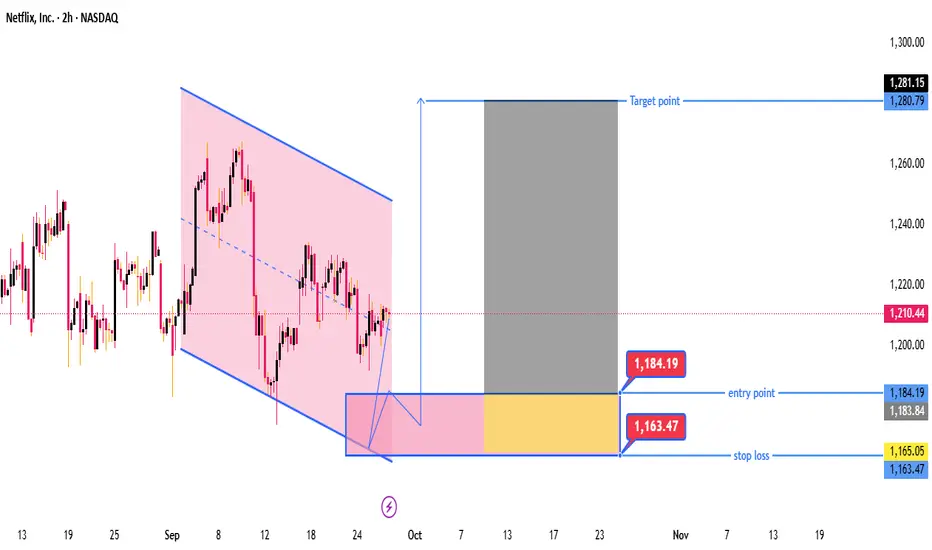
Trend: Price was moving in a downward channel (pink shaded area), but there's a potential breakout forming to the upside.
📉 Pattern Recognition
A falling channel is drawn (marked in pink).
The price appears to have broken out of this falling channel or is testing the breakout.
A bullish reversal is suggested, as there's a highlighted buy zone below the current price.
💡 Trade Setup
Element Value Description
Entry Point $1,184.19 Suggested buy zone
Stop Loss $1,163.47 Risk management level
Target Point $1,281.15 Projected upside target
🟨 Entry Zone
The blue box around $1,184.19 represents a demand zone (possible retracement buy area).
Yellow shaded area = refined zone of interest for buyers.
🟥 Stop Loss Zone
Stop loss below the demand zone, set at $1,163.47 (just below support structure).
Provides cushion against false breakouts.
🟦 Target Zone
Projected target at $1,281.15, aligned with previous resistance or measured move.
Expecting a trend continuation after the breakout.
⚖️ Risk-to-Reward Ratio (RRR)
Entry: $1,184.19
Stop: $1,163.47
Target: $1,281.15
Risk: $1,184.19 - $1,163.47 = $20.72
Reward: $1,281.15 - $1,184.19 = $96.96
📈 RRR ≈ 4.68:1 — very favorable.
🧠 Conclusion
This chart suggests a bullish breakout trade setup on Netflix.
The trade is designed to capitalize on the breakout from a downward channel.
High risk-to-reward setup.
Wait for price action confirmation in the entry zone before initiating a trade.
Watch for volume and overall market sentiment to confirm the breakout strength.
Nflxidea
Netflix Options Flash Green – $1170 Target in Sight?
## 🚨 NFLX Options Alert: Quiet Volume, Loud Calls 🚨
**Earnings Loom, Institutions Lean Bullish** 💥
🔹 **Models Align:** 4 out of 5 models flash *Moderate Bullish*
🔹 **RSI**: Daily (35.6) cooling off, Weekly (56.1) still rising
🔹 **Call/Put Ratio**: 1.47 → Bullish positioning building
🔹 **VIX**: At 17.9, IV environment favors options buyers
🔹 **Volume Weakness**: Institution hesitation = key risk
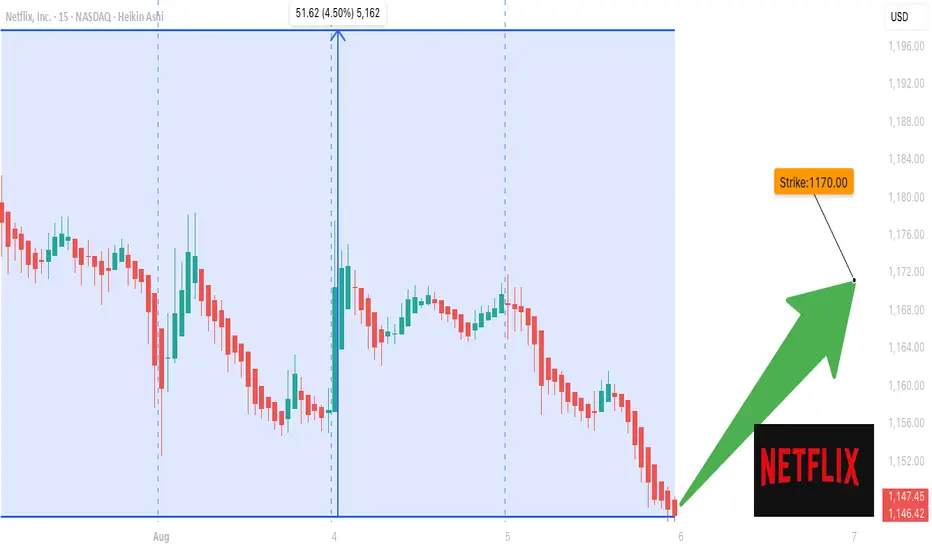
### 📈 TRADE IDEA:
🎯 **NFLX \$1170 Call**
💵 Entry: \$11.80 | 🎯 Target: \$17.70 | 🛑 Stop: \$4.70
📆 Expiry: 2025-08-08 | ⚖️ Confidence: 65%
💡 *Enter at market open. Position size small. Event risk high.*
> “Volume is low, but flow is glowing.”
> Could this be *the* earnings week breakout?
---
### 🏷 Hashtags for Viral Reach:
`#NFLX #OptionsFlow #EarningsTrade #TechStocks #UnusualOptionsActivity #Netflix #TradingSignals #CallOptions #WeeklySetup #TradingViewIdeas`
NFLX Wait For Break Out Fibo Level
## 📈 \ NASDAQ:NFLX WEEKLY TRADE IDEA (AUG 5–9)
**🔥 BULLISH FLOW | CALL/PUT RATIO: 1.84 | CONFIDENCE: 65%**
---
### 🧠 AI-DRIVEN SENTIMENT
* **Weekly RSI**: 54.9 ✅ (Bullish Momentum)
* **Daily RSI**: 38.4 ↗️ (Climbing but still weak)
* **Volume**: 📉 0.7x last week = Low institutional follow-through
* **Options Flow**: Massive call buying = Institutions lean bullish
* **Volatility**: VIX at 18.2 = Option-friendly zone
---
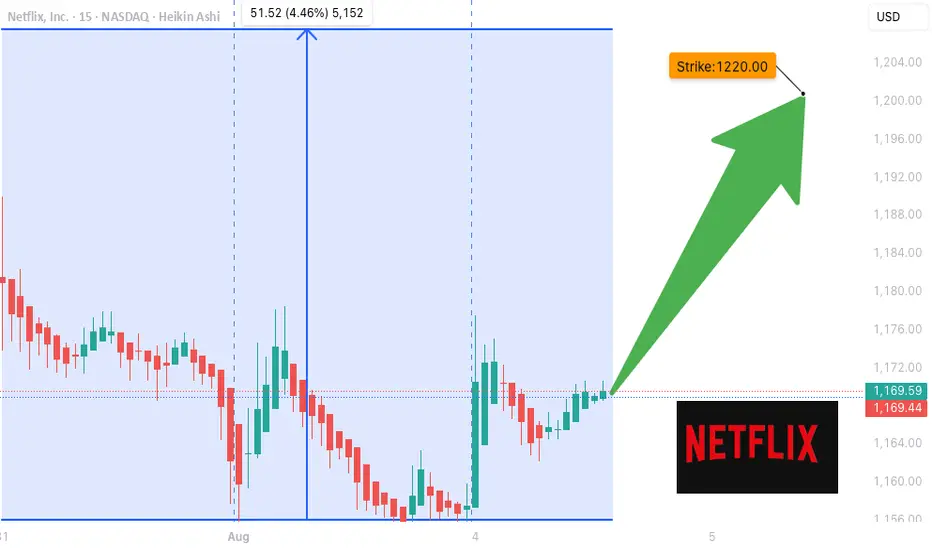
### 🛠️ TRADE SETUP
| 🔹 | Trade Type | Long Call |
| -- | --------------- | ------------------- |
| 🎯 | **Strike** | **\$1200** |
| 📅 | **Expiry** | **Aug 8 (Fri)** |
| 💵 | **Entry** | **\$4.05** |
| 📈 | **Target** | **\$6.00 – \$8.00** |
| 🛑 | **Stop** | **\$2.50** |
| 🔐 | **Size** | 1 contract |
| ⚖️ | **Risk/Reward** | \~1:2 |
---
### ⚠️ RISK CHECK
* 🔸 Daily RSI still < 45 — needs breakout for full confirmation
* 🔸 Volume not convincing — watch for fakeouts
* 🔸 Short expiry = 🔥 gamma risk
---
### 🧩 STRATEGY INSIGHT
> "Call buyers are in. RSI is rising. But volume is soft. You’re early — not late."
🎯 Enter @ Open
🚀 Target quick momentum pop
👀 Exit if RSI fails to break or macro hits
---
💬 **Plan to enter?** Comment “IN”
🔁 Repost if you're tracking NFLX
📊 Follow for more AI-synced trades
NFLX Time To Buyafter the rejection of the price at the level of the golden zone of the Fibonacci between 50 and 61 with an engufling candle we will see an increase in the price

NETFLIX(NFLX) FUTURE PREDICTIONTechnical Analysis Summary (POLKADOT)
NTFX/USDT
TREND ANALYSIS
We have 3 upwardtrend which is currently active in green.
The wider the trend the longer it is respected.
FUTURE PREDICTIONS
We have to keep respecting and holding new weekly levels and maintaning the trend to keep moving upward.
ALL THE GREEN SUPPORT LEVELS SHOW HOW NETFLEX KEPT LADDERING AND RESPECTING NEW AND HIGHER WEEKLY LEVELS AND CREATING TIGHTER TRENDS.
Good luck everyone, stay safe!
If you need help don't hesitate to send me a message or comment
Trading Involves High Risk
Not Financial Advice
Exercise Proper Risk Management

NFLX 1W Is the price of $860 per share real in the near future?Today, we will write down our expectations regarding the value of Netflix shares in the future, as well as a little bit tackle of the history of the company's development.
If you love reading business literature to inspire yourself for future achievements, then we strongly recommend that you read the story of "getting on your feet" once a small company Netflix that has been renting and selling VSH cassettes and DVDs by mail since 1997.
One year after founding, the owners stopped selling VSH and DVDs to focus on the initial idea of renting discs and cassettes.
Their entire history is based on the "super flexibility" of executives who sensed the future trend of their market and acted ahead of the curve.
Here's an example of how a small then Netflix beat the giant of their segment — Blockbuster
The heyday of Blockbuster dates back to 2004, when the company employed about 60 thousand people, and the company owned 9 thousand points of rent and stores. In the late 2000s, Blockbuster faced strong competition from online video service Netflix and filed for bankruptcy in 2010.
Meanwhile, Netflix has expanded its business since 2007 by introducing online media streaming, while not closing the DVD and Blu-ray rentals.
Since 2010, the company has expanded from the United States and expanded internationally.
And since 2013, Netflix has entered the industry of its own content with the debut of its first series.
Now, there are plenty of competitors to Netflix, and we all know them and use their services, but the price of NFLX shares confirms their strength in the market.
If you narrow the chart, you will see that the NFLX share price has been moving in a dynamic channel upward since 2004.
In 2012, the share price bounced off the lower boundary of the channel and t he $8 mark and began an upward trend that continues to this day.
In February-March 2020, when the entire market fell by 30-35%, or even more, NFLX shares fell in value only by -26%
However, the CoviD crisis was good for the company. Everyone sitted home and bought subscriptions to their services, and Netflix's stock doubled.
In fact, for the last 12 months, the price of NFLX shares has been in consolidation in the corridor of $475-575
Trading volumes are decreasing, which means that in the near future, the price will have a strong impulse.
There is a high probability that the momentum will be up , the price will break up and consolidate above $575 , and the next target from above will be $860 per NFLX share.
An alternative scenario is a fall in the NFLX price to the $275-325 zone. This scenario will activate when the price breaks and consolidates below $475 , and the first bell that it is worth refraining from longs will be the price approaching $500.

Netflix Inc. analysis📈NFLX LONG D1
🛒BUY above = 494.30
🎯Target1 = 503.70
🎯Target2 = 509.50
🎯Target2 = 518.95
🛑Trailing Stop loss = 479
❌Cancel trade = 479
🙈Recommended risk = 1-2%
#NFLX #NFLXLONG #BUYNFLX
📉NFLX SHORT D1
🛒SELL BELOW = 479
🎯Target1 = 467.85
🎯Target2 = 460.95
🎯Target3 =
🛑Trailing Stop loss = 494.95
❌Cancel trade = 494.95
🙈Recommended risk = 3-5%
#NFLXSHORT #NFLXSELL

NFLX LONG SET UP (NETFLIX)TITLE/(DATE)- BUY NFLX/USD
ASSET- STOCK
PLATFORM-MT4
ORDER TYPE- BUY Market
Time Frame-4hr
ENTRY PRICE 1- $475.50 ✅ market
ENTRY 2- $468.50
STOP LOSS- $465.50(100 PIPs)
TAKE PROFIT 1-$485.50 (100PIPS)
TAKE PROFIT 2- $495.50(200 PIPS)
TAKE PROFIT 3- $505.50 (300 PIPS)
TAKE PROFIT 4- $525.50 (500 PIPS)
TAKE PROFIT 5- $545.60 (700 PIPS)
STATUS: Active

NFLX LONG SET UP (Netflix)TITLE/(DATE)- NFLX/USD (7/16)
ASSET- STOCK
PLATFORM-MT4
ORDER TYPE- BUY LIMIT
Time Frame-4hr
ENTRY PRICE 1- $478.50 (pending)
ENTRY 2- $471.50 (pending)
STOP LOSS- $468.50(100 PIPs)
TAKE PROFIT 1-$488.50 (100 PIPS)
TAKE PROFIT 2- $498.50(200 PIPS)
TAKE PROFIT 3- $508.50 (300 PIPS)
TAKE PROFIT 4- $528.50 (500 PIPS)
TAKE PROFIT 5- $548.50 (700 PIPS)
TAKE PROFIT 6- $568.50 (900 PIPS)
STATUS: Pending
