Gold breaks 4500 as confidence in US data gets testedUS jobs data for December delivered a messy, two-way market reaction.
According to the Bureau of Labor Statistics, total nonfarm payrolls rose by 50,000 in December. On its own, that headline looks like an economy that is still adding jobs, but at a very slow pace.
Although, prior months were also revised down, including November to 56,000 from 64,000, and October to -105,000 from -173,000.
Gold pushing through the 4,500 level has added to the sense that markets are struggling to settle on a clean interpretation of the data.
Beyond the payrolls report, reporting in Japan has pointed to a possible snap election in February 2026, which can matter for yen pricing.
Nfp

Post NFP thoughts: Below forecast jobs created and a below forecast unemployment number encapsulates the current 'low hire / low fire' environment. And made it difficult to have conviction in the dollars direction. And the initial weakness quickly faded.
NFP is much more tradable when all the data under the bonnet aligns.
The mooted supreme court tariff decision never came, it looks like it could be announced next week.
Sentiment for the JPY remains subdued despite rate hike speculation. This week's squabble with china and now political uncertainty keeps my mind towards potential JPY short trades.
Aside from JPY shorts, it's a case of waiting for a fresh catalyst, ideally from a data release, notably US CPI could be quite significant next week.
Wishing you lovely weekend.

THE KOG REPORT - NFPTHE KOG REPORT – NFP
This is our view for NFP, please do your own research and analysis to make an informed decision on the markets. It is not recommended you try to trade the event if you have less than 6 months trading experience and have a trusted risk strategy in place. The markets are extremely volatile, and these events can cause aggressive swings in price.
After the week we’ve had in Camelot I wouldn’t want to ruin the stats by getting involved in an NFP move that looks like it can go either way. We’re in a small range so a breakout is very likely and the move is likely to be extreme.
I have a bias level of 4490 which needs to break upside and 4470 which needs to break downside. We still have the opening gap from earlier in the week which a lot of traders have been chasing while the market has been stretching. Sentiment isn’t convincing at the moment so a push down is on the cards but is this forming a swing to attempt one more high again?
For the above reason, we’ll look at the red boxes above or below discounting the immediate ones and the potential range. We’ll monitor the higher ones for RIPs and potential reversals, and the lower ones for tap and bounces for the scalps.
RED BOXES:
Break above 4490 for 4501, 4509 and 4520 in extension of the move
Break below 4470 for 4459, 4453, 4442 and 4437 in extension of the move
Please do support us by hitting the like button, leaving a comment, and giving us a follow. We’ve been doing this for a long time now providing traders with in-depth free analysis on Gold, so your likes and comments are very much appreciated.
As always, trade safe.
KOG

GOLD NFPGold Buy @ 4472.540
TP1 : 4473.848
TP2 : 4474.903
TP3 : 4476.437
TP4 : 4480.355
SL : 4459.778
(Trail stop and adjust when necessary)
EXPECTED DIRECTION - (UP/BUY)

EURYEN PROFIT Eurjpy absolutely smashed (TAKE PROFIT) will be posting more trades to take and today as it’s ( NFP )
NFP EXPECTED DIRECTION - (UP / BUY)

EURUSD: bearish view before NFP🛠 Technical Analysis: On the H4 chart, EURUSD has broken below the rising support line, turning the recent upswing into a local bearish setup. Price is now trading under the key moving-average cluster (SMA50/100 around 1.1714–1.1735) with the SMA200 near 1.1690 acting as additional overhead resistance. The current zone around 1.1646–1.1631 is an important support area, and a confirmed breakdown would validate continuation to the next demand level. The primary downside target is the marked support at 1.15491.
———————————————
❗️ Trade Parameters (SELL)
———————————————
➡️ Entry Point: Sell when the 1.16440 support zone is broken (approx. 1.16300)
🎯 Take Profit: 1.15491
🔴 Stop Loss: 1.16851
⚠️ Disclaimer: This is a potential trade idea based on current analysis; market conditions and price direction are subject to change based on news factors and volatility.

USD/CAD Comes Back to LifeComing into 2025 it seemed like USD bulls had full control of the FX market, but the Dollar set a high less than two weeks into the New Year and then weakness remained for pretty much the rest of the year. Of course, much of that weakness was confined the first-half of 2025, but another bearish run in December made it really easy to come into 2026 as a USD bear and so far in the New Year we've seen bullish price action in the DXY.
This puts a lot of focus into U.S. data with tomorrow's Non-farm Payrolls report and then inflation reports to be released thereafter, and what we're seeing now could simply be a degree of squaring up ahead of some big risk events, but in the USD/CAD pair, a strong sell-off has since led to a sizable rally with the pair continuing to show gains.
Notably, it was the oversold reading on the daily chart in late 2025 trade that led into the move and the question now is whether there's the making of a trend in here. Price is already testing a spot of resistance just inside of the 1.3900 handle and the 1.4000 level is a massive spot, if it does come into play. So chasing from here can be challenging, but, there's now bullish structure that can be worked with down to an upward-sloping trendline that's developed in the early stages of the rally.
I'm tracking supports at 1.3836, 1.3800 and then the zone from 1.3743-1.3750 as an 's3' of sorts. If sellers can elicit a closed body break below 's3' it's going to look like the rally is done for but, until that scenario, there's bullish potential for a re-test of the 1.4000 handle.
If 1.4000 trades before any of those supports come into play, then current resistance becomes the new 's1' area of support and that spans from 1.3889-1.3905. - js

Fundamental Note: EURUSD 07 Jan 2026EURUSD is trading around the 1.17 area as markets position for the first Non-Farm Payrolls release of 2026 on Friday, 9 Jan (Employment Situation for Dec 2025). This print matters more than usual because it’s the year’s first “reality check” on whether the late-2025 slowdown in hiring is turning into a softer trend (supporting more Fed cuts) or stabilizing (supporting USD via higher yields). Right now, consensus expectations lean toward a modest jobs gain in the mid-50k to ~60k range, with unemployment seen near 4.5% and wage growth watched closely for a rebound risk. In the short term, a weaker NFP and/or softer earnings would likely push US yields and the USD lower, giving EURUSD room to squeeze back toward recent highs; a hot wages surprise or upside payroll miss could quickly flip the move into a USD rebound. On the Euro side, easing inflation keeps the ECB comfortable in its “hold” stance, which reduces near-term EUR policy volatility versus the US data-driven repricing this week.
Bottom line: the market is mostly looking for a “soft-but-not-breaking” NFP that validates expectations for further Fed easing in 2026—any big deviation should produce an outsized EURUSD reaction.
🟢 Bullish factors:
1. NFP downside surprise or softer wages → lower US yields/USD.
2. Market still broadly positioned for additional Fed cuts in 2026.
3. ECB “on hold” narrative reduces euro-side policy shock risk near-term.
🔴 Bearish factors:
1. Strong NFP and/or hot wage growth → higher US yields, USD bid.
2. Risk-off flows (or renewed geopolitical stress) typically favor USD liquidity.
3. Euro inflation cooling can revive future ECB cut discussions if growth fades.
🎯 Expected targets: Volatile range into/through NFP. Base case (soft NFP): upside toward 1.1750–1.1820. Hawkish surprise (strong jobs/wages): pullback toward 1.1600–1.1550, with 1.1500 as the next downside area if the USD rally extends.

Silver fail to break the record highSilver prices recently surged as escalating geopolitical risks between the US and Venezuela prompted a flight to safe-haven assets. Concurrently, a persistent supply deficit remains a primary concern while industrial demand from the solar PV, EV, and physical investment sectors has accelerated amid structural supply constraints. Expectations that the Fed may implement additional rate cuts in 2026 provide further upside momentum for silver prices.
We now see that XAGUSD has a high correlation with XAUUSD within a 6-month period, at 0.98, but with higher volatility, indicating a higher risk and return. Besides, the incoming NFP tomorrow could heighten volatility due to the surprise of new employment hires, which are expected to increase by 65k in Dec 2025.
Technically, the XAGUSD broke below the EMA21 and traded between both EMAs, signaling consolidation, but remained in the uptrend.
If the price breaks above the EMA21 at 77.5, it could encounter resistance around the last swing high at 81.5. This scenario could be triggered by the weak NFP or an increase in the unemployment rate.
Inversely, price could break below the 75.00 to find support at the 70.57 level.
By Van Ha Trinh - Financial Market Strategist at Exness

Gold surges 2.75% on Venezuela, weak dollar! Eyes on new recordsGold has surged 2.75% on Monday and continues higher on Tuesday, now trading around $4,465 and eyeing a retest of record highs at $4,550. This rally is fuelled by Venezuelan tensions, a weaker US dollar, and soft manufacturing data—but is this a breakout or a trap before NFP?
We analyse why the weaker dollar—not pure safe-haven demand—is the dominant driver, as both gold and stocks are rallying together. We then map out the critical Fibonacci levels that will determine whether gold breaks to new highs or corrects back toward $4,400.
Key drivers
- Venezuela tensions & dovish Fed : Gold got a safe-haven bid following Trump's aggressive stance on Venezuela, but the real driver is dollar weakness after Fed Governor Kashkari's dovish comments about slow disinflation and rising unemployment risks.
- Weak Manufacturing PMI : US ISM PMI dropped to 47.9 from 48.4 expected, reinforcing the soft-landing narrative and pushing the dollar lower.
- Dead Cat Bounce invalidated : Price has broken above both the 50% and 61.8% Fibonacci retracements ($4,447), invalidating the bearish "dead cat bounce" scenario that suggested another leg down.
- Upside targets : The immediate hurdle is the 78.6% Fib at $4,490. A break here strongly suggests new record highs toward $4,550 before the NFP report on January 9. Above that, $4,600 and $4,750 are psychological targets.
- Downside risks : Key support is the weekly open at $4,430 (or gap fill at $4,455). A breakdown below the 50% Fib at $4,412 would shift sentiment bearish and open the door to deeper corrections.
- NFP wildcard : Markets are cautious heading into Thursday's jobs report. A weak NFP could fuel another leg higher, while a strong print may trigger profit-taking.
Are you buying the breakout toward $4,550 or waiting for a pullback? Share your gold strategy in the comments and follow for NFP coverage later this week.
This content is not directed to residents of the EU or UK. Any opinions, news, research, analyses, prices or other information contained on this website is provided as general market commentary and does not constitute investment advice. ThinkMarkets will not accept liability for any loss or damage including, without limitation, to any loss of profit which may arise directly or indirectly from use of or reliance on such information.

NFPUSDT UPDATE#NFP
UPDATE
NFP Technical Setup
Pattern: Falling Wedge Pattern
Current Price: 0.0257$
Target Price: 0.0330$
Target % Gain: 146.48%
Technical Analysis: NFP is breaking out of a falling wedge pattern on the 1D chart, signaling a bullish reversal setup. Price has successfully pushed above the upper wedge resistance after a prolonged downtrend, indicating strengthening momentum. The measured move target aligns with the prior range high, suggesting strong upside potential if volume continues to support the breakout.
Time Frame: 1D
Risk Management Tip: Always use proper risk management.

Maintaining purchases at the turn of the yearThe market has perfectly worked out the scenario outlined in the last review, and buyer activity is growing. We are approaching the end of the year, and we will consider the near-term prospects. On average, the market consolidated in anticipation of determining the opening level of a new annual candle for ETH and BTC. As I expected, ETH opened the second half of the month in the neutral zone, which smooths out sales. There is also a strong bullish signal for a retest of 3500. BTC has reached strong medium-term support around 85k, from which the probability of a rollback to a retest of 100k prevails, which I described in the last review. We have already seen one pullback, but there is still a possibility of an attempt to break through 100k after the opening of a new annual candle. Against the background of preparations for a new wave of purchases at the beginning of the year and the struggle for the closing level of the year, the probability of a new test of the range of 3100-3500 ETH prevails.
A pullback in brent with consolidation above $ 60 also inspires optimism among buyers. If the year opens above this level, a very rapid reaction of the cryptocurrency market with a large wave of purchases is likely. However, most of the market, especially large-cap coins, still retains the potential for a turnaround to a clear bull run, which may linger until the next seasonal bullish period in February. With this picture, it is worth carefully weighing the growth potential before additional purchases today and giving preference to heavily oversold assets with high technical goals for retest and slow issuance.
Today, I still prefer TURTLE NFP HOOK NTRN VIC MITO ENSO BMT SHELL, for which the growth potential is higher than the rest of the altcoin market, which may contribute to growth similar to RESOLV or STO in the near future. Among the coins with the tag monitoring for work, I consider only CHESS, which has high technical signals for retest up to 0.10-15.
Against the background of the annual rollback in CHZ, the probability of a bullying in fan tokens is also increasing. ATM ACM CITY JUV looks especially interesting. However, the dynamics of CHZ in the second half of the year is quite negative, I recommend working with fan tokens in a small volume and not increasing turnover if there are older unclosed positions.

Fed Just Opened the Door — USDJPY Could Bleed Hard!!Hey Traders, in today’s session we are monitoring USDJPY for a selling opportunity around the 156.300 zone. The pair continues to trade within a broader downtrend, and price is now retracing toward a key trend + S/R confluence at 156.300 — an area that has consistently acted as a supply zone for sellers.
Technical Structure
USDJPY remains in a bearish market structure (lower highs / lower lows).
Current pullback is approaching the 156.300 correction zone, where downside continuation becomes highly probable.
Dollar Macro Backdrop: Perfect Storm for USD Weakness
On the other side, DXY broke below its uptrend and is now pulling back toward the 98.800 retracement zone, confirming a broader shift in momentum.
The fundamentals are even more compelling:
1. The Fed did cut yesterday — 25bps.
This reinforces a clear dovish turn, and historically the USD underperforms aggressively in the weeks following the first cut of a new cycle.
2. The Fed's balance sheet is expanding again.
An expanding balance sheet = USD bearish liquidity environment.
3. The January FOMC is currently NOT priced for a cut — and that’s the opportunity.
The market is underpricing the risk of back-to-back cuts.
Now labor market data becomes the main catalyst.
And the reality is:
If we get any sign of further labor market weakness — which is increasingly likely — the market will start pricing in a January cut very fast.
And that leaves MUCH more room for USD weakness across the board.
Trade Focus
Monitoring price reaction at 156.300 for a bearish continuation setup.
If DXY resumes weakness out of 98.800 and labor data disappoints, USDJPY could accelerate aggressively to the downside.
Trade safe,
Joe.

NFP Bears gathering their troops? or will the Bulls stampede...The past 9 days have been quite interesting for the EUR/USD which has been relentless. Price has been rising like a helium balloon let loose at the park...
Bulls have clearly been in control, not only the past 9 days but since the beginning of the year with the exception of the strong pullback in April & May only to bounce for another 700 pip run.
I am totally USD bearish across the board as I have been mentioning in my analysis videos for the past few months but like all macro moves, we always have pullbacks along the way and that is why I have been shorting the EUR/USD back from 1.1500+ - 1.1700+
I've given this a lot of room to breathe, more than usual but considering the following technical setup, I'm willing to give the Bears some leeway and potentially show me they'll come through.
•Rising Broadening pattern (Where two trendlines start close together only to divergence and expand) - This is a bearish pattern.
•Negative Divergence on the MACD, Linear Regression & the RSI.
•Price has made a run to the yearly R3 pivot level. (Rare extension)
•Last daily candle is a hanging man candlestick (Reversal candle)
•Weekly chart has the EUR/USD at the upper band of a polynomial regression channel which calculates for price extremities in the market.
There are a few more setups as well but it's too much to describe here and I'd have to show it in a video (Which I plan to do over the weekend)
With all of that said... It could all fail lol but seriously speaking... You just can't ask for a better probabilistic setup so whatever happens during NFP... happens.
Aside from the technical aspect... I know yearly R2 around 1.1600 was a hotspot for shorts because divergence was at the early stages and taking a short there wouldn't have been a bad idea but we know institutions are in play as well, so above 1.1600 could have been a huge area to run stop losses and margin calls before a potential reversal.
250 pips would be enough to run a large pool of stops and liquidation.
IF price is going to reverse here during NFP, I believe late longs and breakout/pullback traders are going to try and buy at the trendline at 1.1660ish but it wont hold and trap them on the other side of the trade.
Under that, I can see us pulling back towards 1.1200ish...
If the Bears give up and price continues to climb... the original macro target may very well be under way which was 1.2000 - 1.2200 (Based on a Monthly and 3-Month chart analysis)
As of this writing the EUR/USD is pretty much completely flat which is expected before the NFP fireworks ahead of July 4th.
We'll see what happens tomorrow morning! buckle up!
As always, Good luck and Trade Safe! See you post NFP.

Growth up to 200% according to NFPTo date, the market continues to move exactly according to the scenario that I outlined in the last review. On Monday and Tuesday, the probability of a flat with sales attempts prevails, but from the middle of the week I expect the bullish trend to continue as part of a pullback on the annual candle and seasonal growth with an attempt to consolidate in the range of 3250-3500 ETH.
This week, NFP and SHELL reached medium-term supports, which I am now taking into account to work alongside TURTLE NTRN MITO VIC ENSO HOOK BMT. At the moment, 50% of tokens are already in circulation with further smooth unlocking, which will put minimal pressure on the price. In the future, the area for reliable scalping will shift slightly next year. For this instrument, there are long-term technical signals for growth up to 0.35-45, that is, 10X+. However, with the current bear market, we can still expect an attempt to retest the 0.060-75 range with a further pullback and resumption of growth in a new annual candle, which can already bring up to 150% profit. The intermediate resistance is the 0.05 level. If the daily or weekly candle opens higher, an active continuation of growth is likely. The opening of the second half of the month above this level will also be a signal for support.

XAU/USD Intraday Plan – NFP Will Decide the Next MoveGold failed to clear the 4115 resistance yesterday, which led to a retest of the 4053 level — now acting as intraday support. Price is currently trapped between the MA200 and MA50, reflecting indecision ahead of the NFP release.
We need to see a clean break above the immediate resistance at 4078.
A sustained move above 4115 would confirm a momentum shift and open the door toward
4170 → 4232.
If price fails to clear 4078, we may see continued consolidation or another pullback into the Support Zone.
A break below 3,996 would expose the HTF Support Zone (3968–3921).
📌Key Levels to Watch:
Resistance:
4078
4115
4170
4232
Support:
4053
4027
3996
3968
3921
🔎Fundamental Focus:
Today is all about NFP, one of the most market-moving releases for gold. With job creation, wages, and unemployment all being published together, we can expect sharp volatility in both directions.

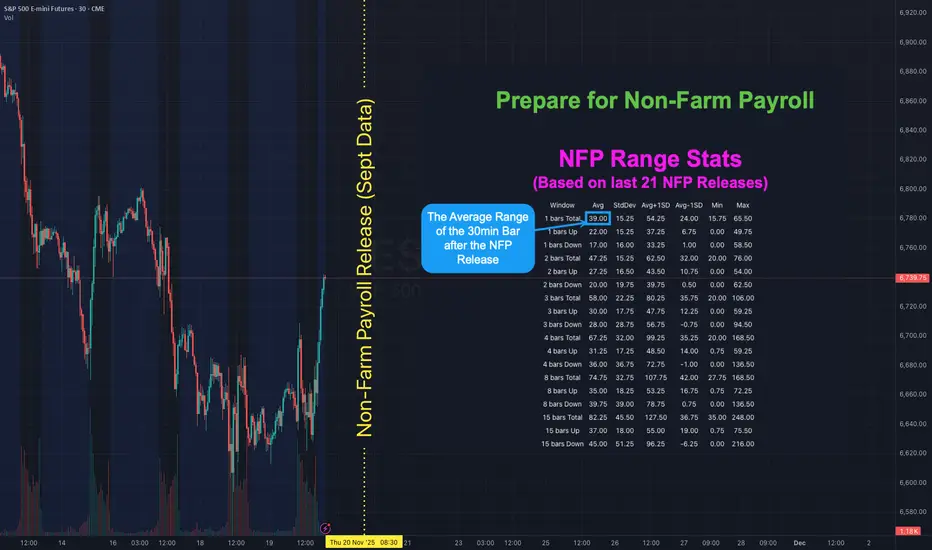
NFP is Back! Here's how to map out your playbook with statsHOW TO USE NFP RANGE STATS TO PREPARE YOUR PLAYBOOK
There has not been a Non-Farm Payroll release since Friday 5 September 2025 . Due to the government shutdown the September report that was originally set for Friday 3 October was postponed. It will finally be released on Thursday 20 November - a 48 day delay. With uncertainty around the labour data higher than usual it helps to know what “normal” looks like for ES S&P Futures. The table shows historical ranges after the 08:30 ET release on a 30-minute chart: 1 bar (30mins), 2 bars (60mins) 3 bars (90mins), 4 bars (2hrs), 8 bars (4hrs) and 15 bars (up to ~16:00 ET). The stats are based on the last 21 NFP releases (approx 2-years).
👉 If you think this would be useful as a script you can run yourself let me know (boost and drop a comment) and if there's enough interest I'll see if I can publish something.
WHAT THE COLUMNS MEAN
Avg - the typical move for that window based on past NFPs
StdDev - the variability around that average
Avg + 1 StdDev and Avg - 1 StdDev - quick upper and lower guardrails for a “normal” day
Min / Max - historical extremes in the sample
WAYS TO USE IT
1) Set guardrails for price discovery
Use Avg + 1 StdDev as a first “stretch” expectation for the window you trade. If price pushes beyond that level early you know we are outside normal and can adapt position size and expectations.
2) Pre-plan targets and emergency exits
Before 08:30 ET map a base scenario. Example for ES: if the 30m Avg post-release is X then a first take-profit can sit near X and a stretch target near Avg + 1 StdDev . Place an emergency stop beyond the Avg - 1 StdDev line if fading the first move.
3) Size positions to volatility
Translate the Avg 30m range into ticks or points and size so that a typical NFP bar does not exceed your defined risk. If your stats say the first 30m averages 9 points on ES do not run a size that cannot survive a 9-12 point swing.
4) Choose a playbook by window
1 bar (30m) - breakout or first-reaction mean-reversion
2-4 bars (60-120m) - continuation or reversal probabilities stabilise around the Avg envelope
8-15 bars - when the full session range is already at or beyond Avg + 1 StdDev be cautious chasing late moves
With the report 48 days late the probability of surprise is elevated. Go into the print with your ranges pre-mapped and your position sizing tied to those Avg and Avg ± StdDev bands. Clarity beats adrenaline.
👉 REMINDER:
If you think this would be useful as a script you can run yourself let me know (boost and drop a comment) and if there's enough interest I'll see if I can publish something.
DXY Bullish Continuation Risks Challenge the 100.20-ResistanceOn the daily chart, the DXY’s rebound from its 17-year support near 96 resembles an inverted head-and-shoulders breakout, currently testing the 100.20 resistance.
A confirmed close above this level would complete the pattern, targeting the 101.80 and 103.40 levels — moves that could potentially pressure GBPUSD toward 1.2940 and 1.2740, as detailed in the following charts.
From the downside, if the DXY retreats below 99.40, the selling pressure on major currencies may ease. In that scenario, the DXY is expected to retest the neckline and validate the inverted head-and-shoulders formation, with the trendline connecting consecutive lower highs from May to August, between 98.50 and 98.00.
- Razan Hilal, CMT

EURUSD 3-7Nov NFP week. Two gates decide it: 1.1525 and 1.1635If you trade EURUSD only one week at a time, clarity beats prediction. We closed Friday around 1.1535, near the lower edge of the October range. That puts the pair in a simple state. The market is either building a base above 1.1525 and preparing to challenge 1.1635, or it is slipping back into the mid 1.14s where liquidity sits. I am not here to guess. I am here to define the levels, the triggers, and the discipline that keeps the drawdown small while leaving room for upside if momentum appears.
What matters this week
The calendar clusters the real moves around the US session. Expect a faster tape around midweek and into Friday jobs data.
The driver under the hood is still rate spreads. If yields firm and the dollar catches a bid, 1.1525 is the first line of truth.
The plan uses a two gate structure. Lose the lower gate and you trade short toward the next support shelf. Reclaim the upper gate and you trade long toward the next resistance shelf. Between the gates you keep risk tiny or flat.
Levels that define the week
• Support map: 1.1525 then 1.1500 then 1.1450 then 1.1400 to 1.1350
• Resistance map: 1.1575 then 1.1635 then 1.1700 then 1.1760
Plot them on H4 and H1. Add session separators. Shade the October value area if you keep a volume profile. This gives you a visual spine for every decision.
How I will trade it
I treat 1.1525 to 1.1575 as the neutral band. I call it the noise strip. Inside this band I either reduce size to a probe or I do nothing. I want confirmation from the tape before I put real risk on.
Long idea, momentum reclaim
Base above 1.1575 for at least thirty minutes.
Hold above the level through one pullback. The first pullback must find buyers above 1.1560.
Enter long on a clean break and retest that holds, or on a strong close above 1.1600 if the retest never comes.
Initial stop goes below the pullback low or one H4 ATR from entry. If you prefer structure, use 1.1555.
First target is 1.1635. Take partials there. If momentum remains healthy, let a runner work toward 1.1700.
Invalidation is a close back under 1.1575 after entry. If that happens you flatten without debate.
Short idea, downside continuation
Lose 1.1525 on expanding range.
Do not chase the first break. Wait for a retest from below that fails near 1.1525 to 1.1535.
Enter short when the retest stalls and H1 rolls over.
Initial stop above 1.1550 or one H4 ATR from entry.
First target is 1.1500. If that gives way, work the position into 1.1450. Keep a measured pace around 1.1450 to 1.1400 since liquidity often lives there.
Invalidation is a clean close back above 1.1525 after entry.
Position sizing and risk
The metric to respect this week is Return divided by Drawdown. You can call it R over D. Aim for R over D above one on each trade and above one for the week. That means you size entries so that a normal loss on a single attempt costs less than half of the average win to the next level. Use a fixed fraction per trade or a volatility target based on H4 ATR. For most day traders in majors the sweet spot is one half to one percent of account risk per idea. If your first two attempts fail, you cut size in half for the third. This alone keeps you in the game when the band chops you.
Execution windows
London open often sets the day’s path but New York confirms it. I give more trust to signals that survive the US open.
News minutes are not bravery minutes. If you open a new position inside a data bar you accept slippage as the price of impatience. My rule is simple. Ten minutes before a tier one release I stop initiating new risk unless the trade is already well in profit.
The week closes on Friday with higher volatility risk. If you are green, pay yourself. If you are red, do not try to make it back during the last hour.
Common mistakes to avoid
Trading inside the noise strip with full size.
Averaging down inside the strip when the market is waiting for the next data impulse.
Taking profits early at the first ten pips then giving the rest back on a late chase.
Forgetting that levels are areas not single prints. Build a cushion into stops and entries.
Checklist for your chart
H4 and H1 with session separators.
Lines at 1.1525, 1.1575, 1.1635, 1.1700, and the mid 1.14 shelf.
One ATR measure on H4 for dynamic stops.
A simple label on the chart that says R over D target greater than one.
Optional view. A rates panel or at least a ten year yield overlay on a side chart to keep the macro driver in sight.
I will update the levels only if the market prints fresh structure. Until then the plan is to let price prove direction at the gates and to trade only when the proof is there. If you prefer fewer decisions, pick a single gate for the week. Many traders do well with a one side rule. They only trade longs above the upper gate or only trade shorts below the lower gate. That cuts noise and keeps focus tight.
Reminder
Education and analytics only. No advice. No guarantees. Process beats prediction.

AUDUSD Eyes 0.6500 as Softer CPI and Weak Jobs Data Weigh on USDHey Traders,
In the coming week, we’re monitoring AUDUSD for a potential buying opportunity around the 0.65000 zone. The pair remains in a broader uptrend, with the current pullback shaping up as a healthy correction toward key structural support.
Structure:
Price continues to respect its ascending trendline, and the 0.65000 area aligns with a strong confluence of horizontal support and dynamic trend structure — a level that has previously attracted strong buying momentum.
Macro Outlook:
The latest U.S. inflation print came in softer at 3.0%, undershooting expectations, while labour market data continues to signal cooling conditions. Together, these developments reinforce a dovish shift in Fed sentiment, weighing on the U.S. Dollar Index (DXY).
At the same time, Gold continues to rally, underpinned by the weakening Dollar and rising safe-haven demand. Given the positive correlation between AUD and Gold, this macro backdrop strengthens the bullish case for AUDUSD in the coming sessions.
Next Move:
A sustained bid around 0.65000 could mark the start of another impulse leg higher — targeting a retest of recent highs if momentum confirms.
Trade safe,
Joe

EURUSD Breakout and Potential RetraceHey Traders, in today's trading session we are monitoring EURUSD for a buying opportunity around 1.15600 zone, EURUSD was trading in a downtrend and successfully managed to break it out. Currently is in a correction phase in which it is approaching the retrace area at 1.15600 support.
Trade safe, Joe.

Stop!Loss|Market View: EURUSD🙌 STOP!Loss team welcomes you❗️
In this post, we're going to talk about the near-term outlook for the EURUSD currency pair☝️
Potential trade setup:
🔔Entry level: 1.17085
💰TP: 1.15818
⛔️SL: 1.17720
"Market View" - a brief analysis of trading instruments, covering the most important aspects of the FOREX market.
👇 In the comments 👇 you can type the trading instrument you'd like to analyze, and we'll talk about it in our next posts.
💬 Description: A decline in the euro is seen as the main scenario for today, as part of a reversal from the area near 1.19000. Currently, the price is testing short-term resistance at 1.17445, where the POC (point of control) of the current downward movement is located. For a more conservative entry, it is better to use a pending order with an entry level below this resistance.
Thanks for your support 🚀
Profits for all ✅
❗️ Updates on this idea can be found below 👇

XAUUSD - Will Gold Hit $4,000?!Gold is trading above the EMA200 and EMA50 on the hourly chart and is trading in its medium-term ascending channel. A correction towards the demand zone will provide us with a better risk-reward buying opportunity. It should be noted that these positions are intended to hedge against this uptrend.
In early Monday trading in Asian markets, global gold prices surpassed $3,900 per ounce for the first time, driven by stronger demand for safe-haven assets amid the U.S. government shutdown and rising expectations of further Federal Reserve rate cuts.
Goldman Sachs once again reaffirmed its bullish outlook on gold, calling it its “most favored long-term commodity asset”, even as the precious metal continues to reach new record highs. Analysts at the bank believe the upward momentum remains intact.
Goldman forecasts that gold will reach $4,000 by mid-2026 and $4,300 by December 2026. However, the bank cautioned that upside risks beyond these projections are emerging. Notably, speculative flows account for only about 1% of the recent 14% rally, signaling stronger and more sustainable support from ETFs and central banks.
Marc Chandler, CEO of Bannockburn Global Forex, commented: “Gold has risen for the seventh consecutive week, having declined in only one week since late July. The U.S. government shutdown, Europe’s debate over reusing Russian reserves, and ongoing hybrid tensions across Europe have all contributed to this rally.” He added, “A short-term support level has formed near $3,800, and reaching $4,000 no longer seems far-fetched.”
Similarly, Darin Newsom, senior market analyst at Barchart.com, noted: “The market trend remains bullish. The U.S. economy has not improved—if anything, it has deteriorated further. Central banks and global investors clearly recognize this and continue accumulating gold.”
For this week, considerable uncertainty surrounds the U.S. data release calendar. If Democrats and Republicans manage to reach an agreement on a temporary funding bill early in the week, the September employment report could be released on schedule Friday. Estimates suggest a modest improvement in job creation, with around 50,000 new positions, though the weak ADP private payrolls data paints a more cautious picture. Still, downside risks to employment remain, reinforcing expectations for further rate cuts.
Even if the jobs report is delayed, the ongoing government shutdown alone could drive markets to increase bets on rate reductions, as a surge in furloughed federal workers and reduced economic output from halted government operations may compel the Fed to lower borrowing costs.
Beyond Washington’s political standoff, investors’ focus this week will be on the minutes from the Fed’s September meeting, which could reveal growing divisions among policymakers over the labor market outlook.
The Fed’s latest dot plot highlights a widening gap between hawkish and dovish members, meaning any new clues in the minutes about the timing or pace of rate cuts could spark a strong market reaction.
Toward the end of the week, attention will also turn to the University of Michigan’s preliminary consumer sentiment survey, particularly the inflation expectations component, which holds significant weight for gauging domestic demand. At the same time, the U.S. Treasury market faces a busy schedule of debt auctions, adding another layer of focus for investors.
