NG1! BEARS ARE STRONG HERE|SHORT
NG1! SIGNAL
Trade Direction: short
Entry Level: 3.177
Target Level: 2.934
Stop Loss: 3.339
RISK PROFILE
Risk level: medium
Suggested risk: 1%
Timeframe: 9h
Disclosure: I am part of Trade Nation's Influencer program and receive a monthly fee for using their TradingView charts in my analysis.
✅LIKE AND COMMENT MY IDEAS✅
Natural Gas

NATGAS: Market of Sellers
Balance of buyers and sellers on the NATGAS pair, that is best felt when all the timeframes are analyzed properly is shifting in favor of the sellers, therefore is it only natural that we go short on the pair.
Disclosure: I am part of Trade Nation's Influencer program and receive a monthly fee for using their TradingView charts in my analysis.
❤️ Please, support our work with like & comment! ❤️
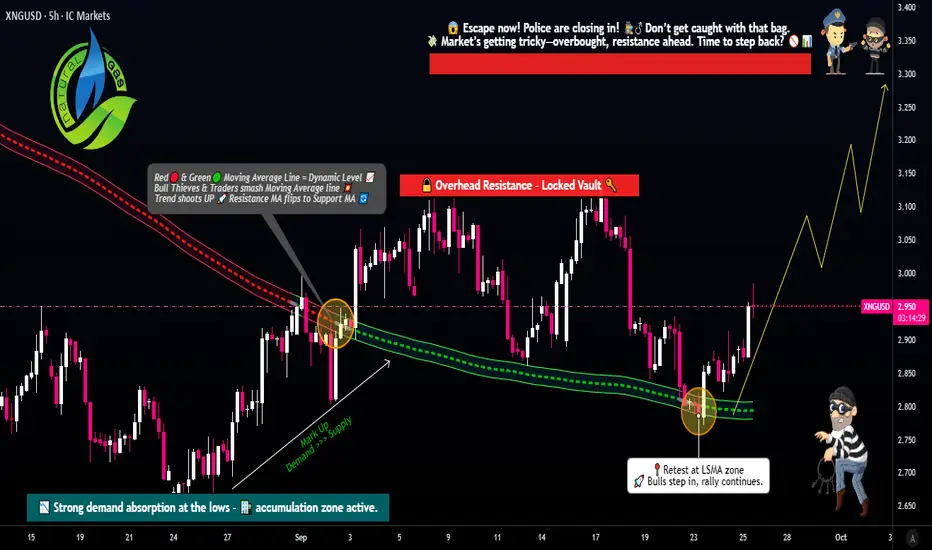
XNG/USD Swing Trade Plan – Entry, Stop, and Target Explained🚀 NATURAL GAS (XNG/USD) – Energies Market Wealth Strategy Map ⚡🔥
(Swing Trade Setup – Thief Layered Style)
📊 Plan
✅ Bullish confirmation spotted with LSMA pullback 🟢
✅ Thief’s unique layering entry strategy 🎭 — stacking multiple buy limit orders to sneak into the market like a pro.
Layered Entry Levels:
Buy Limit @ 2.800 🧩
Buy Limit @ 2.850 🧩
Buy Limit @ 2.900 🧩
Buy Limit @ 2.950 🧩
(Feel free to add more layers based on your own risk appetite.)
🛡️ Risk Management
Stop Loss (Thief SL): ⚠️ @ 2.750
(Note: Dear Ladies & Gentlemen – Thief OG’s – this SL is my style. Always set your own SL according to your risk.)
🎯 Target Zone
👮 Police Barricade spotted around 3.300 🚨
Here we have:
Strong resistance wall 🧱
Overbought signals 📈
Potential trap zone
👉 Take your profits before the market police catch you! Escape with your bags full 💼💨
(Note: Dear Ladies & Gentlemen – Thief OG’s – this TP is my style. Always set your own target according to your profit goals.)
🔍 Related Pairs & Correlations
FXOPEN:XNGUSD (Natural Gas) – our main thief play 🎭
BLACKBULL:WTI / TVC:UKOIL (Crude Oil & Brent) 🛢️ – often show energy sector momentum correlation
ICMARKETS:XBRUSD (Brent Crude) – watch for confirmation of energy strength 🔥
SP:SPX / TVC:DXY (S&P 500 & US Dollar Index) – dollar strength can pressure commodities
OANDA:XAUUSD (Gold) – safe haven vs energy volatility ⚡
Correlated markets can confirm direction or signal early reversals. Always watch the energy family together for big moves.
✨ “If you find value in my analysis, a 👍 and 🚀 boost is much appreciated — it helps me share more setups with the community!”
⚠️ Disclaimer: This is a thief-style trading strategy created just for fun & educational purposes. Not financial advice. Trade safe, trade smart.
#XNGUSD #NaturalGas #Commodities #SwingTrade #EnergyMarkets #LayeringStrategy #TradingCommunity #MarketThief #OGStyle
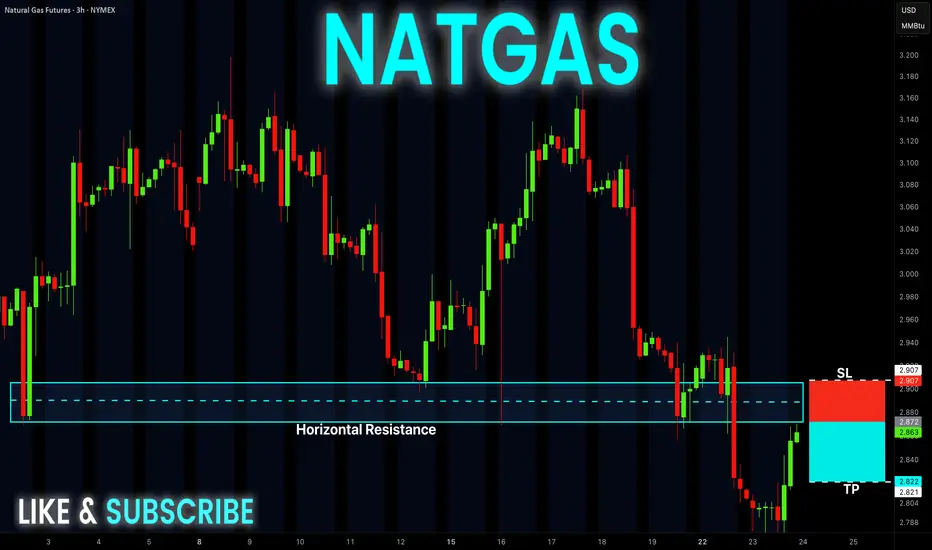
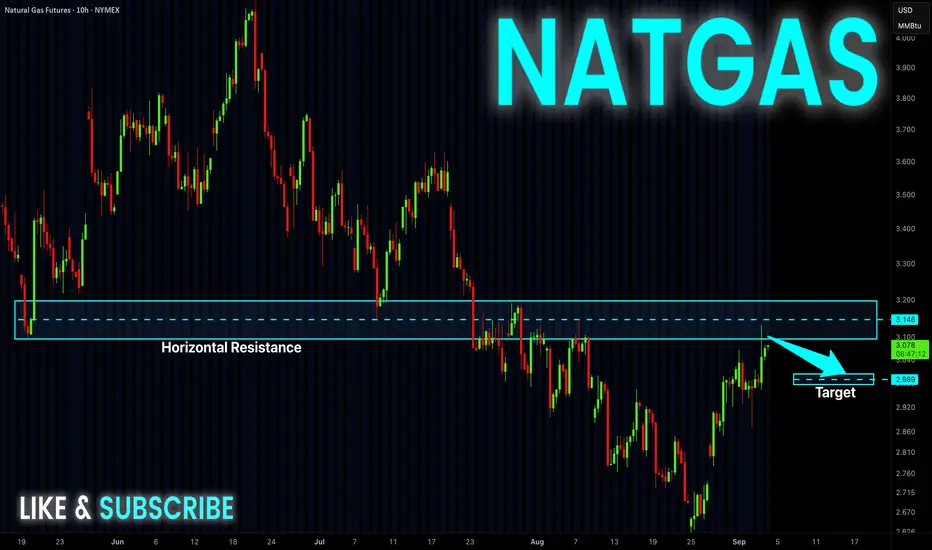
NATGAS Free Signal! Sell!
Hello,Traders!
NATGAS is making a bullish
Correction move, but a horizontal
Resistance area is ahead
Around 2.890$ and after
The retest a local bearish
Pullback is to be expected
So we will be able to enter
A following short trade:
------------------
Stop Loss: 2.907
Take Profit: 2.822
Entry: 2.872
Time Frame: 3H
------------------
Sell!
Comment and subscribe to help us grow!
Check out other forecasts below too!
Disclosure: I am part of Trade Nation's Influencer program and receive a monthly fee for using their TradingView charts in my analysis.
Gold | Oil | Dollar | Silver | Natural Gas Price ForecastCatch the latest commodities trading insights! This week's market analysis includes a look at both sides of the coin for oil, gold and silver. Plus, get some helpful technical analysis and trading tips to guide your decisions.
Gold | Oil | Dollar | Silver | Natural Gas Price Forecast
COMEX:GC1! COMEX:SI1! NYMEX:CL1! AMEX:UNG

NATGAS Long From Support! Buy!
Hello,Traders!
NATGAS made a retest
Of the wide horizontal
Support level of 2.876$
And a local rebound is
Already taking place so
We are bullish baised
And we think that a local
Bullish correction is to
Be expected on Monday
Buy!
Comment and subscribe to help us grow!
Check out other forecasts below too!
Disclosure: I am part of Trade Nation's Influencer program and receive a monthly fee for using their TradingView charts in my analysis.
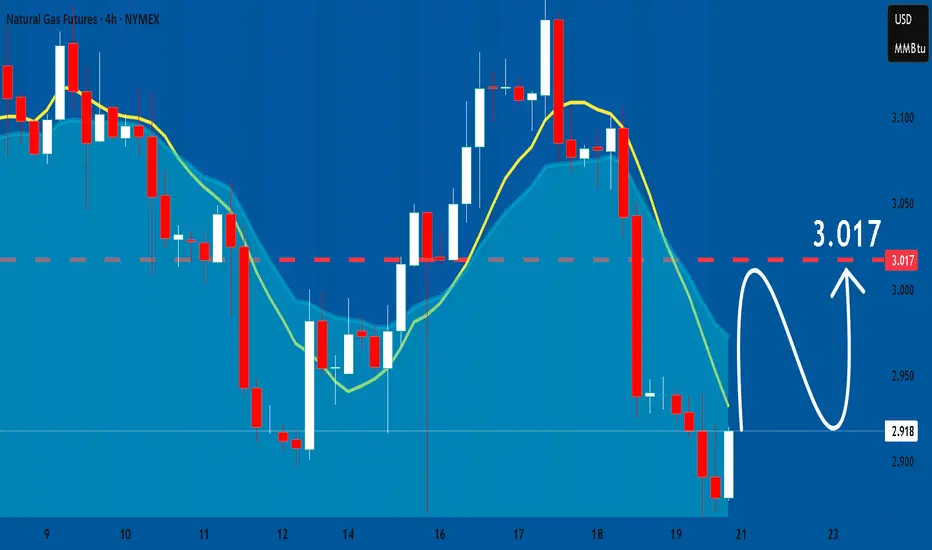
NATGAS What Next? BUY!
My dear followers,
This is my opinion on the NATGAS next move:
The asset is approaching an important pivot point 2.918
Bias - Bullish
Technical Indicators: Supper Trend generates a clear long signal while Pivot Point HL is currently determining the overall Bullish trend of the market.
Goal - 2.997
About Used Indicators:
For more efficient signals, super-trend is used in combination with other indicators like Pivot Points.
Disclosure: I am part of Trade Nation's Influencer program and receive a monthly fee for using their TradingView charts in my analysis.
———————————
WISH YOU ALL LUCK

NATGAS: Growth & Bullish Forecast
Balance of buyers and sellers on the NATGAS pair, that is best felt when all the timeframes are analyzed properly is shifting in favor of the buyers, therefore is it only natural that we go long on the pair.
Disclosure: I am part of Trade Nation's Influencer program and receive a monthly fee for using their TradingView charts in my analysis.
❤️ Please, support our work with like & comment! ❤️
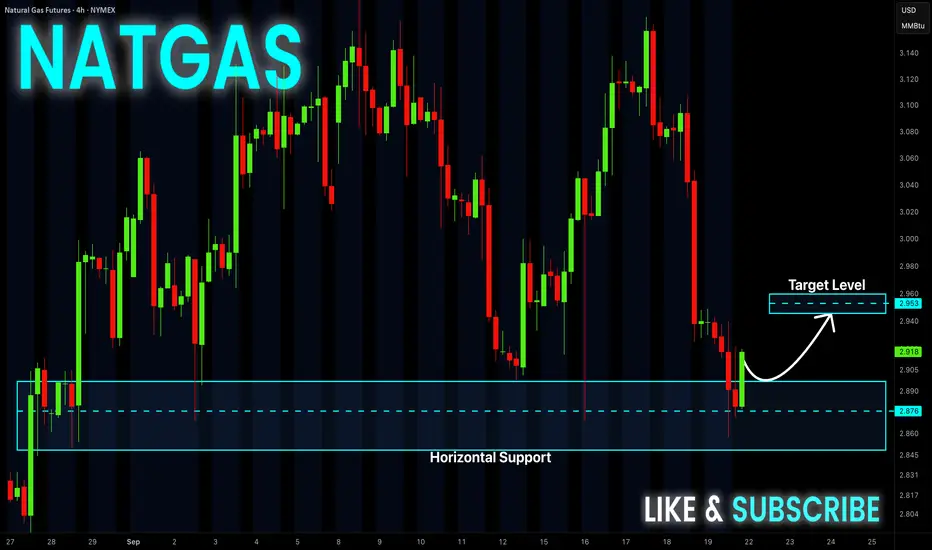
NATGAS LOCAL LONG|
✅NATGAS went down to retest
A horizontal support of 2.86$
Which makes me locally bullish biased
And I think that a move up
From the level is to be expected
Towards the target above at 2.96$
LONG🚀
✅Like and subscribe to never miss a new idea!✅

Gold | Oil | Dollar | Silver | Natural Gas Price ForecastGold | Oil | Dollar | Silver | Natural Gas Price Forecast
NYMEX:NG1! AMEX:UNG AMEX:BOIL PEPPERSTONE:NATGAS

NATGAS Massive Long! BUY!
My dear friends,
Please, find my technical outlook for NATGAS below:
The price is coiling around a solid key level - 2.955
Bias - Bullish
Technical Indicators: Pivot Points High anticipates a potential price reversal.
Super trend shows a clear buy, giving a perfect indicators' convergence.
Goal - 2.992
About Used Indicators:
The pivot point itself is simply the average of the high, low and closing prices from the previous trading day.
Disclosure: I am part of Trade Nation's Influencer program and receive a monthly fee for using their TradingView charts in my analysis.
———————————
WISH YOU ALL LUCK

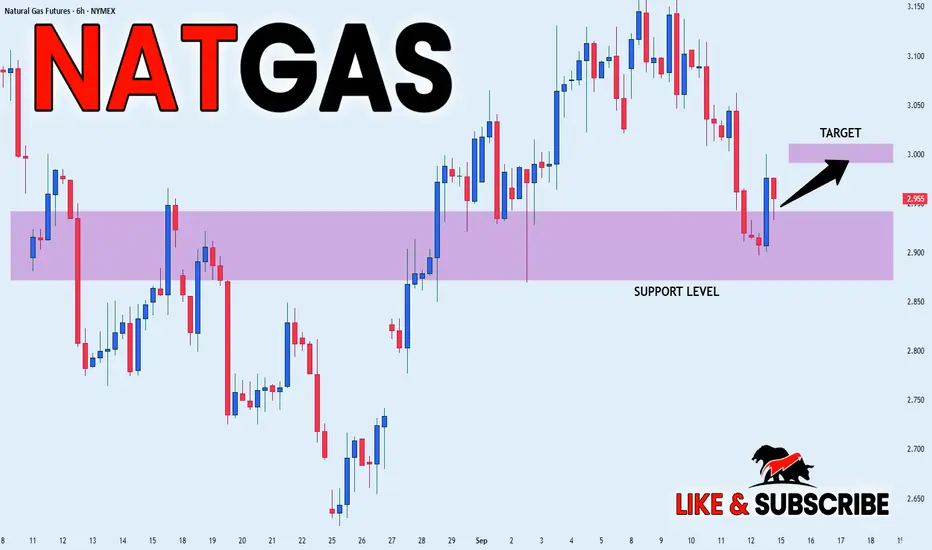
NATGAS LOCAL LONG|
✅NATGAS went down to retest
A horizontal support of 2.90$
Which makes me locally bullish biased
And I think that we will see a rebound
And a move up from the level
Towards the target above at 3.00$
LONG🚀
✅Like and subscribe to never miss a new idea!✅
NATGAS: Bullish Forecast & Outlook
Looking at the chart of NATGAS right now we are seeing some interesting price action on the lower timeframes. Thus a local move up seems to be quite likely.
Disclosure: I am part of Trade Nation's Influencer program and receive a monthly fee for using their TradingView charts in my analysis.
❤️ Please, support our work with like & comment! ❤️
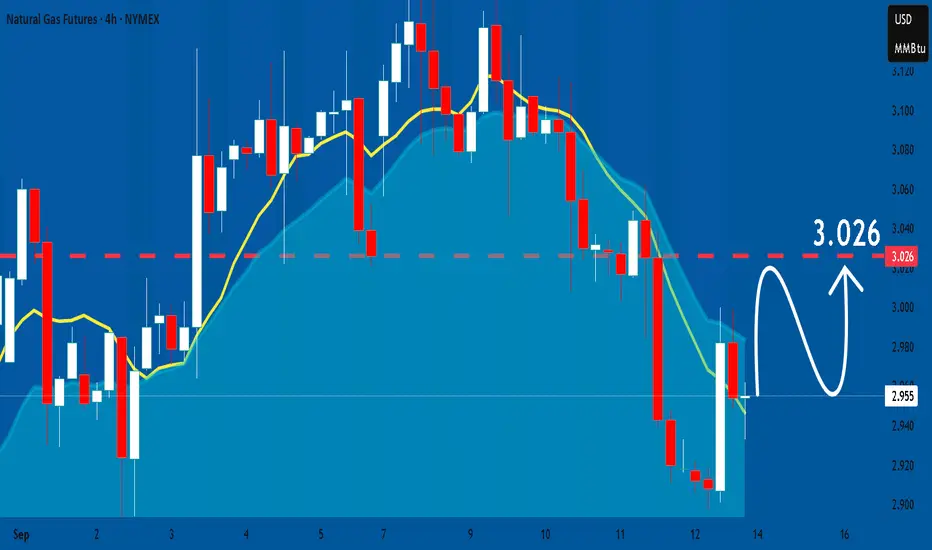
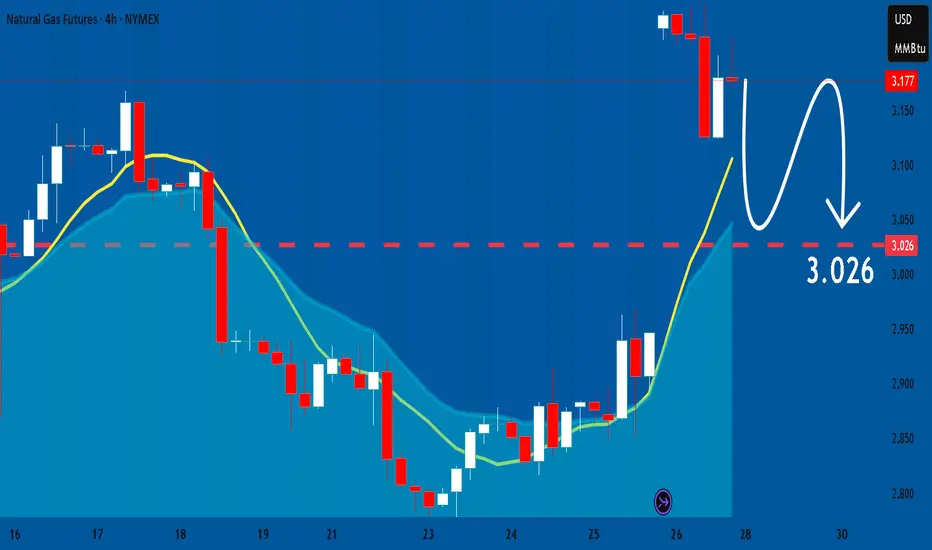
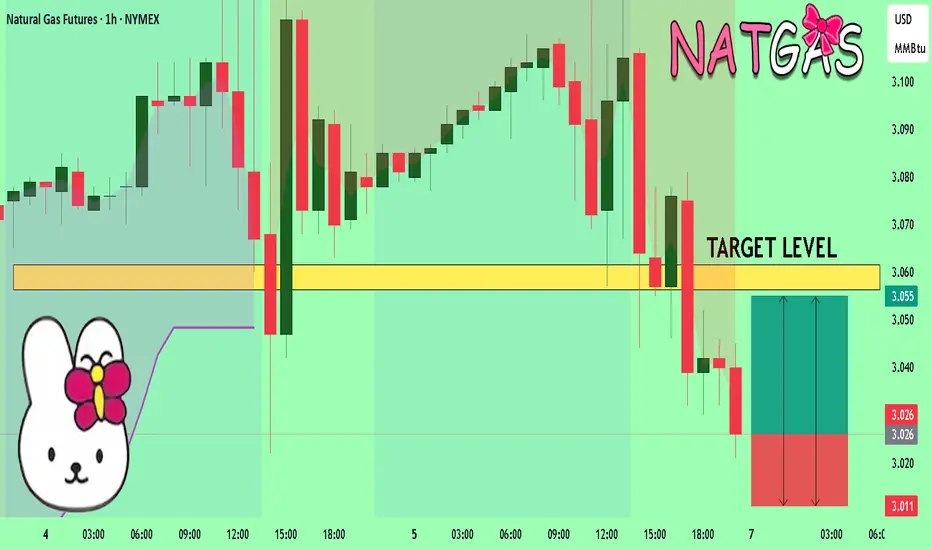
NATGAS Sellers In Panic! BUY!
My dear subscribers,
My technical analysis for NATGAS is below:
The price is coiling around a solid key level - 3.026
Bias - Bullish
Technical Indicators: Pivot Points Low anticipates a potential price reversal.
Super trend shows a clear buy, giving a perfect indicators' convergence.
Goal - 3.056
My Stop Loss - 3.011
About Used Indicators:
By the very nature of the supertrend indicator, it offers firm support and resistance levels for traders to enter and exit trades. Additionally, it also provides signals for setting stop losses
Disclosure: I am part of Trade Nation's Influencer program and receive a monthly fee for using their TradingView charts in my analysis.
———————————
WISH YOU ALL LUCK
Multi-Asset Execution Chart Analysis & TradesAnalysis Date : September 11, 2025
Trading Analyst : Institutional Intelligence Framework
Methodology : Enhanced Dual Renko Chart System with Optimized Technical Indicators
Executive Summary
Execution chart analysis validates the exceptional institutional opportunities identified in our structure analysis. All three primary equity indices show perfect technical confirmation of institutional positioning with strong momentum indicators. Commodity and currency markets reveal significant technical conflicts requiring defensive positioning adjustments.
Enhanced Indicator Configuration
DMI/ADX Visual Standards :
ADX (Green) : Trend strength indicator (>25 = strong trend)
+DI (Blue) : Bullish directional movement
-DI (Red) : Bearish directional movement
Line Weight : 3pt for enhanced visibility
Dual Stochastics Configuration :
Tactical (5,3,3) : %K (Dark Blue), %D (Teal) - Short-term momentum
Strategic (50,3,3) : %K (Black), %D (Red Circles) - Medium-term context
Primary Opportunities - Technical Validation (75-85% Total Allocation)
1. DOW JONES (YM) - 30-35% ALLOCATION
Classification : OPTIMAL RISK/REWARD - Superior Technical Confirmation
YM Execution View:
Execution Signal Analysis :
DEMA Status : Bullish alignment confirmed (black above orange)
ADX : 47.74 (highest trend strength among all indices)
+DI/-DI Ratio : 2.69:1 bullish dominance
Momentum Quality : Exceptional - strongest ADX with optimal positioning
Stochastics : Tactical 98.86/84.24, Strategic 98.86/84.02 (peak momentum)
Technical Trade Setup :
Bullish Scenario (80% probability) :
Entry : /MYM at current levels 46,050 (optimal positioning confirmed)
Technical Edge : Strongest ADX + minimal extension risk
Stop Loss : 45,000 (2.3% risk - best among indices)
Target 1 : 47,000 (+2.1% - close 40% position)
Target 2 : 48,000 (+4.2% - close 30% position)
Trail Strategy : 150-point swing lows on remaining 30%
Consolidation Scenario (15% probability) :
Range : 45,500-46,500 around YTD POC consensus
Strategy : Accumulate on any dips to 45,700
Advantage : Minimal downside to institutional support
Risk Management : Optimal positioning within institutional zone
Bearish Scenario (5% probability) :
Trigger : Break below 45,000 (institutional consensus violation)
Action : Reduce position by 50%
Probability : Very low given YTD POC validation and technical strength
Re-entry : Require fresh institutional accumulation evidence
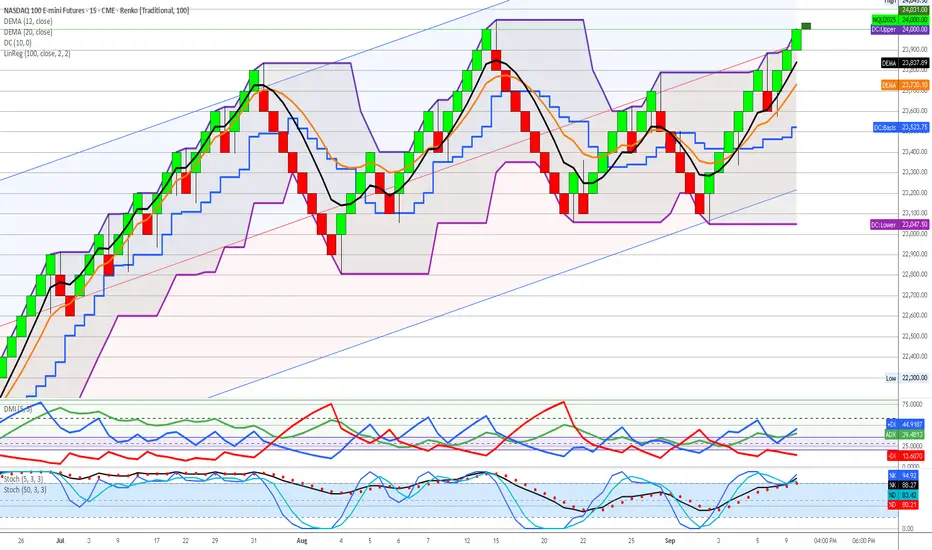
2. NASDAQ 100 (NQ) - 25-30% ALLOCATION
Classification : EXCEPTIONAL MOMENTUM - Exceptional Institutional Backing
NQ Execution View:
Execution Signal Analysis :
DEMA Status : Strong bullish alignment (black above orange)
ADX : 44.91 (exceptional trend strength)
+DI/-DI Ratio : 2.90:1 bullish dominance (highest among indices)
Momentum Quality : Exceptional directional bias
Stochastics : Tactical 88.27/80.21, Strategic 88.27/80.21 (strong sustainable)
Technical Trade Setup :
Bullish Scenario (75% probability) :
Entry : /MNQ at current levels or pullback to 23,700-23,800
Technical Edge : Highest +DI/-DI ratio with institutional backing
Stop Loss : 23,000 (4.3% risk)
Target 1 : 25,000 (+4.3% - close 50% position)
Target 2 : 25,500 (+6.1% - close 25% position)
Trail Strategy : 100-point swing lows on remaining 25%
Consolidation Scenario (20% probability) :
Range : 23,500-24,500 above institutional accumulation
Strategy : Scale into weakness, maintain core position
Management : Use tactical stochastics for entry timing
Support : 26.8:1 institutional backing provides confidence
Bearish Scenario (5% probability) :
Trigger : Break below 23,000 (Q3 POC violation)
Action : Exit all positions immediately
Reassessment : Wait for institutional re-accumulation
Probability : Very low given exceptional institutional support
3. S&P 500 (ES) - 20-25% ALLOCATION
Classification : SOLID CONFIRMATION - Strong Institutional Support
ES Execution View:
Execution Signal Analysis :
DEMA Status : Bullish alignment maintained (black above orange)
ADX : 41.32 (strong trend strength)
+DI/-DI Ratio : 1.74:1 bullish dominance
Momentum Quality : Solid institutional validation
Stochastics : Tactical 34.44/93.30, Strategic 98.26/95.30 (extreme overbought)
Technical Trade Setup :
Bullish Scenario (70% probability) :
Entry : /MES on any pullback to 6,450-6,500
Current Caution : Strategic stochastics extremely overbought
Stop Loss : 6,300 (3.8% risk)
Target 1 : 6,700 (+2.8% - close 50% position)
Target 2 : 6,800 (+4.4% - close 25% position)
Profit Management : Take profits on strength given overbought conditions
Consolidation Scenario (25% probability) :
Range : 6,400-6,600 around institutional levels
Strategy : Wait for tactical stochastics to reset before adding
Management : Reduce position size until momentum cools
Context : Strategic overbought suggests pause needed
Bearish Scenario (5% probability) :
Trigger : Break below 6,300 (institutional support failure)
Action : Systematic position reduction
Management : Tight stops given overbought technical readings
Re-entry : Wait for technical reset and institutional validation
Secondary Opportunities - Mixed Technical Signals (10-15% Total Allocation)
4. WTI CRUDE OIL (CL) - 8-12% ALLOCATION
Classification : INSTITUTIONAL CONFLICT - Defensive Positioning Required
CL Execution View:
Execution Signal Analysis :
DEMA Status : Bullish alignment (black above orange)
ADX : 42.19 (strong trend strength)
+DI/-DI Ratio : BEARISH 2.44:1 (-DI 42.10 vs +DI 17.86)
Critical Conflict : DEMA bullish vs DMI strongly bearish
Stochastics : Tactical 9.26/27.64, Strategic 27.64/33.61 (oversold setup)
Technical Trade Setup :
Bullish Scenario (45% probability) :
Entry Criteria : WAIT for +DI to cross above -DI for confirmation
Current Action : Reduce position size due to momentum conflict
Stop Loss : 61.50 (tight due to bearish momentum)
Target : 65.50 if technical alignment achieved
Risk Management : Maximum 1.5% account risk due to signal conflict
Neutral Scenario (35% probability) :
Range : 62.00-64.00 within institutional accumulation
Strategy : Maintain minimal defensive position
Monitoring : Daily +DI/-DI relationship for momentum shift
Institutional Support : Strong Q2 accumulation provides floor
Bearish Scenario (20% probability) :
Trigger : Break below 61.00 (institutional support failure)
Action : Complete position liquidation
Reason : Bearish momentum confirming institutional breakdown
Re-entry : 58.00 area (Q2 POC support) with technical confirmation
High-Risk Positions - Technical Deterioration (0-8% Total Allocation)
5. NATURAL GAS (NG) - 3-5% ALLOCATION
Classification : HIGH RISK - Institutional Disengagement Confirmed
NG Execution View:
Execution Signal Analysis :
DEMA Status : Bearish alignment (black below orange)
ADX : 42.79 (strong trend - bearish direction)
+DI/-DI Ratio : EXTREME BEARISH 6.30:1 (-DI 53.25 vs +DI 8.45)
Technical Reality : All major indicators bearishly aligned
Stochastics : Tactical 0.00/6.70 (maximum oversold), Strategic 51.98/65.70
Technical Trade Setup :
Bullish Scenario (20% probability) :
Entry Criteria : AVOID - all technical signals bearish
Required Confirmation : DEMA bullish cross + DMI reversal + institutional re-engagement
Current Action : Complete avoidance recommended
Speculative Only : Maximum 1% account risk if attempting reversal play
Neutral Scenario (30% probability) :
Range : 2.80-3.20 with declining institutional participation
Strategy : Avoid new positions, monitor for institutional return
Risk : 65% volume decline from Q1 peak activity
Liquidity : /MNG insufficient volume (13,991) for meaningful sizing
Bearish Scenario (50% probability) :
Continuation : Further decline toward 2.50-2.70 historical lows
Institutional Reality : Smart money disengagement pattern
Technical Confirmation : 6.30:1 bearish momentum supports decline
Strategy : Complete avoidance until institutional re-engagement
6. EURO FUTURES (6E) - 2-3% ALLOCATION
Classification : DANGEROUS EXTENSION - Technical Breakdown Confirmed
6E Execution View:
Execution Signal Analysis :
DEMA Status : Bearish crossover (black below orange)
ADX : 29.21 (moderate trend strength)
+DI/-DI Ratio : BEARISH 1.19:1 (-DI 29.21 vs +DI 24.49)
Extension Risk : 12.1% above YTD POC institutional consensus
Stochastics : Tactical 23.24/66.57, Strategic 74.26/90.89 (extremely overbought)
Technical Trade Setup :
Bullish Scenario (15% probability) :
Entry : AVOID - dangerous extension with technical breakdown
Existing Positions : Immediate systematic profit-taking required
Risk : Overextension + bearish technical = correction imminent
Management : Emergency profit-taking protocols engaged
Neutral Scenario (25% probability) :
Range : 1.1650-1.1800 at dangerous extension levels
Strategy : Avoid range trading given extension risk
Risk Assessment : All signals point to mean reversion
Professional Response : Defensive positioning only
Bearish Scenario (60% probability) :
Target : Return to YTD POC 1.0525 (-12.1% correction)
Technical Trigger : DEMA bearish cross + momentum deterioration
Strategy : Short opportunities on any strength above 1.1780
Entry : /M6E shorts with tight stops above 1.1820
Risk Control : Maximum 1% account risk given extension
7. GOLD FUTURES (GC) - 0% ALLOCATION
Classification : LIQUIDATION - High Risk Territory
GC Execution View:
Execution Signal Analysis :
DEMA Status : Bearish crossover from distribution highs
ADX : 34.91 (declining trend strength)
+DI/-DI Ratio : BEARISH 1.31:1 (-DI 34.91 vs +DI 26.64)
Extension Risk : 12.2%+ beyond ALL institutional positioning
Stochastics : Tactical 11.25/30.89, Strategic 89.46/93.86 (maximum overbought)
Technical Trade Setup :
Emergency Liquidation Protocol :
Immediate Action : Complete liquidation using market orders if necessary
Rationale : Void territory + technical breakdown = catastrophic risk
No Stops : Emergency exit protocols - immediate execution required
Reallocation : Proceeds to YM, NQ, ES primary opportunities immediately
Short Opportunity (High Probability) :
Strategy : /MGC shorts on any rallies above 2,690
Target : 2,380-2,400 (return to institutional zones)
Stop : 2,720 (tight risk control)
Correction Magnitude : 12-15% decline expected
Risk : Maximum 1% account risk for speculative short
Portfolio Risk Management Protocols
Position Sizing Framework
Maximum Risk Per Trade : 2% account value (1.5% for conflicted signals)
Portfolio Heat Limit : 15% total risk across all positions
Correlation Controls : Maximum 85% equity exposure given technical alignment
Cash Management : 5-10% opportunity fund for technical setups
Technical Signal Hierarchy
Primary Confirmation : DEMA + DMI + ADX alignment required
Entry Timing : Stochastics for tactical positioning optimization
Risk Management : Institutional levels for strategic stop placement
Profit Taking : Systematic protocol at 2:1, 3:1, trail remainder
Market Scenario Analysis
Scenario A: Continued Equity Strength (70% probability)
Characteristics : Technical momentum sustains institutional accumulation
Winners : YM, NQ, ES (maximize allocation to 85%)
Losers : GC, 6E (extension corrections accelerate)
Strategy : Aggressive equity positioning, complete defensive liquidation
Technical Catalyst : ADX strength maintenance + DEMA alignment
Scenario B: Technical Consolidation (25% probability)
Characteristics : Momentum indicators cool, range-bound trading
Management : Reduce position sizes, use stochastics for timing
Opportunity : Accumulate on pullbacks to institutional levels
Risk Control : Tighter stops, faster profit-taking on strength
Technical Signal : ADX decline below 35, stochastics reset
Scenario C: Technical Breakdown (5% probability)
Trigger : DEMA bearish crosses on primary indices
Action : Emergency position reduction protocols
Management : Systematic liquidation, increase cash to 25%+
Re-entry : Wait for institutional level retests with technical confirmation
Probability : Very low given exceptional institutional backing
Weekly Monitoring Checklist
Daily Technical Assessment
DEMA relationship maintenance across all positions
DMI momentum quality and directional bias confirmation
Stochastics positioning for entry/exit timing optimization
ADX strength validation for trend continuation
Risk Management Verification
Position sizing within 2% account risk per trade
Portfolio heat below 15% total risk exposure
Stop loss proximity to institutional support levels
Profit-taking discipline at predetermined targets
Technical Signal Evolution
Cross-asset momentum convergence/divergence analysis
Stochastics reset opportunities for position optimization
DEMA separation quality for trend strength assessment
Institutional level respect vs violation monitoring
Key Success Factors
Technical Execution Excellence
Signal Clarity : Enhanced visual indicators enable precise timing
Risk Discipline : Systematic adherence to technical signal hierarchy
Momentum Quality : ADX + DMI confirmation prevents false signals
Entry Optimization : Dual stochastics for tactical timing precision
Institutional Integration
Strategic Context : Structure charts provide positioning intelligence
Tactical Timing : Execution charts optimize entry/exit precision
Risk Management : Institutional levels anchor stop placement
Professional Standards : Both frameworks align for optimal decisions
Framework Validation Results
Primary Opportunities : Perfect technical confirmation of institutional intelligence
Risk Identification : Technical signals validate structure chart warnings
Professional Execution : Enhanced indicators enable institutional-grade precision
Capital Preservation : Systematic risk management across all timeframes
Risk Disclaimer : All trading involves substantial risk of loss. Past performance does not guarantee future results. Technical analysis and institutional intelligence frameworks are tools for risk assessment and should not be considered guaranteed predictors of future price movement. Position sizing and risk management protocols must be adjusted based on individual account size, risk tolerance, and market conditions.
Document Status : Active execution framework requiring daily technical monitoring and weekly risk assessment updates. Integration with structure analysis mandatory for optimal decision-making.
Framework Evolution : Enhanced visual indicators and systematic technical analysis represent significant advancement in execution precision. Continuous optimization based on market regime changes and signal quality assessment required.
Multi-Asset Market Analysis & Trade IdeasAnalysis Date : September 10, 2025
Trading Analyst : Institutional Intelligence Framework
Methodology : Dual Renko Chart System with Enhanced Volume Profile Analysis
Executive Summary
Current market analysis reveals exceptional institutional opportunities across equity indices with significant commodity sector divergence. The enhanced institutional intelligence framework identifies unprecedented buying dominance in major equity markets while revealing dangerous extensions in traditional safe-haven assets.
Portfolio Allocation Strategy : 75-85% equity allocation with minimal commodity/currency exposure based on institutional positioning intelligence.
Primary Opportunities (70-85% Total Allocation)
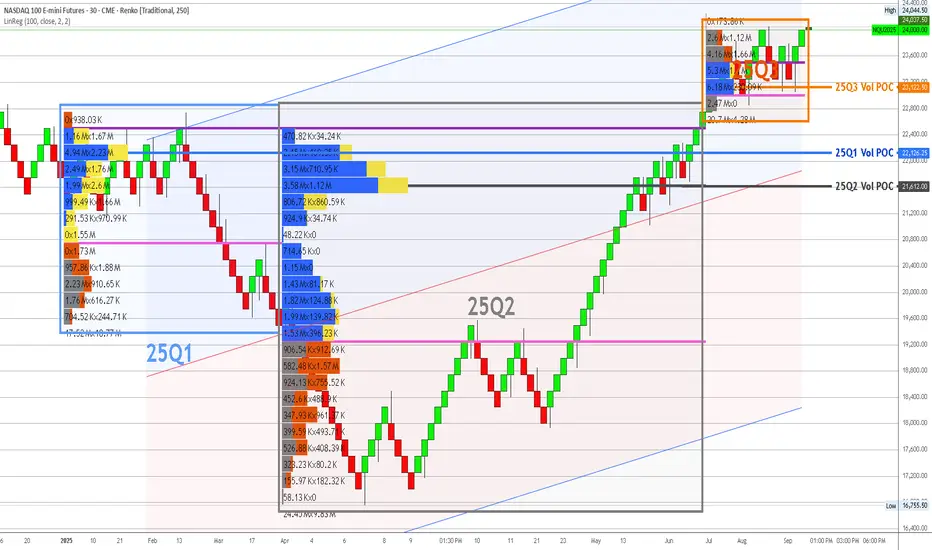
1. NASDAQ 100 (NQ) - 25-30% ALLOCATION
Classification : PRIMARY OPPORTUNITY - Institutional Backing
YTD View:
Institutional Intelligence :
Q3 Volume Analysis : 26.8:1 buying dominance (6.18M UP vs 230.69K DOWN)
Current Position : 23,963 (+3.4% above Q3 POC 23,186)
Support Structure : Exceptional multi-quarter institutional foundation
Risk Assessment : LOWEST RISK - strongest institutional conviction identified
Trade Recommendations :
Bullish Scenario (65% probability) :
Entry : /MNQ at current levels or any pullback to 23,500-23,600
Position Size : Maximum 2.5% account risk per position
Target 1 : 24,500 (close 50% position)
Target 2 : 25,000 (close 25% position)
Target 3 : 25,500+ (trail remaining 25%)
Stop Loss : 23,000 (below Q3 institutional support)
Neutral Scenario (25% probability) :
Range : 23,200-24,200 consolidation
Strategy : Scale into positions on weakness toward 23,400
Management : Hold core position, trade edges of range
Re-evaluation : Weekly basis for breakout confirmation
Bearish Scenario (10% probability) :
Trigger : Break below 23,000 (institutional support failure)
Action : Exit all positions immediately
Re-entry : Require fresh institutional accumulation evidence
Risk Control : Maximum 2% loss on allocation
2. S&P 500 (ES) - 25-30% ALLOCATION
Classification : PRIMARY OPPORTUNITY - Strong Institutional Support
3-QTR View:
YTD View:
Institutional Intelligence :
Q3 Volume Analysis : 5.21:1 buying dominance (11.3M UP vs 2.17M DOWN)
Current Position : 6,550 (+2.7% above Q3 POC 6,375)
Support Structure : Consistent institutional accumulation across quarters
Risk Assessment : LOW RISK - exceptional institutional backing
Trade Recommendations :
Bullish Scenario (70% probability) :
Entry : /MES at current levels or pullback to 6,450-6,500
Position Size : Maximum 2.5% account risk per position
Target 1 : 6,650 (close 50% position)
Target 2 : 6,750 (close 25% position)
Target 3 : 6,850+ (trail remaining 25%)
Stop Loss : 6,300 (below Q3 institutional support)
Neutral Scenario (20% probability) :
Range : 6,400-6,600 consolidation
Strategy : Accumulate on weakness, trim on strength
Management : Maintain core position size
Monitoring : Weekly institutional level respect
Bearish Scenario (10% probability) :
Trigger : Break below 6,300 (institutional support violation)
Action : Systematic position reduction
Stop Loss : 6,250 (complete exit level)
Re-entry : Wait for institutional re-engagement signals
3. DOW JONES (YM) - 20-25% ALLOCATION
Classification : HIGH CONVICTION - YTD POC Validation
3-QTR View:
YTD View:
Institutional Intelligence :
Q3 Volume Analysis : 11.5:1 buying dominance (455.32K UP vs 83.17K DOWN)
YTD POC Alignment : Perfect alignment with Q1 POC at 45,150
Current Position : 45,651 (+1.1% above institutional consensus)
Risk Assessment : VERY LOW RISK - optimal positioning
Trade Recommendations :
Bullish Scenario (75% probability) :
Entry : /MYM at current levels (optimal positioning confirmed)
Position Size : Maximum 2.5% account risk per position
Target 1 : 46,200 (close 40% position)
Target 2 : 46,800 (close 30% position)
Target 3 : 47,500+ (trail remaining 30%)
Stop Loss : 44,800 (below YTD/Q1 POC consensus)
Neutral Scenario (20% probability) :
Range : 45,000-46,000 consolidation around institutional consensus
Strategy : Hold core position, add on dips to 45,200
Management : Optimal risk/reward positioning maintained
Advantage : Minimal downside to institutional support
Bearish Scenario (5% probability) :
Trigger : Break below 45,000 (YTD POC violation)
Action : Reduce position by 50%
Ultimate Stop : 44,500 (complete exit)
Assessment : Highly unlikely given institutional validation
Secondary Opportunities (15-20% Total Allocation)
4. WTI CRUDE OIL (CL) - 15-20% ALLOCATION
Classification : SOLID OPPORTUNITY - Strong Institutional Foundation
3-QTR View:
YTD View:
Institutional Intelligence :
Q3 Volume Analysis : 1.94:1 buying dominance (1.38M UP vs 710.76K DOWN)
Current Position : 63.27 (within Q3 institutional accumulation zone)
Support Structure : Massive Q2 institutional accumulation at 57.50
Risk Assessment : LOW RISK - multiple institutional support layers
Trade Recommendations :
Bullish Scenario (60% probability) :
Entry : /MCL at current levels or pullback to 62.50-63.00
Position Size : Maximum 2% account risk per position
Target 1 : 67.00 (close 50% position)
Target 2 : 69.00 (close 25% position)
Target 3 : 71.00+ (trail remaining 25%)
Stop Loss : 61.50 (below Q3 institutional support)
Neutral Scenario (30% probability) :
Range : 62.00-65.00 consolidation within institutional zone
Strategy : Scale into positions on weakness
Management : Patient accumulation approach
Support : Strong institutional backing provides downside protection
Bearish Scenario (10% probability) :
Trigger : Break below 61.00 (institutional support failure)
Action : Exit positions systematically
Re-entry : 58.00 area (Q2 POC support)
Risk Management : Tight stops due to support proximity
Defensive Positions (8-12% Total Allocation)
5. NATURAL GAS (NG) - 8-12% ALLOCATION
Classification : MODERATE RISK - Declining Institutional Engagement
3-QTR View:
YTD View:
Institutional Intelligence :
Q3 Volume Analysis : Mixed activity with reduced institutional participation
Q1 Peak : 10.6:1 buying dominance (697K UP vs 65K DOWN) - historical high
Current Concern : 65% volume decline from Q1 peaks
Risk Assessment : MODERATE - institutional disengagement evident
Trade Recommendations :
Bullish Scenario (45% probability) :
Entry : Current levels only with tight risk controls
Position Size : Maximum 1.5% account risk per position
Target 1 : 3.40 (close 60% position)
Target 2 : 3.60 (close remaining 40%)
Stop Loss : 2.90 (below Q3 POC support)
Neutral Scenario (35% probability) :
Range : 3.00-3.20 consolidation
Strategy : Avoid new positions, monitor for re-engagement
Management : Maintain defensive positioning
Watch : Volume quality for institutional return
Bearish Scenario (20% probability) :
Trigger : Break below 2.90 (Q3 support failure)
Action : Complete position liquidation
Assessment : Institutional abandonment acceleration
Avoidance : No re-entry until fresh accumulation evidence
Risk Management Positions (8-13% Total Allocation)
6. EURO FUTURES (6E) - 5-8% ALLOCATION
Classification : DEFENSIVE ONLY - Dangerous Extension
3-QTR View:
YTD View:
Institutional Intelligence :
YTD POC Analysis : 1.0525 (aligned with Q1 POC)
Current Position : 1.1769 (+12.9% above institutional consensus)
Extension Risk : DANGEROUS - trading far beyond smart money positioning
Risk Assessment : HIGH RISK - profit-taking territory
Trade Recommendations :
Bullish Scenario (25% probability) :
Entry : AVOID new long positions
Existing Positions : Systematic profit-taking recommended
Target : 1.1850 maximum (close all positions)
Risk : Overextension beyond institutional support
Neutral Scenario (35% probability) :
Range : 1.1650-1.1800 at dangerous extension levels
Strategy : Range trading only with tight stops
Position Size : Maximum 1% account risk
Management : Defensive positioning required
Bearish Scenario (40% probability) :
Trigger : Any breakdown below 1.1700
Target : Return to institutional consensus (1.0525)
Action : Short opportunities on strength
Strategy : Mean reversion to YTD POC likely
7. GOLD FUTURES (GC) - 3-5% ALLOCATION
Classification : EXTREME CAUTION - Maximum Extension
3-QTR View:
YTD View:
Institutional Intelligence :
Extension Analysis : 12.2% above all institutional positioning
Q2 Peak Activity : 11.5:1 buying dominance at 3,430 levels
Current Position : 2,676 (extremely overextended)
Risk Assessment : MAXIMUM RISK - correction vulnerability
Trade Recommendations :
Bullish Scenario (15% probability) :
Entry : AVOID all new long positions
Existing : Immediate profit-taking recommended
Risk : Extreme overextension unsustainable
Management : Defensive exit strategy only
Neutral Scenario (25% probability) :
Range : 2,650-2,700 at unsustainable levels
Strategy : No positioning recommended
Assessment : Range trading too risky given extension
Monitoring : Watch for breakdown signals
Bearish Scenario (60% probability) :
Target : 3,400-3,500 (return to institutional zones)
Correction Magnitude : 12-15% decline likely
Strategy : Short opportunities on any strength
Entry : /MGC shorts on rallies above 2,690
Stop : 2,720 (tight risk control)
Target : 3,450 (institutional accumulation zone)
Risk Management Protocols
Position Sizing Framework
Maximum Risk Per Trade : 2% of account value
Maximum Sector Exposure : 6% (energy, metals, currencies)
Portfolio Heat : Maximum 15% total risk across all positions
Cash Reserve : 5-12% for opportunities and margin requirements
Stop Loss Hierarchy
Tactical Stops : 2-3 Renko blocks on execution charts
Strategic Stops : Below/above institutional POC levels
Emergency Stops : Below major quarterly support levels
Time Stops : Exit if no progress within 15 trading days
Profit Taking Protocol
Systematic Approach :
Target 1 : Close 40-50% of position at 2:1 risk/reward
Target 2 : Close 25-30% of position at 3:1 risk/reward
Target 3 : Trail remaining 20-25% with institutional level stops
Correlation Management
Equity Exposure : Maximum 75-85% combined (NQ+ES+YM)
Commodity Exposure : Maximum 25-30% combined (CL+NG)
Currency Exposure : Maximum 10% (6E only)
Safe Haven Exposure : Maximum 5% (GC defensive only)
Market Scenario Planning
Scenario A: Continued Equity Strength (60% probability)
Characteristics : Institutional accumulation continues, economic resilience
Winners : NQ, ES, YM (maximize equity allocation)
Losers : GC, 6E (extension corrections)
Strategy : Aggressive equity positioning, defensive commodity stance
Scenario B: Market Consolidation (25% probability)
Characteristics : Range-bound trading around institutional levels
Winners : YM (optimal positioning), CL (institutional support)
Neutral : NQ, ES (trade ranges)
Strategy : Reduce position sizes, focus on institutional level trading
Scenario C: Risk-Off Environment (15% probability)
Characteristics : Institutional support failure, flight to quality
Winners : Cash, defensive positioning
Losers : All risk assets
Strategy : Emergency protocols, systematic position reduction
Trigger : Break below major institutional support levels
Weekly Monitoring Checklist
Daily Assessment
Institutional POC level respect across all markets
Volume quality and institutional engagement trends
Position sizing within risk parameters
Stop loss proximity to institutional levels
Weekly Review
Portfolio allocation vs. target percentages
Risk/reward ratios for all open positions
Institutional volume profile evolution
Correlation analysis across positions
Performance tracking vs. benchmarks
Monthly Evaluation
Quarterly volume profile updates
YTD POC alignment reassessment
Strategy performance attribution
Risk management protocol effectiveness
Market regime change identification
Key Success Factors
Institutional Intelligence Priority
Decision Hierarchy :
Institutional volume profile positioning (strategic)
YTD POC alignment validation (tactical)
Technical indicator confirmation (execution)
Risk management protocols (defensive)
Discipline Requirements
Systematic adherence to position sizing formulas
Emotional detachment from individual trade outcomes
Institutional level respect over short-term price action
Professional risk management with systematic protocols
Performance Expectations
Win Rate Target : 55-65% (institutional backing advantage)
Risk/Reward Minimum : 2:1 average across all trades
Maximum Drawdown : <8% of trading capital
Consistency : Positive monthly returns 65%+ of time
Disclaimer : All trading involves risk of loss. Past performance does not guarantee future results. Position sizes and risk management protocols must be adjusted based on individual account size and risk tolerance. This analysis is for educational purposes and should not be considered personalized investment advice.
Document Status : Active trading framework requiring weekly updates and quarterly reassessment.
Gold | Oil | Dollar | Silver | Natural Gas Price ForecastGold | Oil | Dollar | Silver | Natural Gas Price Forecast
COMEX:GC1! COMEX:SI1! AMEX:UNG NYMEX:CL1!

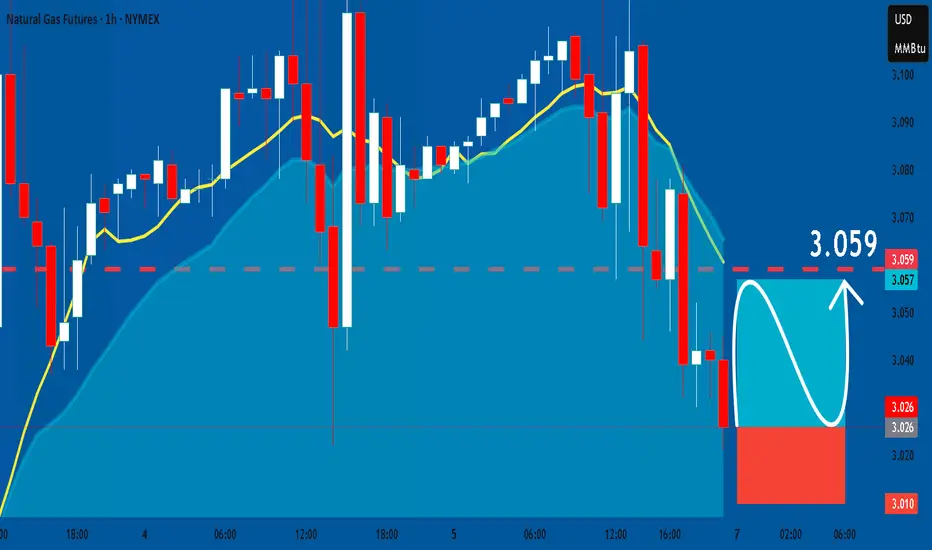
NATGAS: Great Trading Opportunity
NATGAS
- Classic bullish pattern
- Our team expects retracement
SUGGESTED TRADE:
Swing Trade
Buy NATGAS
Entry - 3.026
Stop - 3.010
Take - 3.059
Our Risk - 1%
Start protection of your profits from lower levels
Disclosure: I am part of Trade Nation's Influencer program and receive a monthly fee for using their TradingView charts in my analysis.
❤️ Please, support our work with like & comment! ❤️
NATGAS WILL FALL|SHORT|
✅NATGAS has been growing recently
And the Gas seems locally overbought
So as the pair is approaching
A horizontal resistance of 3.136$
Price decline is to be expected
SHORT🔥
✅Like and subscribe to never miss a new idea!✅
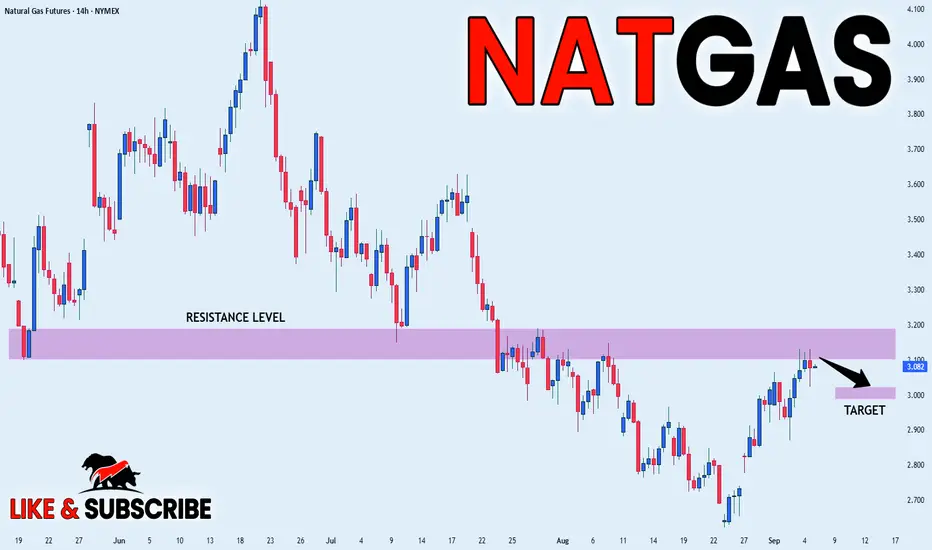
NATGAS Short From Resistance! Sell!
Hello,Traders!
NATGAS went up nicely
And made a retest of
The horizontal resistance
Of 3.148$ so as the Gas
Is locally overbought
We will be expecting a
Local bearish correction
Sell!
Comment and subscribe to help us grow!
Check out other forecasts below too!
Disclosure: I am part of Trade Nation's Influencer program and receive a monthly fee for using their TradingView charts in my analysis.
NATGAS My Opinion! SELL!
My dear subscribers,
My technical analysis for NATGAS is below:
The price is coiling around a solid key level - 3.016
Bias - Bearish
Technical Indicators: Pivot Points Low anticipates a potential price reversal.
Super trend shows a clear sell, giving a perfect indicators' convergence.
Goal - 2.915
About Used Indicators:
By the very nature of the supertrend indicator, it offers firm support and resistance levels for traders to enter and exit trades. Additionally, it also provides signals for setting stop losses
Disclosure: I am part of Trade Nation's Influencer program and receive a monthly fee for using their TradingView charts in my analysis.
———————————
WISH YOU ALL LUCK
Potential Decline of Natural Gas Prices to $2.43–$2.74Brief Overview of Events and News Explaining the Potential Decline of Natural Gas Prices to $2.43–$2.74.
➖ Weather Forecast and Reduced Demand
On April 23, 2025, the U.S. National Weather Service forecasted milder-than-average weather across the U.S. for late spring and early summer 2025, particularly in key gas-consuming regions like the Northeast and Midwest.
Warmer weather reduces the demand for heating, a primary driver of natural gas consumption. This led to a 2.5% decline in Henry Hub natural gas futures, settling at $3.05 per MMBtu on April 24, 2025.
Source: Reuters
➖ High U.S. Natural Gas Inventories
The U.S. Energy Information Administration (EIA) reported on April 17, 2025, that natural gas inventories increased by 75 billion cubic feet (Bcf) for the week ending April 11, 2025, significantly exceeding the five-year average build of 50 Bcf. Total U.S. inventories are now 20% above the five-year average, indicating an oversupply that pressures prices downward.
Source: EIA, "Weekly Natural Gas Storage Report," April 17, 2025
➖ Weak Global LNG Demand
On April 22, 2025, Bloomberg reported a decline in demand for liquefied natural gas (LNG) in Asia, particularly in China, due to an economic slowdown and a shift to cheaper coal alternatives. China’s LNG imports in Q1 2025 dropped 10% year-over-year, reducing export opportunities for U.S. gas producers and adding pressure on domestic prices.
Source: Bloomberg, "China’s LNG Imports Fall as Coal Use Rises," April 22, 2025
Technical Analysis
Natural gas futures (NYMEX) are currently around $3.15 per MMBtu as of April 28, 2025, following a recent decline from a peak of approximately $4.90 in 2025.
Fibonacci retracement levels indicate correction targets at 38.2% ($2.74) and 50% ($2.43).
Fundamental factors, such as oversupply and reduced demand, support a bearish scenario that could drive prices to these levels in the near term.
Nearest Entry Point Target:
• $2.74
Growth Potential:
Long-term:
• $10
Screenshot:

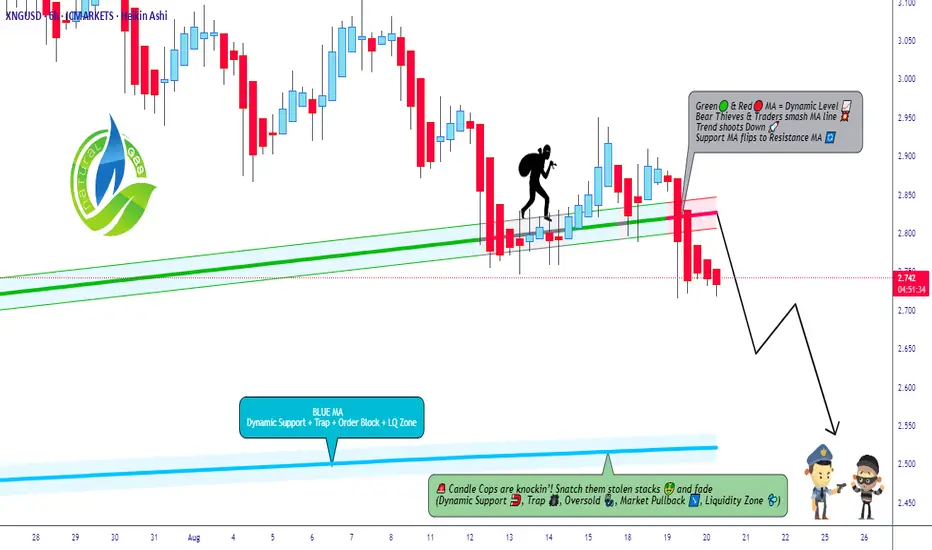
Natural Gas: The Bearish Raid is On! Are You In?🌟 ATTENTION ALL BLACK MARKET TRADERS & NINJA THIEVES! 🌟
(XNG/USD Natural Gas Heist Plan - Bearish Swing/Scalping)
Yo! 🐱👤🤑 The vault doors are creaking open on Natural Gas, and it's time for a BEARISH HEIST! Our intel suggests the big dump is coming. Police ain't around, so let's move! 🚓💨
🦹♂️ THE MASTER HEIST PLAN (BEARISH EDITION)
Asset: XNG/USD (Natural Gas) | Trade Type: Swing / Scalping Heist
Overall Bias: BEARISH 📉👊 (We're stealing on the way DOWN!)
🎯 ENTRY PROTOCOL: THE "LAYER" HEIST
For the OG Thieves who understand patience and precision. We're not chasing; we're setting traps!
🎪 ENTRY: Any price level is a gift! But for the pros, we're setting MULTIPLE SELL LIMIT ORDERS to layer our entry like a true market ninja.
🧨 LAYER 1: 2.740
🧨 LAYER 2: 2.770
🧨 LAYER 3: 2.800
Pro Tip: You can add more layers based on your own capital. More layers, more loot! 💰💰💰
🚨 STOP LOSS (The Getaway Car Engine)
This is where we bail if the cops show up. Don't be a hero.
🛑 THIEF S.L.: @2.950
📢 OG ANNOUNCEMENT: Dear Ladies & Gentleman of the shadow markets, adjust your SL based on your own risk appetite and strategy! Protect your capital! 🛡️
🏁 TARGET (The Escape Route)
The police barricade is set up down below. Our goal is to escape with the stolen money before we hit it!
🎯 T/P 1 (CASH OUT): @2.550 🚗💨
🚧 POLICE BARRICADE: @2.450 (Danger! Avoid this area!)
🔪 SCALPERS, LISTEN UP! 👂
If you're in and out quick, only scalp on the SHORT side. Ride those little downtrends for quick cash. Use a tight trailing stop to protect your mini-loot! 🏃♂️💵
⚠️ HEIST ALERT: NEWS LOCKDOWN 🚫📰
Big news = cops everywhere! It creates chaos and volatility. To avoid getting caught:
AVOID new trades during high-impact news.
USE Trailing Stops to lock in profits on running heists.
STAY STEALTHY. 🐱👤
💣 BOOST THIS IDEA! 💣
It fuels our underground network and helps us find the next perfect heist! Let's drain this market dry together! 🤑🤝❤️🎉
I'll see you in the shadows with the next score. Stay sharp! 🙈🙉🙊