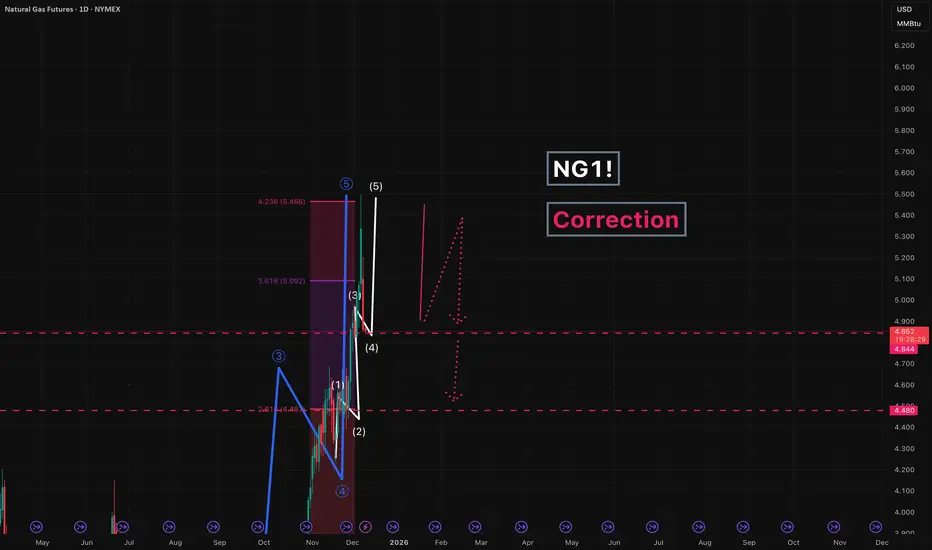
NG1! - Correction NeededFrom January 15 to January 26 of this year, a five-wave impulse was completed. We now expect a correction.
Potential targets:
6.360
5.741
5.204
4.677
The most probable range appears to be between 5.204 - 4.677 or lower, given that this is a commodity.
The exact correction structure will become clear as the move develops.
Estimated movement potential from current levels:
Approximately 4-30%
---
Please subscribe and leave a comment!
You’ll get new information faster than anyone else.
---
NGAS

And that’s all she wrote folks. That was an amazing month everyone. Beautiful short squeeze and unwind. Hope we all made money on all sides. Coming up on contract switch. I think March contract will retrace to at least $3 zone but may go even to $2.8, then continue trend back up to $4. Going to be an interesting contract switch, massive backwardation in effect. Good luck all.

The 2026 Gas Crisis: Texas Freezes and Europe Runs Dry
Going long on March Natural Gas futures at 2.95.
1) Weather Current models (ECMWF and GFS) show the formation of a blocking anticyclone. This is not just a short-term frost, but a prolonged cold that will linger in key consumption regions (Midwest, Northeast) at least until February 5–8.
2) Production Current models show the formation of a blocking anticyclone. This is not just a short-term frost, but a prolonged cold that will linger in key consumption regions at least until February 5–8. If the frost lasts for another 48–72 hours (as confirmed by the AO index), production could fall to 105 Bcf/d. Every lost unit (Bcf) under conditions of record demand is a direct driver of growth.
3) Export Corpus Christi (Train 5): Commissioning work began on the 5th line on January 14. This adds a constant demand of ~0.7 Bcf/d to the system (with potential up to 1.5 Bcf/d at full load). Exports will reach record levels in March.
4) Current Status of European UGS (Underground Gas Storage) Fill level: EU average is ~50.4% – 52% (according to GIE AGSI data). For comparison: at the same time in 2025, the level was above 65%. Due to prolonged cold weather and periods of low wind (Dunkelflaute), storage withdrawals in January are proceeding at rates 1.5–2 times higher than the norm. If Europe ends the winter with 20-25% in UGS, it will have to inject 35–40 billion m³ more gas in the summer than last year. This will create massive demand as early as March-April.
Blocking anticyclones (High-pressure blocking) over Greenland and Scandinavia look stable. This means that the cold pattern in Europe will last at least until February 5–10.
A negative AO "locks" heat over the Atlantic and "pushes" Arctic air masses onto the European continent. This leads to temperature anomalies 5–8°C below normal in Germany, France, and the Benelux countries.
The second cold wave (February) may turn out to be drier and frostier, which is critical for wind generation (Dunkelflaute), forcing power engineers to burn more gas.
We are moving along the lower bound of the historical range. At the current withdrawal rate (~607 million cubic meters per day), Europe risks reaching the 30% level as early as mid-February, which is a month earlier than usual. If current withdrawal rates persist, Europe will reach the 22-24% level by March 31 with a probability of 51%.
SUMMARY European UGS (Germany, France) have dropped to ~42%, the lowest figure in 5 years, and withdrawals are occurring at double speed. Total US demand (January 20–21) hit a historical high of 184 Bcf/d. With current production at 107 Bcf/d, the gap is being covered by massive withdrawals from UGS. The surplus of +106 Bcf (relative to the 5-year norm) that existed on Friday will be completely liquidated by the end of this week. The market is shifting from a state of "surplus" to a state of "massive deficit."
March is currently pricing in the risks that gas might not be sufficient for normal UGS filling in the summer of 2026.

XNG/USD Bullish Retest Play | MA Support Holds🔥 XNG/USD (NATURAL GAS) - BULLISH TRADE OPPORTUNITY 🔥
Natural Gas is showing strength with a confirmed bullish structure! This idea outlines a potential day trade as price retests a key moving average support level.
📈 Trade Plan: Bullish
Idea: Long on any retest/dip, targeting a move towards the next significant resistance.
Rationale: Price action confirms a bullish bias, with the Moving Average acting as dynamic support.
🎯 Key Levels & Execution
✅ Entry Zone: Any price level is considered, but a retest of the MA support offers a favorable risk-reward. Be patient for your setup!
🛑 Stop Loss (Risk Management):
My Personal SL: 4.000
⚠️ IMPORTANT NOTE: This is MY stop loss based on MY risk tolerance and strategy. YOU MUST adjust your SL according to your own capital management rules. Trade at your own risk!
🎯 Take Profit Target: 4.400
This level aligns with a strong resistance zone, overbought signals, and a potential correction area. Secure your profits accordingly!
🔍 Related Pairs & Market Correlations
To get a fuller picture of the Energies market, keep an eye on these key assets:
TVC:USOIL / BLACKBULL:WTI (Crude Oil): 💡 The "big brother" of energy. Often, strength in Crude can pull Natural Gas higher, though the correlation isn't always perfect.
ICMARKETS:XBRUSD (Brent Oil): 🌍 The international energy benchmark. Similar to WTI, its trends can influence sentiment across the entire energy complex.
TVC:DXY (U.S. Dollar Index): 💵 KEY CORRELATION! Since XNG is quoted against the USD (XNG/USD), a weaker Dollar typically bullish for Natural Gas. A stronger Dollar can act as a headwind. Watch the DXY closely!
AMEX:UNG (United States Natural Gas Fund ETF): 📊 A popular ETF that tracks Natural Gas prices. Good for confirming momentum and retail sentiment.
✅ Key Takeaway: A weakening TVC:DXY and strength in TVC:USOIL could provide the perfect tailwinds for this XNG/USD bullish move!
👍 Found this helpful? Give it a LIKE & FOLLOW for more daily trade ideas and insights! 🚀
💬 Comment below with your take on Natural Gas! Let's discuss the setup.

Gas: Bear Trap Sprung. Get Ready for a Short Squeeze +10%Over the weekend, there was a GWDD jump from 344 to 359, which represents a 4.3% increase in expected consumption. 15 GWDD points in January are equivalent to an additional storage withdrawal of ~40–45 Bcf over the forecast period. The main cold is concentrated in the second week of the forecast. This is a golden time for traders, as this period is not yet priced into the market but is already visible to meteorological models.
Additionally, prices will be supported by production, which fell from 110 Bcf to 109.2 Bcf. Any further cooling in Texas could cause wellhead freeze-offs, which would instantly remove another 1-2 Bcf/d from the market; also, terminals are operating at 18.5–19.2 Bcf/d. This is a powerful foundation for the price.
Special attention should be paid to the latest COT report data (as of January 6, published Friday, January 9): the market is in a state of extreme speculative imbalance, with 1,000,000 short positions. Speculators aggressively opened new shorts (+41k contracts) exactly when the price approached the $3.15–$3.18 level. A net short position of 100,000 contracts means that a massive amount of money is bet on a warm winter. GWDD to 359 (+15 over the weekend) is exactly the news that the bears feared most. Given that many entered shorts late Friday, a +4-6% gap on Monday will lead to automatic triggering of stop-losses. Speculators are trapped in record shorts at the very bottom. Monday's opening promises to be volatile; it will not just be growth, but panic closing of short positions.
Those who sold on Friday at $3.20, hoping for $3.00, will see a 359/360 forecast. They have no opportunity for a smooth exit. They will close at market price, buying gas and pushing the price higher. Hedge funds have accumulated -100,000 net short contracts. This is a powder keg. The price increase at the opening will force them to close shorts, which will create a domino effect.
Entry point 3.30 or enter on the first pullback after the gap. Stop Loss $3.20 Take Profit $3.50, $3.58
Idea cancellation: If the 12Z evening run (today) or the 00Z morning run (Monday) shows sharp warming and the GWDD number falls below 352.

Natural Gas on January 26I expect to see short to 3$ at long term.
Nearly targets are 3.75 /3.5/ 3.2
Principal is simple if the SL reached we wanting until it's goes back at the price reached and open the same position. The direction is considered is only on Short scenario

Natural Gas Market Signaling a Fresh Bullish Opportunity?🔥 XNG/USD – Natural Gas Bullish Swing Trade Play | Energy Momentum Setup 🔥
📌 Asset
XNG/USD – NATURAL GAS
Energies & Commodities Market
⏳ Trade Type: Swing Trade
🧭 Market Plan
📈 Bullish Bias Active
Natural Gas is showing upside continuation potential, supported by energy-sector momentum and price acceptance above key demand zones. Bulls are currently in control while volatility expands.
🎯 Entry Strategy
🟢 Flexible Entry Allowed
You may enter from any favorable price level, aligned with your own execution model.
This setup supports scaling or single-entry styles, depending on risk preference.
🛑 Stop Loss
🔻 Reference SL: 3.500
⚠️ Risk Note:
Dear Ladies & Gentlemen (Thief OG’s),
This is not a mandatory stop loss. Always adjust your SL based on:
Position size
Volatility
Personal risk management rules
💡 Capital protection comes first.
🏆 Profit Targets
🎯 Target 1: 4.500
🎯 Target 2: 5.200
📊 Why Take Profits Here?
Strong historical resistance zones
Overbought conditions likely near targets
Liquidity traps often appear at these levels
➡️ Book profits smartly and don’t get greedy.
⚠️ TP Disclaimer:
This is a guideline, not a command. Secure profits based on your own strategy.
👀 Related Assets to Watch (Correlation Check)
⛽ WTI Crude Oil (USOIL / WTI)
Positive sentiment in energy markets often supports Natural Gas
Rising oil prices can lift overall energy demand expectations
🛢️ Brent Crude (UKOIL)
Global energy benchmark
Strength in Brent usually confirms broad energy-sector bullishness
🇺🇸 DXY – U.S. Dollar Index
Natural Gas is USD-denominated
Weak USD = tailwind for commodities
Strong USD may slow upside momentum
📊 Energy Sector Index / Energy Stocks
Institutional flows into energy equities often precede commodity strength
Watch for sector-wide risk-on behavior
🧠 Final Notes
✅ Trade with confirmation
✅ Respect volatility
✅ Manage risk aggressively
✅ Profits > Ego
If this idea adds value, hit 👍 Like, 💬 Comment, and ⭐ Follow to stay ahead of smart money moves.
Trade safe & trade sharp. 🚀💰


Natural Gas (NG): The Freestyle Framework Natural Gas: The Freestyle Landscape
This is not a forecast. It is a dynamic structural map.
Designed for the discretionary trader, this "Freestyle" framework deconstructs Natural Gas into its core technical components: cyclical rhythms, evolving Elliott Wave structures, adaptive price channels, and multi-layered zones of confluence.
We provide the architecture; you dictate the strategy.
Within This Framework, You Will Identify:
- Cyclical Turning Nodes: Time-based projections where trend exhaustion or acceleration is statistically heightened.
- Price Channel Evolution: Visualizing the market's breathing pattern through expanding and contracting volatility corridors.
- Confluence Zones: High-Probability regions where support/resistance, Fibonacci projections, and channel boundaries cluster, defining the market's true decision points.
- Momentum & Risk Gradients: Areas shaded for potential trend acceleration or reversal, framing asymmetric risk/reward opportunities.
The Core Philosophy: Trade Context, Not Clarity.
This map eliminates the noise of directional bias. Instead, it provides a professional-grade canvas to:
Plan high-probability setups within predefined zones.
Anticipate volatility shifts before they occur.
Objectively manage risk by highlighting invalidation levels.
Align your unique strategy (swing, position) with the market's inherent structure.
Disclaimer: This analysis is for informational and educational purposes only. It is a framework for context, not a substitute for independent analysis. All trading decisions and risk management are solely the responsibility of the individual. Past performance is not indicative of future results.
Trade The Reaction. Navigate The Structure.

NG1! - correctionWe are currently correcting the impulsive move in Natural Gas.
First, we expect a pullback toward 4.850 (a move that is already in progress), followed by a continuation down into the 4.480 area.
---
Please subscribe and leave a comment.
You’ll get new information faster than anyone else.
---
Natural Gas Bulls Eye 5.000 as Market Shows Overbought Trap🔥 NATURAL GAS DAY TRADE BLUEPRINT — BULLS TARGETING THE 5.000 ZONE! 🔥
**📈 XNG/USD — “NATURAL GAS” Commodities CFD
Market Trade Opportunity Guide (Day Trade)**
🧭 TRADE PLAN (Bullish Momentum Outlook)
Asset: XNG/USD “NATURAL GAS”
Plan: Bullish
Entry: Any price level based on your strategy
🛡️ STOP LOSS SETUP
Stop Loss: This is thief SL @ 4.700
Dear Ladies & Gentleman (Thief OG's), adjust your SL based on your own strategy & your risk conditions.
Note: Dear Ladies & Gentleman (Thief OG's), I am not recommending to set only my SL. It’s your choice — you make money & take money at your own risk.
🎯 TARGET ZONE
Police barricade acts as a strong resistance + market is overbought + a trap is visible, so escape with profits.
OUR Target: 5.000
Note: Dear Ladies & Gentleman (Thief OG's), I am not recommending to set only my TP. It’s your choice — you make money & take money at your own risk.
🔗 RELATED PAIRS TO WATCH (Correlation & Key Notes)
Here are highly relevant pairs connected to Natural Gas through USD strength, risk sentiment, energy market flows, and commodity-currency behavior:
1️⃣ USD/CAD (🇺🇸 USD vs 🇨🇦 CAD)
🔑 Key Points / Correlation:
Canada is a major energy exporter, so CAD often strengthens when energy (including Natural Gas) rises.
If XNG/USD pumps, CAD may gain → USD/CAD can show downside pressure.
Watch for correlation shifts during high-impact USD news.
2️⃣ WTI Crude Oil – USOIL (🛢️ Energy Sector Lead Indicator)
🔑 Key Points / Correlation:
Oil and Natural Gas are part of the same energy complex; they often move in tandem.
Strong oil = strong sentiment for energy markets.
If USOIL is bullish, it often supports XNG upside continuation.
3️⃣ DXY – US Dollar Index (💵 USD Strength Barometer)
🔑 Key Points / Correlation:
XNG/USD is priced in USD.
Strong DXY = natural gas usually corrects.
Weak DXY = commodity prices typically lift.
Always check DXY trend before entering Natural Gas trades.
4️⃣ EUR/USD (💶 Major USD Flow Indicator)
🔑 Key Points / Correlation:
Higher EUR/USD = weaker USD = bullish pressure on XNG/USD.
When EUR/USD is rising strongly, most USD-denominated commodities get a tailwind.
5️⃣ USD/CHF (🇺🇸 USD vs 🇨🇭 CHF — Safe-Haven Gauge)
🔑 Key Points / Correlation:
Natural Gas rises during risk-on conditions.
USD/CHF dropping signals safe-haven outflow → adds strength to commodity markets like XNG.
6️⃣ GBP/USD (🇬🇧 GBP vs USD — USD Sentiment Mirror)
🔑 Key Points / Correlation:
GBP/USD rising = weaker USD = supports Natural Gas bullish legs.
Acts as a secondary USD trend confirmation pair.
7️⃣ AUD/USD (🇦🇺 Commodity Currency Pair)
🔑 Key Points / Correlation:
AUD is a commodity-linked currency; rises when global commodities strengthen.
AUD/USD strength can confirm an overall commodity-bullish environment supporting XNG upside.
📌 FINAL NOTE
Trade smart, monitor correlations, and adjust risk according to your own strategy — protect capital first, profit next. 🔥📊

We would buy quite a lot of NATGAS when $2 levels are reachedWe hope the price will go down so we can buy cheaper

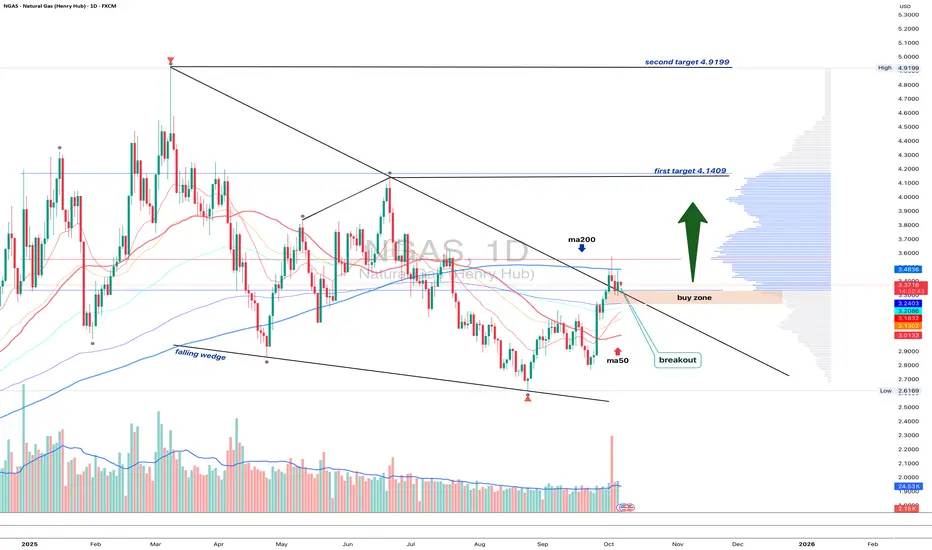
NGAS 1D - bulls waiting for the green lightOn the daily chart, Natural Gas has broken out of a falling wedge, but price remains below the MA200, while EMA still hovers above it - a mixed signal showing short-term hesitation within a longer-term downtrend.
The 3.10–3.20 buy zone remains key - that’s where the retest area aligns with short-term support. If buyers can reclaim the EMA and push above the MA200, the next upside targets are 4.14 and then 4.92.
Volume on the breakout supports growing bullish interest, while fundamentals - like rising seasonal demand - may soon add more fuel to the move.
Tactically , watch how price behaves near MA200. Once EMA flips back on top, momentum could accelerate fast. Until then, the market’s like a gas burner waiting for that click - ignition pending
Natural gas Near expiration, the spread between spots and future is about 1000 pounds, it may goes to ranges between 3.5-3 7. But near target is about 3 95

Profit Blueprint on XNG/USD! Is This the Bullish Energy Move?😎 Steal the Show with XNG/USD: The "Thief" Day Trade Blueprint! 🚨
Asset: XNG/USD (Natural Gas CFD) - Energies MarketVibe: A cheeky, calculated heist to snag profits with a slick Ichimoku breakout strategy! 💰
📜 The Master Plan: Ichimoku Kijun Line Breakout
🎯 Confirmed Bull Trend: The price has broken above the Ichimoku Kijun-Sen line, signaling a bullish move in the Natural Gas CFD market. This breakout is our green light to execute the "Thief Strategy" with precision!
🕵️♂️ Entry: The Thief’s Layered Approach
🔍 How It Works: The "Thief Strategy" uses a layering method with multiple buy limit orders to scale into the trade safely, protecting your capital while maximizing profit potential. No fear, just finesse! 😎
Buy Limit Layers:
🥉 2.960
🥈 2.980
🥇 3.000
🏆 3.020
💡 Pro Tip: Add more layers based on your risk appetite and account size for extra flexibility!
Alternative Entry: If you prefer a single entry, jump in at the current market price after the Kijun-Sen breakout confirmation. Your call, Thief OG! 😏
🛑 Stop Loss: Protect Your Loot!
🚨 Thief Stop Loss: Set at 2.900, just below the breakout level to guard against reversals.
Customize It: Adjust your stop loss based on your risk tolerance and strategy. This is your heist—own it!
Note: Dear Thief OG’s (Ladies & Gentlemen), I’m not dictating your stop loss. Manage your risk and keep your profits safe! 💪
🎯 Target: Escape Before the Trap!
🏃♂️ Profit Target: Aim for 3.150, where strong resistance, overbought conditions, and a potential trap await. Cash out before the "police" (market reversal) catch you!
Note: You’re the mastermind here. Take profits at your own discretion—don’t let me cap your gains! 💸
🔗 Correlation & Related Markets to Watch
Natural Gas (XNG/USD) often correlates or reacts with:
ICMARKETS:XBRUSD (Crude Oil Brent) – Energy sector movements can impact gas demand.
FOREXCOM:USOIL (Crude Oil WTI) – Supply/demand shocks in oil can spill into gas pricing.
OANDA:XAUUSD (Gold) – Inflation hedge & safe-haven flows can influence energy sentiment indirectly.
TVC:DXY (US Dollar Index) – A stronger/weaker dollar impacts commodity pricing.
SP:SPX (S&P 500 Index) – Risk-on/risk-off sentiment across markets.
Keeping an eye on these pairs helps confirm energy market momentum and macro sentiment.
Key Correlation Point: Natural Gas prices often lead or lag other energy markets due to supply/demand dynamics and seasonal factors. Confirm your trade with cross-asset analysis for a sharper edge! 📊
🧠 Why This Setup Rocks
Ichimoku Precision: The Kijun-Sen breakout is a reliable signal for short-term bullish momentum.
Layered Entry Safety: The Thief Strategy’s multiple limit orders spread risk and allow scaling without overcommitting.
Risk Management: Clear stop loss and target levels keep your heist disciplined and profitable.
Market Context: Energy markets are volatile, but this setup leverages technical confirmation to ride the wave. 🌊
✨ If you find value in my analysis, a 👍 and 🚀 boost is much appreciated — it helps me share more setups with the community!
#ThiefStrategy #XNGUSD #NaturalGas #Ichimoku #DayTrading #EnergyMarkets #TradingView

The Natural Gas Will Jump from a Support LevelHello Traders
In This Chart Natural Gas HOURLY Forex Forecast By FOREX PLANET
today Natural Gas analysis 👆
🟢This Chart includes_ (Natural Gas market update)
🟢What is The Next Opportunity on Natural Gas Market
🟢how to Enter to the Valid Entry With Assurance Profit
This CHART is For Trader's that Want to Improve Their Technical Analysis Skills and Their Trading By Understanding How To Analyze The Market Using Multiple Timeframes and Understanding The Bigger Picture on the Charts
Natural Gas Market Outlook ‖ Bullish Breakout with Risk Control💎 XNG/USD Natural Gas – Thief Trader’s Money Loot Plan (Swing/Scalping) 💎
🎯 Trade Plan (Bullish Setup)
Strategy: Bullish triangular moving average breakout, aligned with Fibonacci 0.382 level.
Entry (Layered Style): Using multiple limit orders (Thief layering strategy). Example entries:
$2.900
$2.950
$3.000
(You may add more layers depending on your risk appetite.)
Stop Loss: $2.800 (Thief SL).
⚠️ Note: Adjust SL based on your own risk tolerance and strategy.
Target Zone: Major seller pressure expected near $3.400 — our escape target set at $3.200.
📌 Reminder: Take profit at your own discretion — you control your loot, not me.
❓ Why This Setup?
✅ Technical Basis: Bullish triangle breakout + Fibonacci 0.382 retracement signals continuation upside.
✅ Layered Entry Advantage: Reduces risk by scaling in across levels, catching volatility without FOMO.
✅ Market Structure: Current consolidation near $2.93 provides a solid base for accumulation.
✅ Sentiment Balance: Both retail & institutional lean bullish, supporting potential breakout momentum.
✅ Macro Tailwinds: Strong LNG export growth and expected winter heating demand underpin the long thesis.
This plan aligns both short-term technicals and long-term fundamentals, creating a high-probability swing/scalping opportunity.
🌟 Natural Gas (XNG/USD) Market Report - September 3, 2025 🌟
📊 Current Price Snapshot
Spot Price: $2.93 per MMBtu (Henry Hub benchmark) 📉
(Holding steady after recent dips, reflecting balanced supply/demand.)
😊 Trader Sentiment Outlook
Retail Traders: 55% Bullish 🟢 | 35% Bearish 🔴 | 10% Neutral ⚪
(Optimism from LNG demand + weather, but some concern on inventories.)
Institutional Traders: 60% Bullish 🟢 | 30% Bearish 🔴 | 10% Neutral ⚪
(Focused on exports & production stability, while cautious on oversupply.)
📌 Overall Mood: Mildly positive — upside potential if weather demand rises.
😨 Fear & Greed Index
Current Level: Neutral (Score ~50/100) ⚖️
Fear factors: Storage 5% above 5-year avg, mild summer demand.
Greed drivers: LNG exports + winter demand expectations.
Market vibe = balanced — neither panic selling nor euphoric buying.
📈 Fundamental & Macro Score
Fundamental Score: 7/10 🟢
Strong LNG shipments (31% growth expected).
Inventories manageable, production +3% YoY.
Key watch: Permian & Haynesville supply shifts.
Macro Score: 8/10 🟢
Rising global energy needs (AI, data centers).
Autumn cooling trend boosts heating demand.
Asia’s growth keeps exports flowing.
🚀 Overall Market Outlook
Bias: Bullish (Long) 🟢📈 — ~60% confidence.
Natural gas could push toward $3.60/MMBtu by late 2025 if balances tighten and exports expand.
Winter could spark extra upside rallies ❄️🔥.
🔗 Related Pairs to Watch
FXOPEN:XNGUSD
NYMEX:NG1!
ICMARKETS:XBRUSD (Brent Crude)
FOREXCOM:USOIL (WTI Crude Oil)
OANDA:XAUUSD (Gold for risk hedge)
TVC:DXY (US Dollar Index – inverse correlation play)
✨ “If you find value in my analysis, a 👍 and 🚀 boost is much appreciated — it helps me share more setups with the community!”
#XNGUSD #NaturalGas #SwingTrading #Scalping #CommodityTrading #EnergyMarkets #Fibonacci #BreakoutStrategy #LayeringStrategy #TradingViewAnalysis #ThiefTrader
NGAS - UniverseMetta - Signal#NGAS - UniverseMetta - Signal
D1 - Formation of potential 3rd wave + retest of trend line. Stop behind minimum of 2nd wave.
Entry: 2.9979
TP: 3.1945 - 3.5475 - 3.7752 - 4.1294
Stop: 2.8858

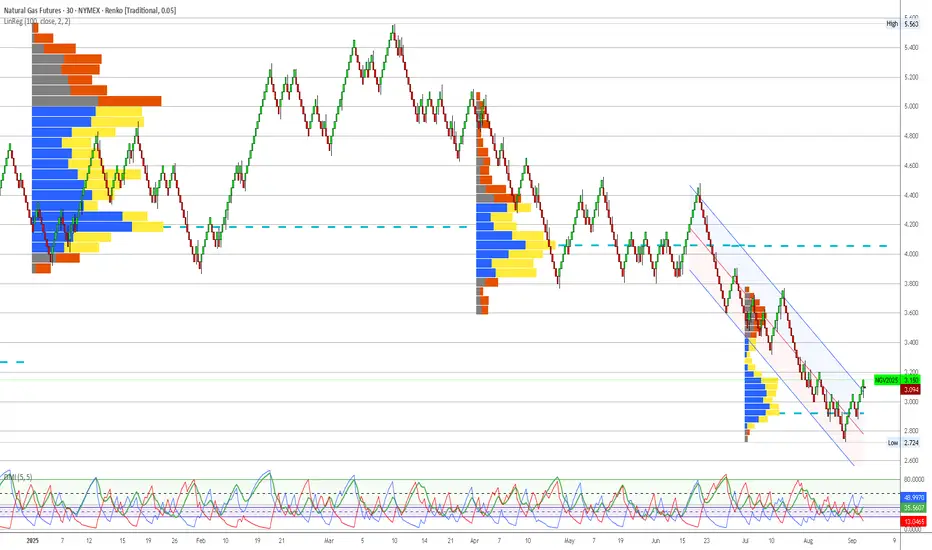
Natural Gas (NG) - Technical Analysis Report - 20250908Analysis Date: September 8, 2025
Current Price: $3.125
Market Session: Post-Market Analysis
---
Executive Summary
Natural Gas presents the highest conviction opportunity in the current market environment, with exceptional alignment between institutional positioning and technical momentum. The quarterly volume profile reveals massive institutional accumulation at current levels, while execution chart signals confirm a validated reversal pattern. This represents a classic institutional intelligence-based setup with superior risk/reward characteristics.
---
Quarterly Volume Profile Analysis
Institutional Positioning Intelligence
The quarterly volume profile (Q3 2025) displays the most compelling institutional accumulation pattern across all analyzed markets:
Primary Institutional Accumulation Zone: $2.90-$3.15
Extraordinary blue volume concentration representing massive institutional positioning
Current price ($3.125) sits in the optimal zone within this accumulation area
Volume density indicates sustained institutional commitment over extended period
Width and intensity of blue volume suggests major strategic positioning campaign
Volume Profile Architecture:
Core Accumulation: $3.00-$3.10 (heaviest institutional activity)
Extended Support: $2.90-$3.00 (secondary institutional positioning)
Breakout Level: $3.15-$3.20 (upper boundary of accumulation zone)
Void Zone: Below $2.85 (minimal institutional interest, evacuation territory)
Resistance Structure Analysis:
$3.25-$3.40: First institutional resistance with mixed volume
$3.60-$3.80: Moderate yellow volume indicating previous distribution
$4.00+: Historical distribution zones from earlier 2025 highs
Price Structure Context
Historical Pattern Recognition:
The current Natural Gas setup mirrors successful commodity reversal patterns, particularly the proven crude oil institutional accumulation model. The exceptional width and intensity of institutional volume at current levels suggests this represents a major strategic allocation by smart money participants.
Critical Structure Validation:
Institutional Floor: $2.90 represents absolute lower boundary of smart money positioning
Volume Point of Control: $3.05 shows peak institutional activity within accumulation zone
Conviction Level: Volume density indicates highest institutional commitment in analyzed market set
Risk Definition: Clear institutional boundaries provide precise risk management parameters
Seasonal and Fundamental Context
Seasonal Dynamics Supporting Institutional Positioning:
September-October: Transition into heating season demand
Storage injection season ending: Supply/demand dynamics shifting
Winter weather preparation: Industrial and residential demand increases
Power generation demand: Continued baseload electricity requirements
---
Execution Chart Technical Analysis
Current Technical Configuration - BULLISH ALIGNMENT
DEMA Analysis - CONFIRMED BULLISH SIGNAL:
Black Line (Fast DEMA 12): Currently at $3.14
Orange Line (Slow DEMA 20): Currently at $3.10
Configuration: Strong bullish crossover confirmed and expanding
Trend Bias: Technical momentum strongly bullish, aligned with institutional positioning
DMI/ADX Assessment - STRONG TRENDING CONDITIONS:
ADX Level: 44+ indicating powerful directional movement
+DI vs -DI: +DI clearly dominant over -DI
Momentum Direction: Confirming sustained bullish bias
Trend Strength: Exceptional ADX reading suggests institutional conviction
Stochastic Analysis - MOMENTUM CONFIRMATION:
Tactical Stochastic (5,3,3): Bullish configuration with room for extension
Strategic Stochastic (50,3,3): Confirming longer-term bullish momentum
Divergence Analysis: No negative divergences, clean momentum structure
Support and Resistance Levels
Immediate Technical Levels:
Current Support: $3.075 (DEMA 20 orange line)
Key Support: $3.00 (institutional accumulation core)
Major Support: $2.95 (institutional floor approach)
Immediate Resistance: $3.20 (accumulation zone breakout)
Key Resistance: $3.30 (first institutional resistance)
Major Resistance: $3.50 (significant distribution zone)
---
Trading Scenarios and Setup Criteria
Scenario 1: Continuation Long Setup (PRIMARY)
Optimal Conditions for Long Entry:
DEMA bullish maintenance: Black line remaining above orange line
DMI confirmation: +DI sustaining dominance over -DI
ADX persistence: Maintaining strong trending conditions above 40
Volume respect: Price holding above $3.00 institutional core
Momentum alignment: All timeframes confirming bullish bias
Entry Protocol:
Primary Entry: Current levels $3.10-$3.15 (within institutional accumulation)
Secondary Entry: $3.00-$3.05 on any pullback to core accumulation
Position Sizing: Full 2% account risk given exceptional setup quality
Stop Loss: Below $2.90 (institutional floor violation)
Profit Targets:
Target 1: $3.35 (first institutional resistance) - Take 40% profits
Target 2: $3.60 (major resistance zone) - Take 30% profits
Target 3: $3.80-$4.00 (distribution zone approach) - Trail remaining 30%
Scenario 2: Pullback Accumulation Setup (SECONDARY)
Conditions for Pullback Entry:
Price retracement to $3.00-$3.05 core accumulation zone
DEMA holding bullish configuration during pullback
Stochastic oversold providing tactical entry signal
Volume profile respect at institutional support levels
Pullback Setup Parameters:
Entry Range: $3.00-$3.05 (core institutional accumulation)
Stop Loss: Below $2.90 (institutional positioning violation)
Targets: Same as primary scenario with enhanced risk/reward
Position Sizing: Maximum allocation given superior entry point
Scenario 3: Breakout Acceleration Setup (AGGRESSIVE)
Breakout Trading Framework:
Breakout Level: Above $3.20 (accumulation zone upper boundary)
Volume Confirmation: Increased volume supporting breakout move
Technical Validation: DEMA gap expansion confirming momentum
Momentum Persistence: ADX remaining above 40 with +DI dominance
Breakout Parameters:
Entry: $3.22-$3.25 on confirmed breakout
Stop: Below $3.10 (failed breakout)
Accelerated Targets: $3.50, $3.75, $4.00+
Position Management: Trail stops using institutional levels
---
Risk Management Protocols
Position Sizing Guidelines
Aggressive Approach (Recommended for NG):
Maximum Risk: 2.5% of account (increased allocation due to exceptional setup quality)
Contract Calculation: Account Size × 0.025 ÷ (Stop Distance × $10)
Example: $100,000 account with $0.25 stop = 1,000 contracts maximum
Rationale: Highest conviction setup justifies maximum allocation
Stop Loss Hierarchy
Tactical Stop: $3.05 (execution chart support)
Strategic Stop: $2.95 (institutional accumulation boundary)
Emergency Stop: $2.85 (institutional floor violation)
Profit Management Framework
Systematic Profit Taking:
First Target (40%): Lock in profits at institutional resistance
Second Target (30%): Capture extended move through distribution zones
Final Position (30%): Trail for potential acceleration beyond $4.00
Trail Stop Method: Use $0.05 structure chart levels once in profit
---
Market Context and External Factors
Fundamental Catalysts Supporting Bullish Thesis
Supply/Demand Dynamics:
Storage levels approaching seasonal norms
Production discipline from major operators
Export capacity utilization supporting demand
Power generation baseload requirements
Seasonal Factors:
Heating season demand preparation (September-October)
Industrial consumption patterns shifting higher
Weather derivatives market positioning for winter volatility
LNG export commitments providing demand floor
Technical Market Structure
Commitment of Traders Alignment:
Commercial hedgers reducing short positions
Large speculators building long exposure
Small traders exhibiting contrarian pessimism (bullish indicator)
Open interest expansion confirming institutional participation
---
Monitoring Checklist and Alert Levels
Daily Monitoring Requirements
DEMA Configuration: Maintain bullish black above orange relationship
Institutional Respect: Confirm price behavior above $3.00 core zone
Volume Analysis: Monitor for any changes in accumulation patterns
External Events: EIA storage reports, weather forecasts, export data
Correlation Tracking: Monitor relationship with heating oil and power prices
Critical Alert Levels
Bullish Escalation Alerts:
Break above $3.20 with volume expansion
DEMA gap expansion indicating acceleration
+DI moving above 40 with ADX persistence above 50
Weather forecasts showing early cold patterns
Risk Management Alerts:
DEMA bearish crossover (black below orange)
Break below $3.00 institutional core support
ADX declining below 30 indicating momentum loss
Negative storage surprise significantly above expectations
---
Strategic Outlook and Conviction Assessment
Risk/Reward Analysis
Exceptional Setup Characteristics:
Risk: $0.25 to institutional floor ($2.90)
Reward: $0.50+ to first major resistance ($3.60+)
Risk/Reward Ratio: 2:1 minimum, potential 3:1+
Probability Assessment: High (75%+) based on institutional alignment
Portfolio Allocation Recommendation
Maximum Conviction Positioning
Natural Gas represents the highest quality setup in the current market environment. The exceptional alignment between institutional accumulation and technical momentum, combined with supportive seasonal factors, justifies maximum allocation within risk management parameters. This setup exemplifies institutional intelligence-based trading at its finest - clear smart money positioning validated by technical execution signals.
Allocation Framework:
Primary Portfolio Weight: 35-40% (maximum conviction)
Entry Method: Scaled entry over 2-3 trading sessions
Hold Period: Expect 2-6 week position duration
Exit Strategy: Systematic profit-taking at institutional resistance levels
---
Conclusion and Strategic Assessment
Natural Gas presents a textbook example of institutional intelligence confirmed by technical momentum. The massive quarterly accumulation zone, combined with validated execution chart signals, creates optimal conditions for systematic position building. Current positioning within the institutional sweet spot offers exceptional risk/reward characteristics with clearly defined parameters for both profit-taking and risk management.
Implementation Priority: Immediate action recommended - this setup quality rarely presents itself with such clear institutional validation and technical confirmation.
Next Review: Daily monitoring of DEMA configuration and institutional level respect
Position Management: Systematic profit-taking protocol with trailing stops at institutional levels
---
Important Disclaimer
Risk Warning and Educational Purpose Statement
This analysis is provided for educational and informational purposes only and does not constitute financial advice, investment recommendations, or trading signals. All trading and investment decisions are solely the responsibility of the individual trader or investor.
Key Risk Considerations:
Futures trading involves substantial risk of loss and is not suitable for all investors
Past performance does not guarantee future results
Market conditions can change rapidly, invalidating any analysis
Leverage can amplify both profits and losses significantly
Individual financial circumstances and risk tolerance vary greatly
Professional Guidance: Before making any trading decisions, consult with qualified financial advisors, conduct your own research, and ensure you fully understand the risks involved. Only trade with capital you can afford to lose.
Methodology Limitations: Volume profile analysis and technical indicators are tools for market assessment but are not infallible predictors of future price movement. Market dynamics include numerous variables that cannot be fully captured in any single analytical framework.
The views and analysis presented represent one interpretation of market data and should be considered alongside other forms of analysis and individual judgment.
Potential Decline of Natural Gas Prices to $2.43–$2.74Brief Overview of Events and News Explaining the Potential Decline of Natural Gas Prices to $2.43–$2.74.
➖ Weather Forecast and Reduced Demand
On April 23, 2025, the U.S. National Weather Service forecasted milder-than-average weather across the U.S. for late spring and early summer 2025, particularly in key gas-consuming regions like the Northeast and Midwest.
Warmer weather reduces the demand for heating, a primary driver of natural gas consumption. This led to a 2.5% decline in Henry Hub natural gas futures, settling at $3.05 per MMBtu on April 24, 2025.
Source: Reuters
➖ High U.S. Natural Gas Inventories
The U.S. Energy Information Administration (EIA) reported on April 17, 2025, that natural gas inventories increased by 75 billion cubic feet (Bcf) for the week ending April 11, 2025, significantly exceeding the five-year average build of 50 Bcf. Total U.S. inventories are now 20% above the five-year average, indicating an oversupply that pressures prices downward.
Source: EIA, "Weekly Natural Gas Storage Report," April 17, 2025
➖ Weak Global LNG Demand
On April 22, 2025, Bloomberg reported a decline in demand for liquefied natural gas (LNG) in Asia, particularly in China, due to an economic slowdown and a shift to cheaper coal alternatives. China’s LNG imports in Q1 2025 dropped 10% year-over-year, reducing export opportunities for U.S. gas producers and adding pressure on domestic prices.
Source: Bloomberg, "China’s LNG Imports Fall as Coal Use Rises," April 22, 2025
Technical Analysis
Natural gas futures (NYMEX) are currently around $3.15 per MMBtu as of April 28, 2025, following a recent decline from a peak of approximately $4.90 in 2025.
Fibonacci retracement levels indicate correction targets at 38.2% ($2.74) and 50% ($2.43).
Fundamental factors, such as oversupply and reduced demand, support a bearish scenario that could drive prices to these levels in the near term.
Nearest Entry Point Target:
• $2.74
Growth Potential:
Long-term:
• $10
Screenshot:

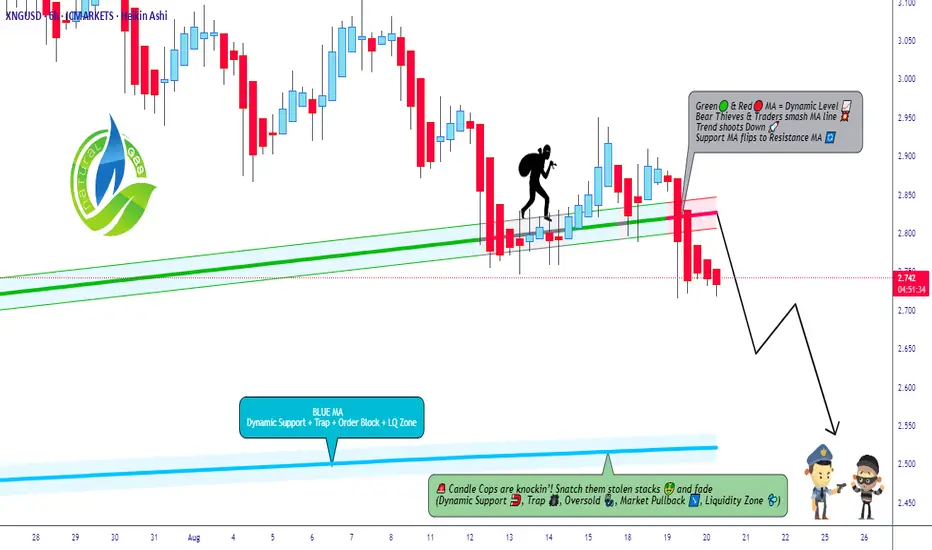
Natural Gas: The Bearish Raid is On! Are You In?🌟 ATTENTION ALL BLACK MARKET TRADERS & NINJA THIEVES! 🌟
(XNG/USD Natural Gas Heist Plan - Bearish Swing/Scalping)
Yo! 🐱👤🤑 The vault doors are creaking open on Natural Gas, and it's time for a BEARISH HEIST! Our intel suggests the big dump is coming. Police ain't around, so let's move! 🚓💨
🦹♂️ THE MASTER HEIST PLAN (BEARISH EDITION)
Asset: XNG/USD (Natural Gas) | Trade Type: Swing / Scalping Heist
Overall Bias: BEARISH 📉👊 (We're stealing on the way DOWN!)
🎯 ENTRY PROTOCOL: THE "LAYER" HEIST
For the OG Thieves who understand patience and precision. We're not chasing; we're setting traps!
🎪 ENTRY: Any price level is a gift! But for the pros, we're setting MULTIPLE SELL LIMIT ORDERS to layer our entry like a true market ninja.
🧨 LAYER 1: 2.740
🧨 LAYER 2: 2.770
🧨 LAYER 3: 2.800
Pro Tip: You can add more layers based on your own capital. More layers, more loot! 💰💰💰
🚨 STOP LOSS (The Getaway Car Engine)
This is where we bail if the cops show up. Don't be a hero.
🛑 THIEF S.L.: @2.950
📢 OG ANNOUNCEMENT: Dear Ladies & Gentleman of the shadow markets, adjust your SL based on your own risk appetite and strategy! Protect your capital! 🛡️
🏁 TARGET (The Escape Route)
The police barricade is set up down below. Our goal is to escape with the stolen money before we hit it!
🎯 T/P 1 (CASH OUT): @2.550 🚗💨
🚧 POLICE BARRICADE: @2.450 (Danger! Avoid this area!)
🔪 SCALPERS, LISTEN UP! 👂
If you're in and out quick, only scalp on the SHORT side. Ride those little downtrends for quick cash. Use a tight trailing stop to protect your mini-loot! 🏃♂️💵
⚠️ HEIST ALERT: NEWS LOCKDOWN 🚫📰
Big news = cops everywhere! It creates chaos and volatility. To avoid getting caught:
AVOID new trades during high-impact news.
USE Trailing Stops to lock in profits on running heists.
STAY STEALTHY. 🐱👤
💣 BOOST THIS IDEA! 💣
It fuels our underground network and helps us find the next perfect heist! Let's drain this market dry together! 🤑🤝❤️🎉
I'll see you in the shadows with the next score. Stay sharp! 🙈🙉🙊
"NATURAL GAS PRICE THEFT IN PROGRESS – JOIN THE HEIST!"🔥 XNG/USD HEIST – BEARISH LOOT AWAITS! SWIPE & ESCAPE BEFORE THE COPS ARRIVE! 🔥
🌍 Greetings, Fellow Market Robbers! (Hola! Oi! Bonjour! Hallo! Marhaba!) 🚔💸
🚨 Mission Briefing:
Based on 🔥Thief Trading Intelligence™🔥, we’ve identified a prime robbery opportunity in the XNG/USD (Natural Gas) Energy Market. Our Bearish Heist Plan is locked & loaded—long entries are a trap, and the real loot lies in the downside escape.
🎯 Heist Strategy:
Entry (Swipe the Loot!) 🏦
"The vault is cracked! Bears are distracted—time to steal!"
Sell Limit Orders preferred (15m-30m pullback entries).
DCA/Layering Strategy for maximum loot efficiency.
Stop Loss (Escape Route) 🚨
SL at nearest swing high (4H basis) – 3.480 (Day/Swing Trade)
Adjust based on risk tolerance, lot size, & number of orders.
Target (Police Evasion Zone) 🎯 2.900 (or earlier if cops close in!)
🔪 Scalpers’ Quick Heist:
Short-side scalp ONLY!
Big money? Go direct. Small stack? Join the swing robbers.
Trailing SL = Your Getaway Car! 🚗💨
⚡ Why This Heist? (Bearish Forces at Play)
Fundamentals: Oversupply, weak demand, storage glut.
Technicals: Overbought, trend exhaustion, reversal signals.
Sentiment: Bulls are overconfident—perfect trap setup!
📰 Breaking News Alert (Stay Sharp!)
High-impact news = Volatility spikes!
Avoid new trades during releases.
Trailing SL = Your Shield. (Lock profits before the cops raid!)
💥 BOOST THIS HEIST!
👉 Hit LIKE & FOLLOW to fuel our next robbery! More loot = More strategies! 🚀💰
⚠️ WARNING (Legal Escape Plan):
Not financial advice!
Your risk, your loot.
Markets change—adapt or get caught!
🤑 NEXT HEIST COMING SOON… STAY TUNED, ROBBERS! 🐱👤🔥

Natural Gas is in the Buying DirectionHello Traders
In This Chart NATGAS HOURLY Forex Forecast By FOREX PLANET
today NATGAS analysis 👆
🟢This Chart includes_ (NATGAS market update)
🟢What is The Next Opportunity on NATGAS Market
🟢how to Enter to the Valid Entry With Assurance Profit
This CHART is For Trader's that Want to Improve Their Technical Analysis Skills and Their Trading By Understanding How To Analyze The Market Using Multiple Timeframes and Understanding The Bigger Picture on the Charts
