Five Bubbles of TechnocracyGreetings, reader. Happy New Year!
The year 2026 is here—and it looks to be a challenging one for the bulls.
With it comes the "beginning of the end": the predictable bursting of the AI bubble. Your idols—Nvidia, OpenAI, massive Data Centers, and other tech icons that seemed to grow to the heavens—are finally falling back to earth. The speculative froth is evaporating, and the panic-stricken crowd is frantically searching for the Emergency Exit . There is nothing new under the sun: after a period of excess in the Western equity markets, we are witnessing yet another tragicomedy accompanied by the indignant cries of: “I never saw this coming!” 🤦♂️
Most analysts and investors are blinded by the current brilliance of the Data Center and AI bubble. They argue over Nvidia’s fundamentals and debate the exact timing of the crash. This is mere noise obscuring the grand design. This article is not about the AI bubble as a "random" or "unforeseen" failure. It is about the fact that financial bubbles over the last 50 years have not been anomalies—they are logically necessary, sequential stages in the construction of a Global Technocratic Infrastructure .
Each cycle served a specific purpose: attracting billions, then trillions of dollars to build a new layer of the system before collapsing to eliminate weak participants. Technocracy is being built according to a precise blueprint, and we can track its evolution through five sequential speculative cycles, each solving a bottleneck created by the previous one.
The Five Stages of Evolution: From PC to Nuclear Autonomy
1️⃣ The Genesis (1980s, Nifty Fifty): Establishing the user and the data collection point (PCs and mass electronics).
2️⃣ Connectivity (1990-2000, Dot-com): Laying the data highways (The Internet and fiber optics).
3️⃣ The Brain (2020-2025, Data Centers/AI): Developing the intelligence to process this colossal flow of information.
4️⃣ Order (2026–2028 Forecast, DLT/Tokenization): Systematizing and automating ownership, data, and assets.
5️⃣ Autonomy (Post-2030 Forecast, SMR/Uranium): Ensuring the invulnerability and uninterruptible power of this energy-intensive global system.
The "new money" gamblers—I mean, "young investors"—who bought the peaks will spend 2026 screaming about "Black Swans," searching the news feed for reasons why their favorite stocks are crashing. We, looking at the long-term horizon, must simply state the facts: we are witnessing the collapse of yet another financial bubble . It has already fulfilled its mission: attracting trillions to build the Artificial "Brain" (AI/DC) for the future technocratic system, redistributing capital from the greedy to the disciplined, and from retail to the institutional players.
For most, the 2026 crash will be a tragedy. But for insiders and my subscribers, it is the return of common sense, logic, and objective reality . The coming collapse is a sobering moment from the "AI-idiocracy" and the market madness of the last two years. It is the short-lived triumph of the truth we have analyzed here for years—a return from the pink clouds of AI hallucinations to the solid ground of reality .
The Five Bubbles of Technocracy is not just a market cycle analysis; it is the revelation of a grand design . The construction of a Digital Infrastructure of Control is not a future dream; it is a global conceptual project that uses the crowd's speculative mania as a free capital pump. This article will show how this pump has functioned for 50 years and where it will direct capital in the coming decade.
❗️ Disclaimer: A brief note for new readers. My goal is not to offend, but to analyze clearly. To understand these processes, we must call things by their real names —without sugarcoating. If you are accustomed to mainstream media and "influencers" who tell you polite half-truths and pleasant lies, this analysis may not be for you. The truth can be bitter, but it destroys illusions. If you are not ready for that, do not read further.
Let’s dive in!
________________________________________
📟 Introduction: The Era of Technocratic Bubbles
________________________________________
⚙️ From Nifty Fifty to SMR: How Speculation Funded the Global Technocratic Order. This article is not about the "AI bubble" as an error; it is an obituary for 2025 and a manual for the next 5-10 years. I will demonstrate that the financial bubbles of the last 50 years are not a random series of crises, but logical, sequential steps in assembling a global infrastructure. Technocracy follows a cyclical plan. The current crash is merely the final chord of Bubble #3 and the launchpad for Bubbles #4 and #5.
The Five Stages of Evolution: Where the Capital Flows We will trace this path to see how the 2026 collapse clears the field for a new, even more cynical speculative mania:
🎈Bubble #1: Creating the User (1980s): Established the point of data collection.
🎈Bubble #2: Connecting the Network (2000): Laid the global internet channels.
🎈Bubble #3: Building the "Brain" (2020–2025): Created the intelligence currently undergoing a painful revaluation.
🎈Bubble #4: Order and Control (2026–2028 Forecast, DLT/Tokenization): The next mega-bubble. Capital will flee to where they promise to "systematize" data through DLT and smart contracts.
🎈Bubble #5: The "Perpetual" Engine (Post-2030 Forecast, SMR/Uranium): The strategic goal—ensuring energy autonomy for the entire system.
________________________________________
🖥️ Part I. Building the Crowd, the Internet, and the Algorithms: Bubbles #1, #2, and #3
________________________________________
💥 Bubble #1: The Nifty Fifty and the Rise of Japan (1980s). Establishing the Data Collection Point (PCs and Electronics)
What was the Nifty Fifty? It was a list of approximately 50 "blue-chip" stocks in the late '60s and early '70s that were considered so reliable and innovative that investors believed in their "eternal growth," regardless of economic cycles. This bubble was directly tied to the rapid proliferation of electronic and computer technology, which ceased to be the exclusive domain of corporations and states. The transition from Mainframes to PCs: the emergence of personal computers (Apple II, Commodore 64, IBM PC) was a turning point. Technology became personal, understandable, and affordable due to economies of scale. Introducing PCs into homes and small businesses created millions of "users" for the first time. This was a critical aspect for the Technocracy—establishing a population base accustomed to generating and digitizing data.
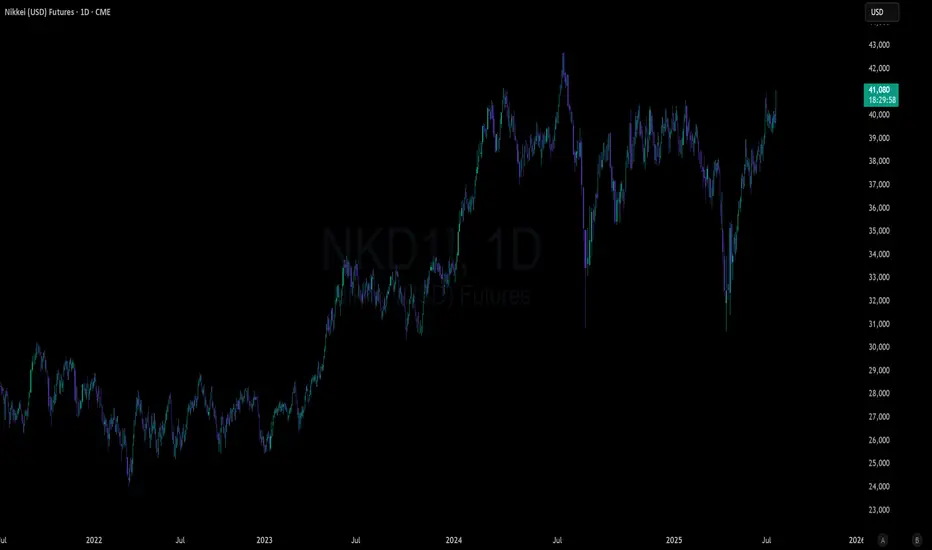
📈 Chart: Nikkei 225 (1950 — 2040)
The Japanese index INDEX:NKY Nikkei 225 serves as a colorful historical example, tracing its trading history from the 1950s to the present. To put it briefly: following the end of WWII, when the world was re-divided into spheres of influence, the United States invested heavily in the development of Japanese industry, specifically in various technologies. This was a strategic investment in a technocratic ally and a manufacturing hub.
The Pump Phase (1950s – 1980s): The Nikkei 225, acting as the locomotive of the tech boom, grew without serious pullbacks until the late 1980s. Even the 1973 oil crisis, which hit Western nations hard, largely spared Japan. The index saw only a minor -35% correction before surging +1000%, setting an all-time high and nearly touching the 40,000-point mark by the early 1990s. This was the peak of the technocratic premium for creating mass-market consumer electronics and PCs, which successfully solved Task #1: creating a global "user base. "
The Payback and Decline Phase (1990s – 2008): Once the Nifty Fifty bubble and the associated Japanese real estate boom burst, the Japanese stock market entered a prolonged, "fascinating journey" of a downtrend that lasted 19 years, resulting in a -80% drop from its ATH. Japan had fulfilled its function, and capital flowed toward the next objective.
The Recovery (2008 – 2025): Amidst the 2008 global financial crisis—after dropping -60% from its local high and retesting the 2003 lows—the index began a long, slow recovery. Only in 2025 did it finally surpass the peaks of the bubble from 36 years ago. It took the Japanese index three and a half decades just to recover to its 1980s highs!
The Big Question: Is the Japanese economy doing so well today that the index is hitting new highs? Hardly. The reality is quite the opposite. Japan's national debt leads the world at over +250% of GDP 🤯 and continues to grow. Chinese and Korean competitors have long since captured market share and technology leads, Japan's demographics are in terminal decline, and the country lacks both resources and territory. However, they have a printing press, the "Carry Trade," and a strong alliance with the US. This maintains the facade of the Japanese economic "miracle." This is what the life-giving power of infinite money emission, carry trades, and zero interest rates does to asset prices and the INDEX:NKY index.
◻️ In the 1980s, the world wasn't ready for AI yet, but it was ready for a "new era of eternal growth." This was the first major speculative premium the market paid for technological dominance.
The Nifty 50 Idol: This group of stocks (IBM, Xerox, Polaroid, etc.) traded at astronomical P/E ratios. Investors believed these companies were "too big to fail." This was the first instance of faith in a technocratic elite that supposedly held a monopoly on the future. This faith was pure speculation, disguised by the slogan: "technology is invincible."
The Fundamental Order: The purpose of this bubble was practical: attract capital to scale production and, most importantly, make PCs and electronics affordable. The Technocracy didn't just need mainframes for the Pentagon; it needed a "mini-PC in every home"—in other words, data collection points.
The Role of Japan: Japan acted as the primary innovator of mass production. Companies like Sony and Toshiba made technology fashionable and accessible (Walkman, color TVs, semiconductors). The Japanese real estate and stock market bubble of the '80s was simply a colossal financial pump that provided the Technocracy with its necessary user base.
◽️ Bubble #1 Outcome: The bubble burst, fueled by the "eternal growth" of the Nifty Fifty, but it left behind the essential: millions of people accustomed to computers and devices, and a global manufacturing base to create them. The User was created, the crowd was ready. Moving on.
________________________________________
🌐 Part II. Bubble #2: The Dot-com Crash (2000). Building the Data Highways (Internet and Connectivity). Communication Infrastructure as the Logical Growth of Technocracy
________________________________________
If the 1980s focused on computerizing individual locations (the PC), the 1990s created an urgent need to connect those millions of computers. The emergence and standardization of the Internet i as a public network was the solution. Technocracy shifted from creating individual tools to building a global communication system.
The "Pipes" and Speed: Colossal investments flowed into laying fiber-optic cables and manufacturing networking hardware (Cisco Systems) . The prevailing belief was that "bandwidth" could never be excessive.
Network Software: An explosion of companies creating web servers, browsers, and early online services (AOL, Yahoo!) . This marked the transition from local software installed on a disk to networked software.
Profitless IPOs: In the final phase, thousands of companies went public with nothing but a business plan and a .com domain. The key metric wasn't profit, but "eyeballs" or user count. Thus, WEB 1.0 was born.
The Technocratic Move : The bubble created the channels for data transmission. Technocracy realized its networked nature and laid the "arteries" necessary for the PCs of the 80s and 90s to exchange information.
📈 Chart: NASDAQ-100 (1990 — 2040)
When the "Japanese Economic Miracle" was sidelined in the early 1990s, leaving the Nikkei 225 to fall -80%, capital was already redirected to the next task. During the decade Japan’s market spent in a knockout, the US index FX:NAS100 surged +2000%.
The Pump Phase (1990s): The Dot-com bubble was a cynical fundraising campaign to lay global arteries—fiber-optic networks and communication protocols. In March 2000, it hit an ATH of 4800. This was the premium paid for the promise of connecting the "crowd" established in Bubble #1.
The Payback Phase (2000–2002): Once the infrastructure task was essentially solved (the pipes were laid), the bubble burst. In a two-and-a-half-year decline, the NASDAQ-100 crashed -83%, bottoming out just below 800 points.
The Recovery: It took the index sixteen years just to reclaim its 2000 ATH. This clearly demonstrates that once a strategic mission is completed, an asset class can be left in stagnation until it is needed again.
Key Insight: The Role of Post-2008 Liquidity. Even the 2008 Global Financial Crisis didn't crush the NASDAQ-100 as severely as the dot-com bust; it fell "only" -54% from its 2007 highs, without breaking the 2002 lows.
A New Driver: From 2008 onward, a new and much more aggressive game began. We’ve seen an almost uninterrupted rally, showing over +2000% growth from the 2008 lows.
Selling the Narrative: While the growth of the tech-heavy NASDAQ-100 can still be "sold" to the crowd using the success of Big Tech giants, why are European, British, and Japanese indices hitting new ATHs today? The answer is simple: the true driver is not earnings, but liquidity, carry trades, and buybacks , fueled by media narratives and hype.
Focus on GLI: Since 2008, the Western stock market has essentially acted as a STERILIZER for excess liquidity from the Eurodollar system . Looking at the Global Liquidity Index (GLI) chart, it is clear what the PRIMARY driver of stock market growth really is. The media narratives used to explain the rally to the masses are secondary.
Conclusion: The Dot-com bubble created the channels (The Internet). The 2008 crisis created an unprecedented flood of liquidity, providing the fuel for the next stage: creating the Brain to process the data flowing through these channels.
◻️ The Dot-com bubble was about infrastructure and access. Once the masses had their computers and gadgets, the logical problem arose: how to connect them into a single network so data could flow freely?
The "Pipes" Bubble: This was a pure infrastructure bubble. Speculation revolved around companies promising to lay fiber (WorldCom, Global Crossing) or sell the hardware for it i . Investors poured billions into profitless companies that simply had a plan to "build the tubes."
The ".com" Hysteria: The tragicomedy peaked when any company with a ".com" suffix was hailed as the future—even if they were losing money on every transaction. Behind this circus was a strategic mandate.
The Fundamental Order: Lay the arteries for WEB 1.0, WEB 2.0, and eventually WEB 3.0. For Technocracy to manage the world, it needs advanced communication channels. This bubble forced private capital to fund a global network that otherwise wouldn't have been built so rapidly.
The Cynical Outcome: The bubble burst, leaving behind "dark fiber," bankrupt telcos, and thousands of failed businesses—but the infrastructure remained. The survivors (Google, Amazon, eBay) inherited cheap, surplus data channels. These companies later used this infrastructure to collect and process the data that would lead us to Bubble #3.
◽️ Bubble #2 Outcome: The bubble left behind the communication channels (The Internet). The masses are now connected and constantly generating data.
________________________________________
💻 Part III. Bubble #3: Creating the Intelligence—Data Centers and AI (2022–2025). The Construction of the "Brain" (Big Data Processing) 🧠
________________________________________
After the previous two bubbles created billions of connected devices and a global network, we faced a new bottleneck: there is too much data, and it moves too fast.
The Primary Driver: The urgent need to process, analyze, and monetize vast volumes of information in real-time.
The Technocratic Shift: The focus has moved from communication infrastructure to "intelligence" infrastructure. Ownership of data is no longer enough; the value now lies in the ability to "digest" it for automated decision-making and social control.
Generative AI (LLMs): The rise of Large Language Models (ChatGPT and its peers) proved that AI could be a mass-market, transformational product, sparking a global corporate arms race.
Data Centers (DCs) and GPUs: Training and running these models requires astronomical computing power provided by hyperscale Data Centers. Specialized GPUs i became the literal "accelerants" of this technocratic evolution.
Concentration of Power: Unlike the Dot-com era, speculation today is concentrated in a handful of Mega-Caps that control the silicon and the cloud platforms.
As of late 2025, the AI bubble’s momentum is visibly fading. Beyond the hype of "AI will save us all," we must account for the Political Engineering factor.
The Political Trigger: In the context of a shifting liberal world order and internal corporate-oligarchic friction in the US, the stock market is more sensitive to political influence than ever before.
The Game of "Hot Potato": The AI bubble was inflated under the Biden administration starting in 2023. Now, the Republicans and Trump face the fallout in 2026—just in time for the Congressional Midterm Elections. The MAGA team’s delay in forcing the Fed to aggressively cut rates in 2025 has left them vulnerable. The longer you stretch the rubber band, the harder it snaps back.
The November 3, 2026 Midterms:
1. All 435 seats in the House of Representatives are up for election.
2. 35 out of 100 Senate seats are at stake.
3. 36 State Governors will be elected.
4. Thousands of state legislative and administrative positions are on the line. A crash in 2026 would likely lead to a "Divided Government," blocking the MAGA agenda and creating a springboard for the Democrats in 2028.
◻️ The "Rescue" Scenario: The appointment of a new Fed Chair in 2026 will likely be marketed as a "market rescue," launching another round of unlimited QE (Quantitative Easing). The Eurodollar system cannot function without it, but new QE requires a catalyst: a sharp "Risk-OFF" event and a market correction of -40-50%, similar to 2008. The fiat model survives only on FAITH and liquidity injections.💸
◻️ Price vs. Value: Do not confuse speculative bubbles with technological progress. The Price of overextended AI stocks is not the same as the Value of the technology itself. Just as the PC survived the Nifty Fifty crash and the Internet survived the Dot-com bust, AI will continue to integrate into our lives after the 50% "sobering up" of 2026. This isn't an accident; it's the end of Stage Three.
The Bottleneck: 40 years of digitization (Bubble #1) and global networking (Bubble #2) left us with a mountain of data that was useless without a way to "digest" it.
The Fundamental Mandate: Create the "Brain"—AI algorithms and Data Centers capable of real-time global management.
The New Idol: Investors deified the chips i and the cloud (Microsoft, Amazon) . The speculative premium was paid for the expectation of a monopoly on intelligence.
The Strategic Outcome: The crash doesn't mean AI failed. It means the capital required to build the core infrastructure i has been successfully harvested and deployed.
◽️ Bubble #3 Outcome: The AI/DC Bubble is the culmination of the previous cycles. It elevates the Technocracy by making computation the central nervous system of society. However, this system has two critical vulnerabilities that lead us directly to the next two cycles:
1) Data Order: Data is collected and processed, but it must be systematized, secured, and property rights must be automated (Enter Bubble #4).
2) Energy Demand: The unprecedented power required by Data Centers makes energy the next critical "commodity" (Enter Bubble #5).
This part of the translation deals with the transition from "Intelligence" to "Systematization." I have adapted the sharp Russian metaphors (like the "rectal suppository" analogy) into a more sophisticated but equally biting critique of financial engineering and behavioral economics that will resonate with the Western "contrarian" and "macro" investment communities.
________________________________________
🏦 Part II. Asset Systematization: Bubble #4 (2026–2028 Forecast)
________________________________________
🗣 "We’ve always used technology to better serve our clients, and we’re going to do the same with tokenization. Tokenization and blockchain are real." — Jamie Dimon, CEO of JPMorgan
🗣 "Tokenization is the future. It’s time to move all assets onto the blockchain." — CEO of Coinbase
🗣 "The potential for tokenization extends to real estate, stocks, bonds, and beyond. The industry is only at the beginning of this journey." — Larry Fink, CEO of BlackRock
🔗 Bubble #4: DLT and Tokenization. Establishing Order (Distributed Ledger Technology and Smart Contracts). Systematization, Transparency, and Automation of Assets.
The AI/Data Center bubble (#3) generated an incredible amount of data and algorithms but failed to solve a fundamental problem: how do we manage ownership rights and automate transactions for this data and the real-world assets they represent?
The Primary Driver: The demand for absolute transparency, immutability, and automated management. Traditional financial and legal systems are too slow and expensive for a real-time world.
The Technocratic Shift: Technocracy is moving toward an automated, transparent asset management system. This eliminates intermediaries, standardizes processes, and makes the entire system controllable at the protocol level.
Tokenization: Converting real-world assets (Real Estate, Private Equity, Commodities, Stocks) into digital tokens. This opens the door to massive liquidity and fractional ownership, attracting trillions of dollars.
Smart Contracts: Code that automatically executes transactions without lawyers or banks. It is the perfect tool for technocratic automation.
DLT/Blockchain: The technology that ensures ledger immutability, removing the need for centralized trust.
📈 Chart: GLI, S&P 500, and Selected DLT Assets (2019 – 2029)
In the previously published analysis: 🩻 Anatomy of AI Illusions. 2026–2028 Forecast , I broke down the pump mechanism of 2021-2025.
The Master Driver — Liquidity: Since 2019, the S&P 500 and the crypto market have moved in lockstep with the Global Liquidity Index (GLI). When liquidity is drained ("dried up"), a correction follows. When the system is flooded with "helicopter money," it flows into high-speculation bubbles to vent the excess pressure. The masses, lured by media and "fin-fluencers," buy the peaks, burning their capital to fund the next stage of Technocratic development.
The mechanism is simple, bold, and cynical — but highly effective:
1) Organize a crisis and panic (buy up devalued assets) →
2) "Save" everyone by printing piles of paper — QE (continue accumulation) →
3) Distribute cash to the masses under the guise of "care" (continue driving prices up) →
4) Inflate a market bubble in the sector of your choice (begin stealthy offloading) →
5) Use media and social networks to lure "dumb retail" into buying at the highs (sell more aggressively) →
6) Continue offloading into the naive herd, feeding them stories via MSM while the market slides →
7) Organize a new crisis and panic (begin buying back the necessary devalued assets) →
8) Once the plebs have forgotten everything, or "new" un-scared investors enter the market — repeat the scheme...
The "greater fool" theory remains the most reliable engine of the financial world. 🤷♂️
The GLI Cycle and QE Synchronization: According to the CrossBorder Capital GLI model, we expect a peak in late 2025 followed by a decline through 2027. Markets will likely bottom out in late 2026 amidst falling liquidity, aggressive rate cuts, the AI bubble burst, and a "post-facto" recognition of a global recession. In late 2026, a new Fed Chair will step in to "save" the US economy. 2027 will see a recovery, and 2028 will bring the explosive culmination of Bubble #4. The goal of this new QE is to absorb old debt through stablecoins and "trap" the digital dollar in a regulated loop, preventing it from leaking into the physical economy and causing hyperinflation.
🛠️ The Instruments for Bubble #4:
For the "Tokenization of Real-World Assets" (RWA), institutional capital needs controlled, scalable platforms. I have selected three primary "horses" for Bubble #4: Ethereum (ETH), Solana (SOL), and Hedera (HBAR), along with three infrastructure plays:
Ethereum (ETH): The Regulatory and Institutional Hub. It provides the financial gravity needed to legitimize the RWA market.
Solana (SOL): The High-Throughput Engine. Its "VISA-level" speed is critical for high-frequency trading and billions of micro-transactions.
Hedera (HBAR): The Enterprise Ledger. Governed by a council of global corporations, it provides the legal maturity and security required by supra-national organizations.
Infrastructure Plays: Chainlink (LINK) as the bridge between smart contracts and real-world data; Avalanche (AVAX) for institutional "subnets" with KYC/AML compliance; and Polygon (POL) as the mass-adoption gateway for Web2 brands.
❓ Where is BTC? Bitcoin is the "evergreen bubble." Its job is to be the billboard and the locomotive for the industry. But being first doesn't mean being the ultimate winner. Think of the pioneers: IBM 5150, Motorola DynaTAC, Nokia 9000, Kodak. Where are they now? Most are either gone or secondary players in the indices. Bitcoin will likely face a similar fate once its function is fulfilled.
💡 Why Bubble #4 is Inevitable:
The "Smart" Data Flood: Every gadget today—from "Smart" TVs and watches to Tesla cars—is a sensor (Camera, Mic, GPS) gathering data. This creates a chaos of information that requires a unified, automated ledger.
The Trust Crisis: To function, the Technocracy needs stable ledgers, not chaotic, open-source forks. DLT is not for "crypto-anarchist freedom"; it is for the stability and invulnerability of the system’s records.
The RWA Narrative: After 2026, DLT will be marketed as the "savior" from a corrupt, slow banking system. It will facilitate the digitalization of everything—Real Estate, Commodities, and Equity—into an automated, traceable turnover.
◽️ Outcome of Bubble #4: From Dot-com to Tokenization
The 2026-2028 DLT bubble is the logical heir to the Dot-com era. If Dot-com built the pipes for information , Tokenization builds the protocols for value and ownership . Most crypto-influencers miss the big picture. They pray for an "Alt-season" in their sandbox while failing to see that the cryptomarket was created as a testing ground for a new digital economy . If the public isn't ready for a direct "CBDC" injection (as seen in the failure in Nigeria), the system will introduce it through the "back door" via stablecoins and RWA. By 2030, after "The Great Depression v2.0" and "Great Reset" of old debts, the infrastructure will be ready for the final step:
DLT → Digital ID → CBDC → UBI
Technocracy will achieve (die Ordnung) Order!
________________________________________
⚛️ Part III. The "Perpetual" Engine: Bubble #5 (Post-2030 Forecast)
________________________________________
⚡ Bubble #5: SMRs, Microreactors, and Uranium. Establishing Autonomy and Invulnerability. Uninterruptible Power and Infrastructure Defense
The Problem: Conventional, centralized power grids cannot keep up with the exponential growth in demand from Data Centers, each requiring megawatts of power comparable to a small city. A technocratic system built on blockchain and AI cannot rely on unstable or centralized infrastructure.
The Primary Driver: The need for autonomous, powerful, and secure energy sources that can be deployed locally—next to consumption hubs like Data Centers, industrial clusters, and remote strategic facilities.
SMRs (Small Modular Reactors) and Microreactors (μR): These are the ideal solution. They can be mass-produced, rapidly deployed, and placed directly adjacent to hyperscale DCs. This eliminates long-distance transmission losses and makes the "Brain" of the system energy-independent.
Satellite Internet: Continued investment in low-earth orbit (LEO) networks (Starlink, Kuiper) ensures global, resilient connectivity. The ultimate vision—already hinted at by the likes of Elon Musk—is an autonomous "3-in-1" orbital complex: a satellite equipped with its own SMR and on-board Data Center. This is the ultimate guarantee of security, far removed from any "ground-level" threats.
The Technocratic Shift: Creating an invulnerable, distributed, and energy-autonomous system. This is the final stage that makes the entire technocratic structure truly self-sufficient and globally dominant.
◽️ Thus, Bubble #5 is the final chord. Once completed, the infrastructure will be fully realized:
1. Users and Data (The 80s).
2. Connectivity (The Dot-com era).
3. Processing Intelligence (The AI/DC era).
4. Systematized Order (DLT/RWA).
5. Autonomous Energy (SMR/Uranium).
The sequential construction—from PCs to global AI Data Centers and DLT networks—has generated a critical energy deficit.
The Bottleneck:
The infrastructure built across the first four bubbles is an energy-hungry beast. Centralized grids cannot provide the stability or autonomy required.
The Fundamental Mandate: Energy Autonomy. Technocracy cannot depend on political shifts, geopolitical conflicts, or the intermittency of "green" energy—we'll leave those for the distracted masses. It requires its own local, powerful, uninterruptible power source.
The New Idol: Small Modular Reactors (SMRs). Forget the old, cumbersome nuclear plants of the past. We are entering the era of compact, factory-built energy units acting as "batteries" for the industrial and digital elite.
The Speculative Core: This bubble will be marketed under the banner of "Energy Independence," but its true purpose is to fund the global energy pivot toward autonomous AI and DLT networks.
The Raw Material: Bubble #5 transforms Uranium from a mere commodity into the strategic fuel of the future civilization. This is the ultimate long-term investment thesis: uranium demand will grow exponentially to feed these autonomous nodes of power.
☢️ Uranium: Its Future and Ours. 2026–2050 Forecast
⬇️ Link to the detailed analysis: ⬇️
🔑 Strategic Insight: The Speed of Cycles Not all bubbles are created equal. Bubbles #1 and #2 (PC and Internet) moved slowly because they required physical construction —laying fiber, building factories, and logistics. Bubbles #3 and #4 (AI and DLT) are lightning-fast because they are "born digital" and leverage existing hardware. Here, the "Hype-to-Crash" cycle has compressed from decades into 3–5 years.
Bubble #5 (SMR/Uranium) is a return to physics . You cannot "copy-paste" a ton of uranium or spawn a thousand nuclear reactors overnight. This cycle is tied to the slow, fundamental commodities super-cycle. It will not unfold in a few years, but likely over two or three decades. It is the most reliable strategic asset, for without autonomous, uninterruptible nuclear energy, the entire technocratic machine simply cannot exist.
________________________________________
🏁 Summary and Conclusions
________________________________________
There is the panoramic view. As you read this in early 2026, you are not looking at a chaotic market, but a shift in structural priorities. We have seen that 50 years of financial "excess" were not mistakes or system "bugs"—they were the "features" of a successful engineering project to fund the Technocracy:
✅ Past (Bubbles #1, #2, #3) - DONE: Data collection, connectivity, and the creation of algorithms and AI are largely complete.
▶️ Present (Bubble #4) - START: Capital is migrating into DLT/Tokenization to bring order to global assets.
🎯 Future (Bubble #5) - STRATEGY: Strategic capital is already taking positions in Uranium and SMRs, recognizing the final, most fundamental asset of the New Technocratic Order .
The construction of this New Babylon through the Five Bubbles is not a future dream; it is a global conceptual project using the crowd's speculative mania as a capital pump . Your task is to understand which stage of construction the money is flowing into—and to avoid being the one who buys "idols" at their peak once their mission is complete.
A project of this scale does not rely on a single generation of investors or a single nation-state. The emerging Technocracy does not care who sits in the Oval Office. This is a multi-generational, long-term blueprint orchestrated by supra-national conceptual power . These forces move the needle behind the scenes, far from the "theatre of democracy" and the temporary political actors shown on the mainstream news. Those who truly hold the strings of global management will never be televised.
1️⃣ Strategy for 2026–2028: DLT and Debt Absorption (Bubble #4)
The next "idol" the market will deify is Digital Money (Stablecoins/CBDCs), Tokenization, and DLT . Capital will migrate en masse into technologies promising absolute transparency and automated accounting. This is an inevitable mania designed to digitize assets and—cynically—provide the technical framework for "writing off" the legacy debts of the old hegemon. The plan: accumulate the crypto-assets discussed in this analysis monthly throughout 2026 (ideally starting in the summer) with a focus on 2028. The goal is not to "catch the bottom," but to deliberately build a portfolio while the panic-stricken crowd is selling.
2️⃣ Strategy for 2026–2050: The Foundation of Autonomy (Bubble #5)
The most coveted asset of the Technocracy is invulnerability. Invulnerability equals autonomous nuclear energy. While speculators are driven into the RWA/DLT bubble in 2027–2028—tokenizing their last remaining possessions—strategic capital will have already occupied positions in assets that power the "AI Brain" for decades. We are talking about Small Modular Reactors (SMRs) and the raw materials that fuel them.
To survive the 2026 crisis, the subsequent 2029–2033 depression, and ultimately enter the Brave New World of Cyberpunk , your primary task is not to be part of the distracted masses . Do not buy the "idols" at their peak when their mission is already accomplished. Instead, use the 2026 collapse of the "AI-idiocracy" as a window for strategic positioning .
The core purpose of the ideas published on this channel is to cultivate a broad, objective, panoramic vision for my subscribers. This conceptual clarity is achieved through constant self-work: maintaining a sober mind, developing critical thinking, and utilizing impartial logic. Do not follow the herd as it gallops toward the abyss in yet another fit of FOMO and euphoria.
Our goal is for as many rational and enlightened individuals as possible to pass through the "bottleneck" of 2020–2030. We want you to emerge from the hybrid chaos of the current era, the burst of Bubble #4, and the resulting Great Depression 2.0, as survivors ready for the future.
Happy New Year!
Support this idea with a 🚀 rocket and a constructive 💭 comment to keep it from drowning in the ocean of useless information noise.
🙏 "Thank you for your attention to this matter"©
☘️ Good luck, stay safe!
📟 Over and out.
Japan 225

NIKKEI COUNTERINTUITIVE LONG|(Hear Me Out)
✅So the Bank Of Japan is likely to raise rates tomorrow, and so following classical market economics its bad news for the stock market. Rates down, stocks up, rates up, stocks down, thats how it goes right? And it usually does. However, Japanese investors are know to be extremely active in the carry trade market, where they borrow cheaply in Yen and then buy USD and invest outside of Japan to get higher income(this mechanism is well known and is not exclusive to Japan, however Japan is a massive player). So what happens now that the borrowing costs are about to go up? It makes carry trade less profitable and more risky too. While making local investments more attractive. So the money that would have gone to be invested via carry trade might just stay in Japan. And what is the highest yielding asset in japan? The stock market. So the rates increase might favor the Japanese stocks which we can pick up nicely from the demand level.
LONG🚀
✅Like and subscribe to never miss a new idea!✅

Maximum profit: Top 5 indices of OctoberIn October, client activity peaked around #SP500, #NQ100, #DAX30, #FTSE100, and #NIKKEI . These five indices not only showed the highest share of profitable trades but also delivered the best returns across all index instruments. Strong corporate earnings, steady demand, and a positive news backdrop continue to support their growth potential.
Growth outlook for key indices through the end of 2025:
• #SP500: New record highs, solid earnings from major players, and expectations of a Fed rate cut support buying the dip with moderate risk.
• #NQ100: Tech demand remains strong as firms invest in data centers and AI infrastructure. If earnings stay on track, there’s still room to grow.
• #DAX30: After hitting new all-time highs in 2025, the German index benefits from improved global trade sentiment and stable EU data. Exporters thrive on robust external demand.
• #FTSE100: The UK market remains near its highs, supported by strong performance in key sectors and commodities. Year-end liquidity may further reinforce the uptrend.
• #NIKKEI: Japan’s index keeps climbing, helped by a weak yen boosting exports and a predictable monetary environment. Further gains are possible if global conditions remain calm.
FreshForex analysts believe short-term index performance hinges on three main factors: current earnings season results, inflation trends, and central bank decisions. Risk management and awareness of the macro calendar remain essential.

Nikkei surges higher: What’s powering the market now#NIKKEI has soared above 50,000. The rally is fueled by a mix of political momentum following Sanae Takaichi’s arrival, the predictably dovish stance of the Bank of Japan, a weak yen benefiting exporters, accelerating corporate reforms, and a revival in tourism and domestic demand — all pushing profit expectations and valuations to record highs.
Key drivers of further #NIKKEI growth:
Weak yen + dovish BoJ : Exporters earn more when converting foreign revenue into yen; cheap credit keeps valuations and multiples strong.
AI and semiconductor investment cycle : Japan is expanding chip fabs, while local suppliers of materials and equipment enjoy long-term contracts and steady cash flow.
Corporate reforms & buybacks : Companies are selling off non-core assets, boosting efficiency, and buying back shares — lifting EPS and investor confidence.
Tourism & services boom : Japan is affordable for travelers, spending is up, and hotels, retailers, restaurants, and transport firms are reporting record revenues.
Rising wages & consumption : Households have more disposable income; businesses raise prices moderately, margins stay solid, and revenues grow steadily across sectors.
#NIKKEI’s growth isn’t only about the weak yen. FreshForex analysts believe political reform momentum, loose monetary policy, renewed chip demand, disciplined corporate management, and a robust services/tourism sector are key supports. The base scenario: the uptrend could extend through 2025–2026, though risks include a sharp yen rebound or political delays.

Japanese Yen Index Approaches Resistance – What’s Next for JXY?💴 JXY (Japanese Yen Index) – Thief Trader’s Market Money Looting Plan 🕵️♂️💰
📌 Plan Overview
Bias: Bullish Breakout confirmed with Hull Moving Average crossover.
Style: Swing / Day Trade ⚡
Entry Approach: Using layered limit orders (the “Thief Strategy”) at:
🪙 67.60 | 🪙 67.80 | 🪙 67.90 | 🪙 68.00
(💡 You can increase limit layers based on your own risk & style).
🎯 Target & Escape Plan
Target Zone (TP): 68.50 ⚡ (Hull MA resistance + Overbought Zone + Trap Alert)
The idea: Steal profits & escape before the trap closes ⛓️💨.
Note: Targets are flexible. Dear Ladies & Gentlemen (Thief OG’s), adjust TP as per your strategy & risk.
🛡️ Risk Management – Thief Style
Stop Loss (SL): 67.20 🛑 (after breakout confirmation).
⚠️ Reminder: SL is not fixed. Thief OG’s, adjust SL to match your startergy & personal risk.
The golden thief rule: Protect your loot before escaping! 🕶️💼
🔑 Key Points to Watch
Hull MA Breakout = Momentum trigger 📈.
JPY Strength/Weakness can be spotted through related pairs:
FX:USDJPY 💵💴 → Direct correlation with JXY (inverse to USD strength).
OANDA:EURJPY 💶💴 → Tracks EUR flows vs JPY.
OANDA:GBPJPY 💷💴 → Higher volatility = bigger loot opportunities 🏴☠️.
OANDA:AUDJPY & OANDA:NZDJPY 🌏💴 → Strong risk sentiment indicators.
NASDAQ:JPY futures (6J1!) 🕵️♂️ → Direct hedge tool.
🧩 Correlation Insight
When JXY pumps 🚀, typically FX:USDJPY drops 📉.
Crosses like EURJPY / GBPJPY can become volatile = side opportunities for scalpers.
Watch global risk sentiment (equities/indices) – JPY often behaves as a safe-haven thief 🏦.
✨ “If you find value in my analysis, a 👍 and 🚀 boost is much appreciated — it helps me share more setups with the community!”
#JXY #JPY #USDJPY #EURJPY #GBPJPY #AUDJPY #NZDJPY #Forex #SwingTrade #DayTrading #HullMA #Breakout #TradingStrategy #MarketAnalysis #TradingView

NIKKEI 5-month pattern points to a rise to 47300Nikkei (NI225) has been trading within a 5-month Channel Up and is on its latest Bearish Leg since the September 19 High.
As you can see, the index has had another 4 such pull-backs within this pattern, all of which touched the Buy Zone and the 1D RSI Support Zone before initiating the new Bullish Leg.
All Bullish Legs have peaked on their 1.786 Fibonacci extensions. As a result, our Target on the medium-term is 47300.
-------------------------------------------------------------------------------
** Please LIKE 👍, FOLLOW ✅, SHARE 🙌 and COMMENT ✍ if you enjoy this idea! Also share your ideas and charts in the comments section below! This is best way to keep it relevant, support us, keep the content here free and allow the idea to reach as many people as possible. **
-------------------------------------------------------------------------------
💸💸💸💸💸💸
👇 👇 👇 👇 👇 👇

Nikkei 225 Rises After Prime Minister Shigeru Ishiba ResignsNikkei 225 Rises Following Resignation of Prime Minister Shigeru Ishiba
As the chart shows, Japan’s Nikkei 225 stock index (Japan 225 on FXOpen) today approached its historic peak (B) around the 43,900 level.
Bullish sentiment was driven by political news. According to Reuters, Prime Minister Shigeru Ishiba has stepped down. The leading candidate to replace him, Sanae Takaichi, is regarded as a supporter of stimulus measures and unprecedented monetary easing – a bullish factor for companies.
Technical Analysis of the Nikkei 225
As indicated by the 200- and 400-period moving averages on the 4-hour chart, Japan’s stock market remains in a long-term uptrend. This summer, index movements have been forming an ascending channel, highlighted in blue, with the lower boundary acting as strong support.
Other bullish signs include:
→ A bullish structure, highlighted by a normal pullback of around 50% (B→C) following the A→B impulse.
→ During the B→C decline, price movements formed a corridor (marked with red lines) resembling a bullish flag pattern. Its breakout suggests an attempt to resume the upward trend after an interim correction.
→ Recent price action, indicating that former resistance levels have turned into support. This applies both to the upper red line (marked with an arrow) and to last week’s former resistance at 43,150.
On the other hand:
→ Long upper shadows on today’s candles point to increased selling pressure near the historic peak.
→ The RSI indicator has risen to the overbought territory.
Given that the index is now around the median of the ascending channel (a level where supply and demand tend to balance), we could assume the market may consolidate in the short term. Possible scenarios include:
→ Attempts to break through the historic high, which may fail – potentially trapping overly optimistic participants and creating signs of a bearish ICT Liquidity Sweep pattern above peak B.
→ A correction with a retest of the 43,150 level.
This article represents the opinion of the Companies operating under the FXOpen brand only. It is not to be construed as an offer, solicitation, or recommendation with respect to products and services provided by the Companies operating under the FXOpen brand, nor is it to be considered financial advice.

NIKKEI Rising Support! Buy!
Hello,Traders!
NIKKEI is trading along
The rising support and
The index is going down
Now but as we are bullish
Biased we will be expecting
A bullish rebound and
And a move up after
The retest
Buy!
Comment and subscribe to help us grow!
Check out other forecasts below too!
Disclosure: I am part of Trade Nation's Influencer program and receive a monthly fee for using their TradingView charts in my analysis.

JPN225 Technical Analysis: Comprehensive Nikkei 225# JPN225 Technical Analysis: Comprehensive Nikkei 225 Multi-Timeframe Trading Strategy
Executive Summary
**Current Price:** 42,087.6 (August 30, 2025, 12:54 AM UTC+4)
**Market Sentiment:** Bullish with consolidation signals near all-time highs
**Primary Trend:** Strong uptrend with potential for further extension
**Key Resistance:** 43,876 (recent all-time high)
The Nikkei 225 continues to demonstrate exceptional strength, trading near record levels after reaching its highest quote on August 19, 2025 at 43,876.42 JPY. The index has shown remarkable resilience with monthly gains of 5.08% and yearly gains of 10.53%, outperforming global peers while benefiting from accommodative global monetary policy and renewed investor confidence in Japanese equities.
Market Context & Fundamental Backdrop
Monetary Policy Environment
The Bank of Japan maintains a carefully balanced approach with the benchmark interest rate at 0.50 percent, representing a significant shift from the ultra-loose policies of recent years. Markets expect a gradual return to tighter policy likely starting in autumn 2025 or early 2026 if economic conditions remain favorable.
Economic Fundamentals
The Japanese economy shows signs of sustainable recovery with corporate earnings supporting equity valuations. The recent all-time highs reflect growing expectations of US Federal Reserve interest rate cuts and improved global risk sentiment.
Key Market Drivers
Global Liquidity:** Fed rate cut expectations supporting risk assets
Corporate Governance:** Continued improvements in ROE and shareholder returns
Yen Dynamics:** Currency stability supporting foreign investment flows
Export Recovery:** Gradual improvement in global trade conditions
Technical Analysis Framework
Japanese Candlestick Analysis
**Monthly Pattern:** Strong bullish engulfing pattern confirming long-term uptrend
**Weekly Pattern:** Inside bar formation suggesting consolidation before next move
**Daily Pattern:** Small-bodied doji candles near highs indicating indecision
**Intraday Patterns:** Morning star and hammer formations frequent in 1H timeframe
Elliott Wave Analysis
**Primary Wave Count:**
Major Degree:** Wave 5 of multi-year bull market cycle in progress
Intermediate Degree:** Subwave 3 of 5 potentially completed near 43,876
Minor Degree:** Currently in subwave 4 correction within larger Wave 5
**Alternative Count:** Extended Wave 3 scenario targeting 45,000-46,000 zone
**Critical Levels:** Wave 4 support at 40,500-41,000 maintains bullish structure
Harmonic Pattern Analysis
**Active Patterns:**
Bullish Cypher:** Completion zone at 40,800-41,200 (potential retracement target)
AB=CD Extension:** Current formation targeting 44,200-44,800
Potential Bearish Gartley:** Formation risk above 44,500 suggesting reversal
**Fibonacci Confluence:**
- 61.8% retracement of major swing: 41,450
- 38.2% retracement: 42,650 (current area)
- 1.618 extension target: 44,200
Wyckoff Method Analysis
**Current Phase Assessment:** Sign of Strength (SOS) after successful test
**Accumulation Characteristics:**
- Volume increasing on advances, decreasing on declines
- Spring action completed in July 2025 low
- Markup phase showing healthy progression
**Composite Operator Activity:** Evidence of institutional accumulation between 40,000-42,000
W.D. Gann Technical Analysis
# Square of 9 Application
**Current Position:** 42,087.6 = 205.15° on the Gann wheel
**Key Resistance Levels:**
- 42,025 (205°) - recently tested
- 42,436 (206°) - immediate resistance
- 43,681 (209°) - major resistance near ATH
**Support Levels:**
- 41,616 (204°) - immediate support
- 41,209 (203°) - strong support zone
- 40,401 (201°) - major support level
# Time Theory Application
**Critical Time Cycles:**
- September 6-9: 90-degree time angle from major low
- September 23: Autumn equinox - natural turning point
- October 7: 180-degree time cycle completion
# Price Squaring Analysis
**Square Root of Price:** √42,087.6 = 205.15
**Next Square Levels:**
- 206² = 42,436 (immediate resistance)
- 207² = 42,849 (intermediate target)
- 210² = 44,100 (extended target)
**Previous Square Support:**
- 204² = 41,616
- 203² = 41,209
- 200² = 40,000 (psychological support)
Ichimoku Kinko Hyo Analysis
**Current Cloud Configuration:**
Tenkan-sen (9):** 42,155 - Price slightly below, neutral bias
Kijun-sen (26):** 41,920 - Price above, bullish confirmation
Senkou Span A:** 42,037 (cloud top)
Senkou Span B:** 40,885 (cloud bottom)
**Assessment:** Price trading above cloud with bullish bias intact, though near cloud resistance requiring breakout for continuation.
Multi-Timeframe Technical Indicator Analysis
5-Minute Chart (Scalping Focus)
**RSI(14):** 52.3 - Neutral zone with slight bullish bias
**VWAP:** 42,065 - Price oscillating around VWAP, indecision
**Bollinger Bands:** Middle band at 42,070, bands contracting (low volatility)
**Volume:** Below average, typical for consolidation phase
15-Minute Chart (Scalping Focus)
**MACD:** Histogram flattening, momentum slowing
**Stochastic(14,3,3):** 48.2 in neutral territory
**Williams %R:** -52% suggesting no extreme conditions
**Support/Resistance:** 42,040/42,130 key levels for range
1-Hour Chart (Day Trading)
**RSI(14):** 58.7 - Neutral with slight bullish momentum
**VWAP:** 41,995 providing dynamic support
**Moving Averages:** EMA(20) > EMA(50) maintaining bullish alignment
**Volume Profile:** High volume node at 42,000-42,100
**Key Levels:**
Resistance:** 42,150, 42,250, 42,380
Support:** 42,000, 41,920, 41,800
4-Hour Chart (Swing Trading)
**RSI(14):** 61.4 approaching overbought but not extreme
**MACD:** Positive but showing slight divergence with price
**Bollinger Bands:** Price near upper band, expansion needed for breakout
**ADX(14):** 31.2 indicating moderate trend strength
**Critical Levels:**
Primary Resistance:** 42,400-42,500
Secondary Resistance:** 43,000-43,200
Primary Support:** 41,700-41,800
Secondary Support:** 41,200-41,400
Daily Chart (Position Trading)
**RSI(14):** 64.8 in bullish territory but not overbought
**Moving Averages:** All major MAs (20, 50, 100, 200) aligned bullishly
**Volume:** Consolidation pattern with average volume
**Pattern:** Ascending triangle formation with apex near 42,400
Weekly Chart (Long-term Analysis)
**RSI(14):** 69.1 approaching overbought threshold
**MACD:** Strong positive momentum but rate of change slowing
**Long-term Trend:** Powerful uptrend since October 2024 low
**Major Resistance:** 43,876 (ATH) and 44,000-44,500 zone
Monthly Chart (Strategic View)
**RSI(14):** 73.2 significantly overbought (caution warranted)
**Long-term Pattern:** Multi-year cup and handle completion
**Measured Move Target:** 46,000-48,000 based on pattern analysis
**Support Structure:** 38,000-40,000 major support zone
Comprehensive Support and Resistance Analysis
Primary Support Structure
1. **42,000-42,050:** Psychological level with VWAP confluence
2. **41,920-41,950:** Kijun-sen and previous resistance turned support
3. **41,700-41,800:** Previous consolidation zone with volume
4. **41,400-41,500:** 38.2% Fibonacci retracement level
5. **41,200-41,300:** Square of 9 support and trend line
6. **40,800-41,000:** Major support zone and Elliott Wave 4 target
7. **40,000-40,200:** Psychological and long-term trend support
Primary Resistance Structure
1. **42,150-42,200:** Immediate resistance with intraday significance
2. **42,380-42,450:** Square of 9 resistance and daily pivot
3. **42,800-43,000:** Intermediate resistance zone
4. **43,200-43,400:** Previous consolidation resistance
5. **43,800-43,900:** All-time high resistance zone
6. **44,100-44,300:** Extended targets and measured moves
7. **45,000-45,500:** Long-term bull market targets
Weekly Trading Strategy (September 2-6, 2025)
Monday, September 2, 2025
**Market Environment:** Post-weekend positioning, likely range-bound opening
**Primary Strategy:** Range trading with breakout preparation
**Volatility Expectation:** Below average due to consolidation phase
**Intraday Trading Levels:**
Long Entry Zone:** 42,020-42,040
- Stop Loss: 41,980
- Target 1: 42,090 (1:1 R/R)
- Target 2: 42,140 (1:2 R/R)
Short Entry Zone:** 42,140-42,160
- Stop Loss: 42,200
- Target 1: 42,090 (1:1 R/R)
- Target 2: 42,040 (1:2 R/R)
**Swing Setup:** Monitor for break above 42,200 for continuation to 42,400
Tuesday, September 3, 2025
**Market Environment:** Potential volatility increase, global macro focus
**Primary Strategy:** Momentum trading with trend following bias
**Key Events:** Watch for any BOJ communication or USD/JPY moves
**Trading Approach:**
Bullish Scenario:** Break above 42,200 targets 42,350-42,400
- Entry: 42,210-42,230
- Stop: 42,150
- Targets: 42,320, 42,400
Bearish Scenario:** Break below 42,000 targets 41,850-41,900
- Entry: 41,990-42,010
- Stop: 42,050
- Targets: 41,920, 41,850
**Risk Management:** Reduce position sizes by 25% given potential volatility
Wednesday, September 4, 2025
**Market Environment:** Mid-week consolidation expected
**Primary Strategy:** Scalping within established range
**Focus:** High-frequency opportunities with tight risk management
**Scalping Strategy:**
Range Parameters:** 42,000-42,180
Long Scalps:** 42,010-42,025, Target: 42,070-42,090
Short Scalps:** 42,150-42,165, Target: 42,100-42,080
Stop Losses:** 15-20 points maximum for scalp trades
**Breakout Preparation:**
Bullish Breakout:** Above 42,200 with volume confirmation
Bearish Breakdown:** Below 41,980 with increased selling pressure
Thursday, September 5, 2025
**Market Environment:** Potential trending day, higher volatility expected
**Primary Strategy:** Breakout trading with momentum confirmation
**Critical Factors:** Volume analysis crucial for sustained moves
**Breakout Scenarios:**
Upside Breakout:** Above 42,250
- Targets: 42,400, 42,550, 42,700
- Volume Requirement: 1.5x average
- Stop Loss: 42,150
Downside Breakdown:** Below 41,950
- Targets: 41,800, 41,650, 41,500
- Volume Requirement: 1.3x average
- Stop Loss: 42,050
**Position Management:**
- Scale into positions on confirmed breakouts
- Trail stops aggressively after first target achieved
Friday, September 6, 2025
**Market Environment:** Weekly close positioning, potential profit-taking
**Primary Strategy:** End-of-week consolidation trading
**Focus:** Weekly close levels for next week's setup
**Weekly Close Strategy:**
Bullish Close:** Above 42,150 sets up next week advance
Neutral Close:** 42,000-42,150 maintains current range
Bearish Close:** Below 42,000 suggests correction risk
**Day Trading Approach:**
Morning Session:** Trend continuation from Thursday
Afternoon Session:** Range trading and position squaring
Final Hour:** Light volume, avoid new large positions
Advanced Risk Management Framework
Position Sizing Guidelines
**Account Risk per Trade:**
5M Scalping:** 0.25-0.5% maximum risk
15M Scalping:** 0.5-0.75% maximum risk
1H Day Trading:** 1-1.5% maximum risk
4H Swing Trading:** 1.5-2% maximum risk
Daily Position Trading:** 2-3% maximum risk
Stop Loss Parameters
**Timeframe-Specific Stops:**
5-Minute Charts:** 30-50 points maximum
15-Minute Charts:** 50-80 points maximum
1-Hour Charts:** 80-120 points maximum
4-Hour Charts:** 150-250 points maximum
Daily Charts:** 300-500 points maximum
Profit-Taking Strategy
**Systematic Approach:**
First Target (50% position):** 1:1 Risk/Reward ratio
Second Target (30% position):** 1:2 Risk/Reward ratio
Third Target (20% position):** 1:3+ Risk/Reward ratio
Trailing Stops:** Implement after first target achievement
Maximum Daily Loss Limits
Scalping Combined:** -1% of account maximum
Day Trading:** -2% of account maximum
Swing Positions:** -3% of account maximum
Total Portfolio:** -5% daily stop loss (all strategies combined)
Geopolitical and Market Risk Assessment
Domestic Risk Factors
**Bank of Japan Policy:**
- Expected gradual tightening starting autumn 2025
- Communication changes could trigger volatility
- Yield curve control adjustments impacting bond markets
**Economic Indicators:**
- Corporate earnings season performance
- Wage growth and inflation data
- Consumer spending patterns
International Risk Factors
**US Federal Reserve Policy:**
- Interest rate cut expectations driving current rally
- Any hawkish surprises could trigger risk-off sentiment
- Dollar strength impacting Japanese export competitiveness
**China Economic Data:**
- Manufacturing PMI and economic indicators
- Trade relationship developments
- Commodity demand affecting Japanese materials sector
**Geopolitical Considerations:**
- Regional security tensions
- Trade policy developments
- Energy security concerns
Currency Risk (USD/JPY Impact)
**Current Dynamics:**
- Yen stability supporting foreign investment
- Intervention risk if excessive yen weakness
- Carry trade dynamics affecting equity flows
**Key Levels to Monitor:**
- USD/JPY above 155: Intervention risk increases
- USD/JPY below 140: Export competitiveness concerns
- Current range 145-150 supportive for equities
Sector Analysis and Rotation Themes
Outperforming Sectors
1. **Technology:** AI and semiconductor strength
2. **Financial Services:** Rising rate environment benefits
3. **Export-Oriented Manufacturing:** Stable yen supporting margins
4. **Tourism and Services:** Domestic consumption recovery
Underperforming Sectors
1. **Utilities:** Interest rate sensitivity
2. **Real Estate:** Commercial property concerns
3. **Traditional Retail:** E-commerce competition
4. **Energy Imports:** Cost pressures from global prices
Rotation Indicators
Growth vs Value:** Currently favoring quality growth
Domestic vs Export:** Balanced performance
Large Cap vs Small Cap:** Large cap leadership maintained
Advanced Pattern Recognition
Ichimoku Trading Signals
**Current Setup:** Tenkan/Kijun twist near cloud top
**Bullish Signals:** Price above cloud, future cloud bullish
**Entry Trigger:** Break above Tenkan-sen with volume
**Exit Signal:** Return below Kijun-sen or cloud
Gann-Based Trade Setups
**Square of 9 Long:** Buy at 203° (41,209) target 206° (42,436)
**Square of 9 Short:** Sell at 206° (42,436) target 203° (41,209)
**Time Cycles:** Major turns expected September 6-9 window
Wyckoff Phase Analysis
**Current Assessment:** Markup Phase B
**Expected Development:** Test of supply around 43,000
**Bullish Continuation:** Successful test leads to Phase C
**Distribution Risk:** Heavy volume above 43,500 warns of Phase A
Market Microstructure Considerations
High-Frequency Trading Impact
**Active Zones:** Increased HFT activity around 42,000 and 42,200
**Optimal Entry Times:** 9:00-9:30 JST and 14:30-15:00 JST
**Liquidity Concerns:** Reduced depth above 43,000 level
Algorithmic Trading Patterns
**Support/Resistance:** Algorithms defending 42,000 level
**Momentum Algos:** Active above 42,200 breakout level
**Mean Reversion:** Strong between 42,000-42,150 range
Order Flow Analysis
**Large Block Activity:** Evidence near 42,000 support
**Institutional Flows:** Accumulation on weakness below 42,000
**Retail Sentiment:** Generally bullish but positioning light
Technology Integration and Tools
Recommended Platforms
1. **TradingView:** Comprehensive charting and analysis
2. **MT5/MT4:** Order execution and automation
3. **Bloomberg Terminal:** Real-time data and news flow
4. **Refinitiv Eikon:** Fundamental analysis integration
Alert Systems
**Price Alerts:**
- 42,200 breakout level
- 42,000 breakdown level
- 43,000 major resistance
- 41,500 major support
**Volume Alerts:**
- 1.5x average volume spikes
- Unusual options activity
- Block trade notifications
**News Alerts:**
- BOJ communications
- Economic data releases
- Geopolitical developments
- Corporate earnings surprises
Seasonal and Cyclical Analysis
Historical Patterns
**September Performance:** Typically weak month for Japanese equities
**Q4 Seasonality:** Strong performance into year-end typically
**Monthly Cycles:** Pension fund flows mid-month supporting prices
Holiday Calendar Impact
**Labor Day (Sep 2):** Reduced US market activity
**Autumnal Equinox (Sep 23):** Japanese market closed
**Sports Day (Oct 13):** Market holiday consideration
Conclusion and Strategic Outlook
The Nikkei 225 stands at a critical inflection point, having achieved new all-time highs while showing signs of consolidation near these elevated levels. The technical picture remains constructively bullish across most timeframes, though some overbought conditions on longer-term charts warrant measured optimism.
**Key Investment Themes:**
1. **Trend Continuation:** Primary uptrend intact with higher high potential
2. **Range Trading Opportunity:** 42,000-42,400 range likely to persist near-term
3. **Breakout Preparation:** Accumulation above 42,400 could trigger significant advance
4. **Risk Management Priority:** Elevated levels require disciplined position sizing
**Week Ahead Strategy:**
- Favor range trading initially with breakout preparation
- Monitor volume carefully for sustained directional moves
- Reduce position sizes given September seasonality concerns
- Focus on high-probability setups with multiple confluence factors
**Medium-term Outlook (1-3 months):**
The combination of supportive global liquidity conditions, improving Japanese corporate fundamentals, and technical momentum suggests potential for further advances toward 44,000-45,000. However, traders should remain vigilant for any shift in central bank communications or global risk sentiment that could trigger meaningful corrections.
**Risk Scenarios:**
Bullish Case:** Break above 43,900 targets 45,000-46,000
Base Case:** Consolidation between 41,500-43,500 through September
Bearish Case:** Break below 41,000 suggests correction to 39,000-40,000
The technical analysis framework presented incorporates multiple methodologies to provide robust trade identification and risk management protocols. Market participants should adapt position sizes and holding periods based on their risk tolerance and market conditions while maintaining disciplined adherence to the technical levels identified.
---
*This analysis represents a comprehensive technical assessment based on multiple methodologies and should be combined with proper risk management and individual risk tolerance considerations. Markets can exhibit unexpected behavior, and all trading decisions should incorporate current market conditions and individual financial circumstances.*

NIKKEI Rebound Ahead! Buy!
Hello,Traders!
NIKKEI is trading in a
Strong uptrend and the
Index is making a retest
Of the horizontal support
Level of 42,138 from where
We will be expecting a local
Bullish rebound
Buy!
Comment and subscribe to help us grow!
Check out other forecasts below too!
Disclosure: I am part of Trade Nation's Influencer program and receive a monthly fee for using their TradingView charts in my analysis.

Nikkei 225 & USD/JPY AnalysisThe Nikkei 225 has reached new all-time highs (almost reaching 44,000), driven by strong domestic economic indicators and robust corporate earnings.
The yen has strengthened against the US dollar, influenced by
1) speculation over the timing of a rate cut from the FOMC, and
2) the Bank of Japan's hawkish stance and expectations of interest rate hikes.
(narrowing of monetary policy between the two countries)
Historically, a weaker yen (rising USD/JPY - thin blue line) has been beneficial for Japanese exporters, leading to increased corporate earnings and, consequently, a rising Nikkei 225.
But, at times, this inverse relationship has shown signs of divergence.
The current divergence between the USDJPY and the Nikkei 225 suggests that the Nikkei 225 is increasingly driven by domestic economic factors rather than the traditional USD/JPY correlation.
In the short term, the Nikkei 225 may continue its upward momentum, supported by strong economic fundamentals and investor confidence.
With the price breaking out and staying above the upward channel, climbing toward the 45,000 price level.
Medium-Term Risks: Potential geopolitical tensions and shifts in global economic conditions could introduce volatility in the medium term. This could lead to a retracement down to 42,000 before trading higher again.
While the traditional correlation has weakened, ongoing monitoring of USD/JPY movements remains essential, as significant fluctuations could still impact investor sentiment.

The NIKKEI 225 reached a new high on strong Japanese Q2 GDP
Japanese equities extended their rally last week, supported by strong economic data and expectations of Fed rate cuts. Notably, Japan’s Q2 GDP exceeded consensus, helping propel the market to fresh highs. GDP grew 1.0% YoY (prev. 0.6%, cons. 0.4%), easing recession fears despite lingering uncertainty over Japan-US tariff negotiations throughout the quarter. The achievement drew particular market attention, given the challenging trade backdrop.
Meanwhile, US Treasury Secretary Bessent sparked controversy by openly pressuring the BoJ to tighten policy, citing Japan’s inflation as a severe problem. Markets cautioned that if such remarks were to influence actual policy action, investors could view a BoJ rate hike as politically driven, complicating its execution.
NIKKEI 225 breached above the ascending channel’s upper bound and set a new high. The widening gap between both EMAs suggests the potential extension of bullish momentum. If NIKKEI 225 holds above the channel’s upper bound, the index may test the resistance at 44000. Conversely, if NIKKEI 225 reenters the channel and breaks below the support at 42115, the index could retreat toward the next support at 40800.

NIKKEI Will Keep Growing! Buy!
Hello,Traders!
NIKKEI is trading in a
Strong uptrend and the
Pair made a bullish breakout
Of the key horizontal level
Of 42,500 and the breakout
Is confirmed so we are bullish
Biased and we will be expecting
A further bullish move up
Buy!
Comment and subscribe to help us grow!
Check out other forecasts below too!
Disclosure: I am part of Trade Nation's Influencer program and receive a monthly fee for using their TradingView charts in my analysis.

Short term idea Nikkei (JPN225)Based on -
- overvalued conditions (it need to retrace a little bit after a huge rally like the past days)
- supply zone
- voulme profile analysis

NIKKEI WILL KEEP GROWING|LONG|
✅NIKKEI is trading in an uptrend
And the index was making a bearish correction
But it has now retested a horizontal support level of 40,500
From where we are already seeing a bullish
Reaction and I am expecting the index to go further up
LONG🚀
✅Like and subscribe to never miss a new idea!✅
Nikkei primary trend remains bullish.NIK225 - 24h expiry
Price action continues to trade around significant highs.
The primary trend remains bullish.
20 1day EMA is at 40385.
We look for a temporary move lower.
Dip buying offers good risk/reward.
We look to Buy at 40405 (stop at 40105)
Our profit targets will be 41305 and 41455
Resistance: 40895 / 41043 / 41315
Support: 40635 / 40375 / 40000
Risk Disclaimer
The trade ideas beyond this page are for informational purposes only and do not constitute investment advice or a solicitation to trade. This information is provided by Signal Centre, a third-party unaffiliated with OANDA, and is intended for general circulation only. OANDA does not guarantee the accuracy of this information and assumes no responsibilities for the information provided by the third party. The information does not take into account the specific investment objectives, financial situation, or particular needs of any particular person. You should take into account your specific investment objectives, financial situation, and particular needs before making a commitment to trade, including seeking, under a separate engagement, as you deem fit.
You accept that you assume all risks in independently viewing the contents and selecting a chosen strategy.
Where the research is distributed in Singapore to a person who is not an Accredited Investor, Expert Investor or an Institutional Investor, Oanda Asia Pacific Pte Ltd (“OAP“) accepts legal responsibility for the contents of the report to such persons only to the extent required by law. Singapore customers should contact OAP at 6579 8289 for matters arising from, or in connection with, the information/research distributed.

Nikkei 225 D1 | Strong upward momentumThe Nikkei 225 (JPN225) is falling towards a pullback support and could potentially bounce off this level to climb higher.
Buy entry is at 40,670.02 which is a pullback support that aligns with the 23.6% Fibonacci retracement.
Stop loss is at 39,100.00 which is a level that lies underneath an overlap support and the 23.6% and 50% Fibonacci retracements.
Take profit is at 42,550.16 which is a swing-high resistance.
High Risk Investment Warning
Trading Forex/CFDs on margin carries a high level of risk and may not be suitable for all investors. Leverage can work against you.
Stratos Markets Limited (tradu.com ):
CFDs are complex instruments and come with a high risk of losing money rapidly due to leverage. 66% of retail investor accounts lose money when trading CFDs with this provider. You should consider whether you understand how CFDs work and whether you can afford to take the high risk of losing your money.
Stratos Europe Ltd (tradu.com ):
CFDs are complex instruments and come with a high risk of losing money rapidly due to leverage. 66% of retail investor accounts lose money when trading CFDs with this provider. You should consider whether you understand how CFDs work and whether you can afford to take the high risk of losing your money.
Stratos Global LLC (tradu.com ):
Losses can exceed deposits.
Please be advised that the information presented on TradingView is provided to Tradu (‘Company’, ‘we’) by a third-party provider (‘TFA Global Pte Ltd’). Please be reminded that you are solely responsible for the trading decisions on your account. There is a very high degree of risk involved in trading. Any information and/or content is intended entirely for research, educational and informational purposes only and does not constitute investment or consultation advice or investment strategy. The information is not tailored to the investment needs of any specific person and therefore does not involve a consideration of any of the investment objectives, financial situation or needs of any viewer that may receive it. Kindly also note that past performance is not a reliable indicator of future results. Actual results may differ materially from those anticipated in forward-looking or past performance statements. We assume no liability as to the accuracy or completeness of any of the information and/or content provided herein and the Company cannot be held responsible for any omission, mistake nor for any loss or damage including without limitation to any loss of profit which may arise from reliance on any information supplied by TFA Global Pte Ltd.
The speaker(s) is neither an employee, agent nor representative of Tradu and is therefore acting independently. The opinions given are their own, constitute general market commentary, and do not constitute the opinion or advice of Tradu or any form of personal or investment advice. Tradu neither endorses nor guarantees offerings of third-party speakers, nor is Tradu responsible for the content, veracity or opinions of third-party speakers, presenters or participants.

Nikkei 225 Index Surges Above 41,000 PointsNikkei 225 Index Surges Above 41,000 Points
As the chart indicates, the value of the Nikkei 225 stock index has risen above the 41,000-point level — its highest mark since July 2024.
The primary bullish driver is the conclusion of a trade agreement between the United States and Japan. According to media reports, the deal will involve Japan paying a 15% duty on exports to the US, down from the previous 25% tariff. Shares of automotive companies are among the top gainers on the Japanese stock market.
European stock indices have also risen, as EU officials are scheduled to visit Washington on Wednesday, raising hopes for a potential US-EU trade agreement.
Technical Analysis of the Nikkei 225 Chart
Approximately a month ago, we outlined an ascending channel based on the price fluctuations observed in 2025. This formation remains relevant, and:
→ The price has moved into the upper half of the channel, suggesting that the median line may act as a support level going forward.
→ The nature of the latest price action is worth noting: as an immediate reaction to the news of the deal, two long bullish candles formed on the chart. However, once the price reached its 2025 high, upward momentum slowed sharply.
→ The RSI indicator signals overbought conditions.
Thus, it is reasonable to assume that, following an approximate 3.6% surge over an eight-hour period, the bullish momentum may have largely been exhausted. Nikkei 225 (Japan 225 on FXOpen) could now be vulnerable to a pullback, potentially towards the median line. Nonetheless, the ultimate direction will be shaped primarily by fundamental news.
This article represents the opinion of the Companies operating under the FXOpen brand only. It is not to be construed as an offer, solicitation, or recommendation with respect to products and services provided by the Companies operating under the FXOpen brand, nor is it to be considered financial advice.
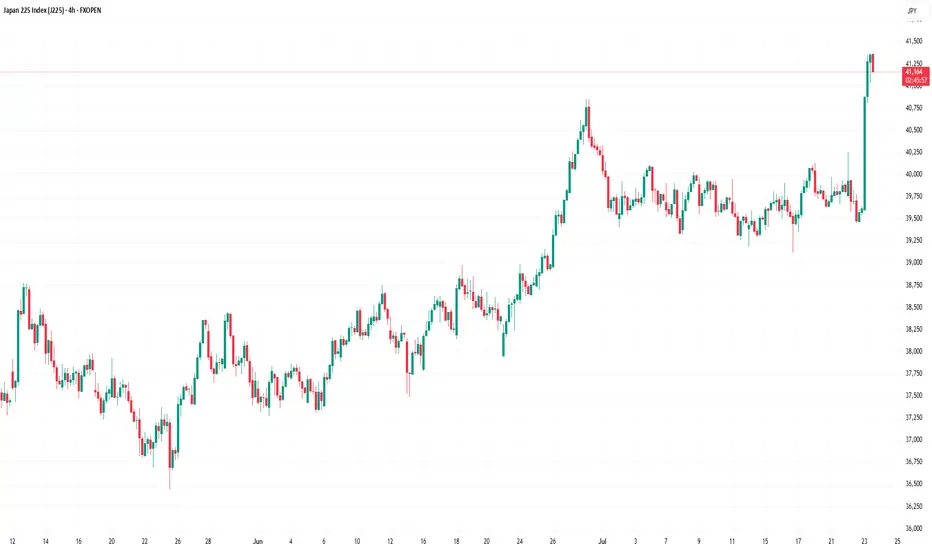
Nikkei Futures Try for ATHsWith US President Trump finalizing an agreement with Japan by imposing a 15% tariff on US businesses for Japanese products, Japanese stocks are flying due to the new found competitive advantage they have
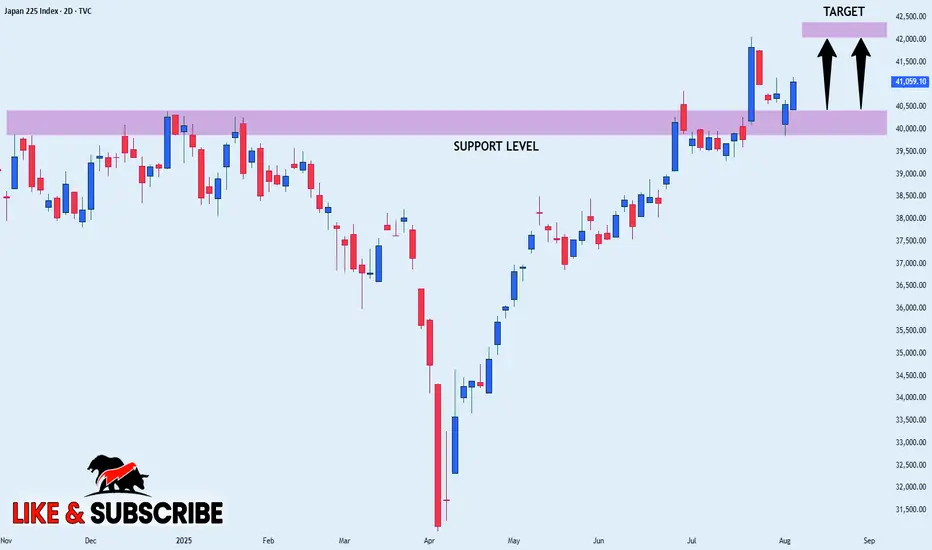
JAPAN as a HERO? UP! GOKU Last Fight! JAPAN is the last one to join the party! The final fight for the #BlowoffTop.
Why is this so important? If you look at correlations with BTC, global liquidity, China, the Fed’s interest rates, and more, Japan plays a key role. After China, Japan is the next to wake up and give the final push to this Bull Market.
The last time the Nikkei dropped more than 25% was during the COVID crash. What happened next? It rallied 26% in the first 52 days and extended its Bull Market to over 88% from the bottom.
With the current Carry Trade crisis (still unresolved), the TVC:NI225 has dropped more than 25% again, and guess what? It’s up 26% in the first 52 days... History doesn’t repeat, but it often rhymes.
It’s feeling like 2017 all over again... What do you think? 🚀📈

Nikkei 225 H4 | Swing-high resistance at 50% Fibo retracementThe Nikkei 225 (JPN225) is rising towards a swing-high resistance and could potentially reverse off this level to drop lower.
Sell entry is at 40,069.57 which is a swing-high resistance that aligns with the 50% Fibonacci retracement.
Stop loss is at 40,350.00 which is a level that sits above the 61.8% Fibonacci retracement and a swing-high resistance.
Take profit is at 39,371.10 which is a multi-swing-low support.
High Risk Investment Warning
Trading Forex/CFDs on margin carries a high level of risk and may not be suitable for all investors. Leverage can work against you.
Stratos Markets Limited (tradu.com ):
CFDs are complex instruments and come with a high risk of losing money rapidly due to leverage. 66% of retail investor accounts lose money when trading CFDs with this provider. You should consider whether you understand how CFDs work and whether you can afford to take the high risk of losing your money.
Stratos Europe Ltd (tradu.com ):
CFDs are complex instruments and come with a high risk of losing money rapidly due to leverage. 66% of retail investor accounts lose money when trading CFDs with this provider. You should consider whether you understand how CFDs work and whether you can afford to take the high risk of losing your money.
Stratos Global LLC (tradu.com ):
Losses can exceed deposits.
Please be advised that the information presented on TradingView is provided to Tradu (‘Company’, ‘we’) by a third-party provider (‘TFA Global Pte Ltd’). Please be reminded that you are solely responsible for the trading decisions on your account. There is a very high degree of risk involved in trading. Any information and/or content is intended entirely for research, educational and informational purposes only and does not constitute investment or consultation advice or investment strategy. The information is not tailored to the investment needs of any specific person and therefore does not involve a consideration of any of the investment objectives, financial situation or needs of any viewer that may receive it. Kindly also note that past performance is not a reliable indicator of future results. Actual results may differ materially from those anticipated in forward-looking or past performance statements. We assume no liability as to the accuracy or completeness of any of the information and/or content provided herein and the Company cannot be held responsible for any omission, mistake nor for any loss or damage including without limitation to any loss of profit which may arise from reliance on any information supplied by TFA Global Pte Ltd.
The speaker(s) is neither an employee, agent nor representative of Tradu and is therefore acting independently. The opinions given are their own, constitute general market commentary, and do not constitute the opinion or advice of Tradu or any form of personal or investment advice. Tradu neither endorses nor guarantees offerings of third-party speakers, nor is Tradu responsible for the content, veracity or opinions of third-party speakers, presenters or participants.
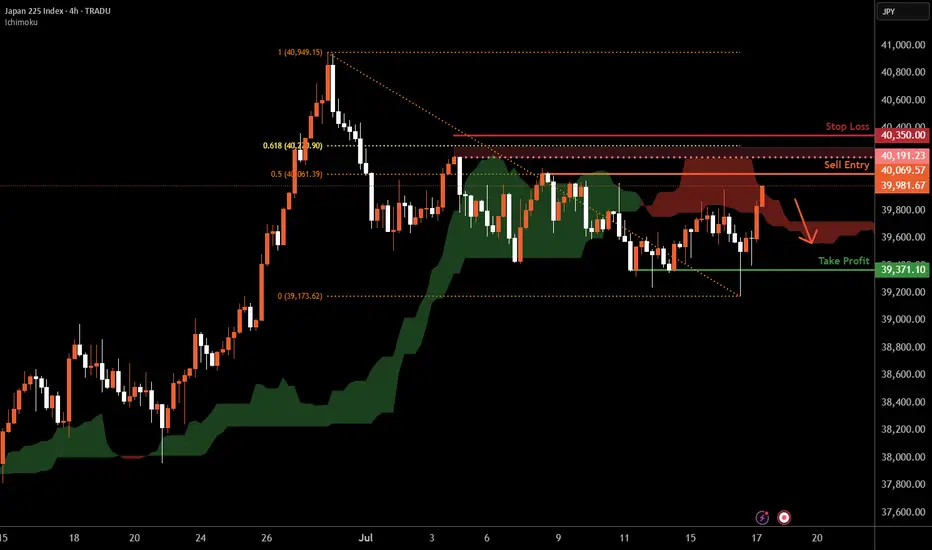
NI225 NIKKEI 225 25-7-11Japan stocks remind me the most of this time in 1975, which marked a bottom. It’s not identical at all. Just the closest I could compare it to. It’s at all time highs and after a year or so of consolidation. The thing is now looks even better for a textbook W reversal up now. It’s a striking pattern really you can clearly see it. I wouldn’t be surprised if it makes more spikes back down though also before resuming an upward trend.
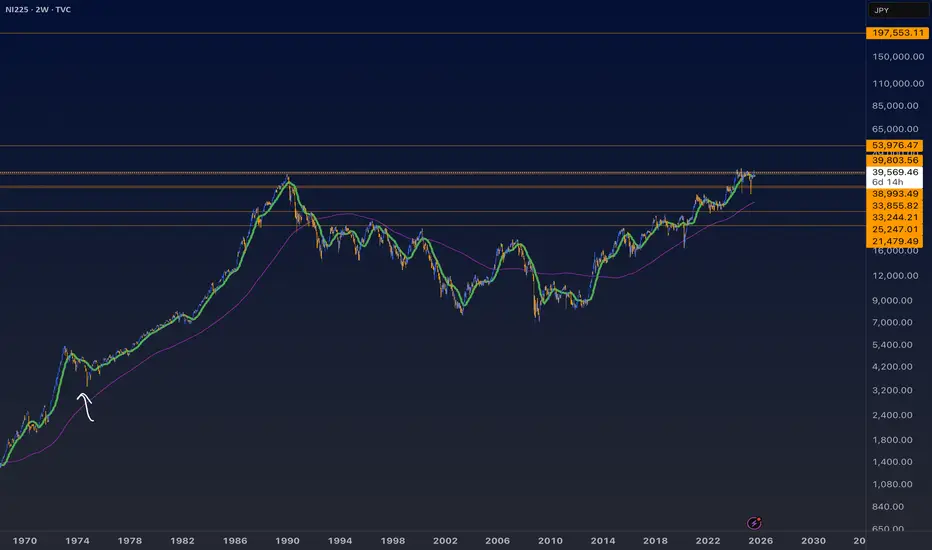
Nikkei 225 H1 | Swing-high resistance at a Fibo confluence zoneThe Nikkei 225 (JPN225) is rising towards a swing-high resistance and could potentially reverse off this level to drop lower.
Sell entry is at 40,196.22 which is a swing-high resistance that aligns with a confluence of Fibonacci levels i.e. the 78.6% projection and the 127.2% extension.
Stop loss is at 40,480.00 which is a level that sits above the 161.8% Fibonacci extension and an overlap resistance.
Take profit is at 39,712.53 which is a swing-low support.
High Risk Investment Warning
Trading Forex/CFDs on margin carries a high level of risk and may not be suitable for all investors. Leverage can work against you.
Stratos Markets Limited (tradu.com ):
CFDs are complex instruments and come with a high risk of losing money rapidly due to leverage. 63% of retail investor accounts lose money when trading CFDs with this provider. You should consider whether you understand how CFDs work and whether you can afford to take the high risk of losing your money.
Stratos Europe Ltd (tradu.com ):
CFDs are complex instruments and come with a high risk of losing money rapidly due to leverage. 63% of retail investor accounts lose money when trading CFDs with this provider. You should consider whether you understand how CFDs work and whether you can afford to take the high risk of losing your money.
Stratos Global LLC (tradu.com ):
Losses can exceed deposits.
Please be advised that the information presented on TradingView is provided to Tradu (‘Company’, ‘we’) by a third-party provider (‘TFA Global Pte Ltd’). Please be reminded that you are solely responsible for the trading decisions on your account. There is a very high degree of risk involved in trading. Any information and/or content is intended entirely for research, educational and informational purposes only and does not constitute investment or consultation advice or investment strategy. The information is not tailored to the investment needs of any specific person and therefore does not involve a consideration of any of the investment objectives, financial situation or needs of any viewer that may receive it. Kindly also note that past performance is not a reliable indicator of future results. Actual results may differ materially from those anticipated in forward-looking or past performance statements. We assume no liability as to the accuracy or completeness of any of the information and/or content provided herein and the Company cannot be held responsible for any omission, mistake nor for any loss or damage including without limitation to any loss of profit which may arise from reliance on any information supplied by TFA Global Pte Ltd.
The speaker(s) is neither an employee, agent nor representative of Tradu and is therefore acting independently. The opinions given are their own, constitute general market commentary, and do not constitute the opinion or advice of Tradu or any form of personal or investment advice. Tradu neither endorses nor guarantees offerings of third-party speakers, nor is Tradu responsible for the content, veracity or opinions of third-party speakers, presenters or participants.
