Nifty analysis..
Nifty has reached its demand level, as mentioned yesterday.”
Always keeps simple analysis...
Nifty50analysis

Nifty Analysis EOD – December 26, 2025 – Friday🟢 Nifty Analysis EOD – December 26, 2025 – Friday 🔴
Bears Breach 26,100: Psychological 26K Tested as Support Levels Crumble.
🗞 Nifty Summary
The Nifty started with a weak footing, opening below the PDL. Although it initially found support near 26,104 and attempted to fill the gap, a sharp rejection at the PDC pushed prices back down through the CDO, CDL, and the 26,104 level.
After a brief range-bound period near 26,070 where a symmetrical triangle formed, the subsequent breakdown dragged the index into the previous gap zone near 26,030. Following 45 minutes of high uncertainty and tight consolidation, a final leg down marked the day’s low at 26,008.60.
A late Bull Flag pattern facilitated a 50-point recovery, allowing the Nifty to close at 26,047.65, down -99.80 points (-0.38%). As predicted in our previous notes, the breakdown below 26,120 successfully triggered tests of 26,104 and 26,070.
🛡 5 Min Intraday Chart with Levels
🛡 Intraday Walk
The day was a masterclass in bearish control, with sellers swiftly grabbing 100 points of ground from the bulls.
The failure to sustain the initial gap-fill and the sharp rejection at the PDC set a negative tone that persisted for most of the session.
The symmetrical triangle breakdown and the subsequent uncertainty near 26,050 highlighted the lack of buyer conviction until the very end of the day.
The late recovery is a small silver lining, but the structural damage below 26,100 is evident.
📉 Daily Time Frame Chart with Intraday Levels
🕯 Daily Candle Breakdown
Open: 26,121.25
High: 26,144.20
Low: 26,008.60
Close: 26,042.30
Change: −99.80 (−0.38%)
🏗️ Structure Breakdown
Type: Bearish candle.
Range (High–Low): ≈ 136 points — moderate volatility.
Body: ≈ 79 points — reflecting clear selling pressure and bearish dominance.
Upper Wick: ≈ 23 points — weak buying attempt near the open quickly rejected.
Lower Wick: ≈ 34 points — buying interest emerged near the psychological 26,000 level.
📚 Interpretation
The market opened near 26,121 but failed to find any follow-through buying. Sellers maintained control throughout the session, pushing the price to the brink of the 26K mark. While the partial recovery from the lows shows that buyers are defending the psychological round number, the close remains significantly below the open. This structure reflects sustained short-term bearish pressure within the broader consolidation zone.
🕯 Candle Type
Bearish Candle with Lower-Wick Support Attempt — Signals selling dominance; buyers are active near lower levels but require a strong follow-up session to confirm a bottom.
🛡 5 Min Intraday Chart
⚔️ Gladiator Strategy Update
ATR: 173.50
IB Range: 72.65 → Medium
Market Structure: ImBalanced
Trade Highlights:
09:32 Short Trade: Target Hit (1:1.15) (PDL Breakout)
11:07 Short Trade: Target Hit (1:1.85) (Range Breakout)
13:45 Long Trade: SL Hit (Contra Trend)
Trade Summary: The strategy capitalized on the clear bearish intent early on, hitting targets on both the PDL breakdown and the mid-morning range breakout. However, the late-afternoon attempt to catch the contra-trend recovery resulted in a stop-loss hit as the market remained volatile near the lows.
🧱 Support & Resistance Levels
Resistance Zones:
26070
26104 (Major Polarity Resistance)
26155
Support Zones:
26030
26000 (Psychological)
25985 ~ 25965 (Critical Defensive Zone)
🧠 Final Thoughts
“The 26,000 psychological zone is the next battleground.”
The upcoming session will be tricky.
While 26K acts as a psychological cushion, the structural momentum is currently with the bears. We must wait for the opening tick and the formation of the Initial Balance (IB).
I am expecting a potential test of 25,985; if we see recovery signs there, a relief rally could be in the cards.
However, any failure to reclaim 26,104 will keep the pressure firmly on the downside.
✏️ Disclaimer
This is just my personal viewpoint. Always consult your financial advisor before taking any action.

How Did The Nifty 50 React Today 26 DecThis video explains how the Nifty 50 reacted on 26 Dec 2025 by observing intraday price behavior, market structure, and reactions near key levels. The analysis focuses on how momentum weakened after the initial move, how price responded around resistance, and why the structure suggests the possibility of a move toward the next support area.
The purpose of this video is to help understand today’s price behavior in Nifty 50 through a price-action perspective. This breakdown is shared purely for educational and awareness purposes, without making any trading or investment recommendations

Smart Money Can Exit Their PositionThis video explains how smart money is able to exit their positions by operating as a coordinated group rather than as individual traders. The discussion focuses on how institutions plan exits using liquidity, timing, and market structure, and why these exits often occur without creating obvious signals for retail participants.
The objective of this video is to help understand smart money thinking, team-based execution, and exit behavior from a market-structure and price-action perspective—purely for learning and awareness, not for trade recommendations.

NIFTY 50 Bullish Scenario: Weekly ChartNIFTY 50 Bullish Scenario: Weekly Chart
* Expected next couple of weeks Bullish and upside target is 26277.
* We might get a retracement day when we hit previous short term high (27107.10) which will be a good opportunity to add longs for
*Area market with green rectangle is SR flip/Support , price recently showed are strong upside reaction from this are.

Chart Talk - Nifty it not yet Complete Bullish Hey Guys Welcome to Chart Talk
Today Nifty opened Gap-up and sustained went upside but after that the resistance came so market down over all trend looks down for tomorrow I have explained my View
Thank you

Nifty Analysis EOD – November 6, 2025 – Thursday🟢 Nifty Analysis EOD – November 6, 2025 – Thursday 🔴
Another day of controlled weakness — bears still holding the steering wheel.
🗞 Nifty Summary
Nifty opened with a mild +25-point gap-up, quickly filled the gap within the first minute, and bounced nearly 90 points from the lows. However, the index failed to sustain above the Previous Day Close (PDC) for long and slipped below the 25,550 support zone before 10:10 AM.
Post that, Nifty spent almost the entire session hovering around the 25,550 level, forming a tight 50-point range between 25,520 and 25,575. Activity remained brisk inside this narrow band — a typical sign of short-term balance building after directional exhaustion.
Around 12:45 PM, an attempt to break out toward 25,615 faced rejection, pushing Nifty back inside the range. Finally, around 3 PM, the index broke down from this mini distribution, marking the day’s low at 25,491.55 and closing at 25,519.95, slightly above the intraday bottom.
Overall, it was a single-distribution day, where bears dominated the main trend as well as sub-trend structures.
Bias remains bearish below 25,640, while a decisive break and hold above it could trigger a short-covering move. Until then, the expectation remains for Nifty to test the 25,330–25,300 zone in the near term.
🛡 5 Min Intraday Chart with Levels
📉 Daily Time Frame Chart with Intraday Levels
🕯 Daily Candle Breakdown
Open: 25,593.35
High: 25,679.15
Low: 25,491.55
Close: 25,509.70
Change: −87.95 (−0.34%)
🏗️ Structure Breakdown
Type: Another bearish candle with a medium body and a clear upper wick.
Range (High–Low): 187.6 points → continued volatility.
Body: ≈ 83.65 points → steady selling across the day.
Upper Wick: ≈ 85.8 points → strong rejection near intraday highs.
Lower Wick: ≈ 18.15 points → minor recovery but bears stayed in charge.
📚 Interpretation
Nifty opened slightly higher but couldn’t hold above 25,650, facing supply near 25,670–25,680. Breaking below 25,500 during the mid-session confirmed the continuation of weakness seen after recent bearish candles. Although there was a mild recovery toward the close, the settlement below 25,510 underscores sustained selling pressure.
🕯Candle Type
A lower-high, lower-close continuation candle that reinforces the ongoing short-term corrective phase. The extended upper shadow reflects selling on every rise — a clear hallmark of a market still in the grip of bears.
🛡 5 Min Intraday Chart
⚔️ Gladiator Strategy Update
ATR: 201.14
IB Range: 91.95 → Medium
Market Structure: Balanced
Trade Highlights:
10:09 – Short Trade → Target Achieved (R:R 1:1.56)
13:44 – Short Trade → Target Achieved (R:R 1:2.4)
📌 Support & Resistance Levels
Resistance Zones:
25,550
25,585
25,615 ~ 25,635
Support Zones:
25,460 ~ 25,440
25,380
25,340
25,310 ~ 25,290
💡 Final Thoughts
The index continues to exhibit controlled weakness, with bears gradually grinding down support levels while bulls fail to sustain any momentum. As long as 25,640 remains intact, selling on rise remains the favored approach. A breach below 25,440 could accelerate a test toward 25,300.
“Markets don’t reverse when you want them to — they reverse when enough traders are trapped.”
✏️ Disclaimer
This is just my personal viewpoint. Always consult your financial advisor before taking any action.

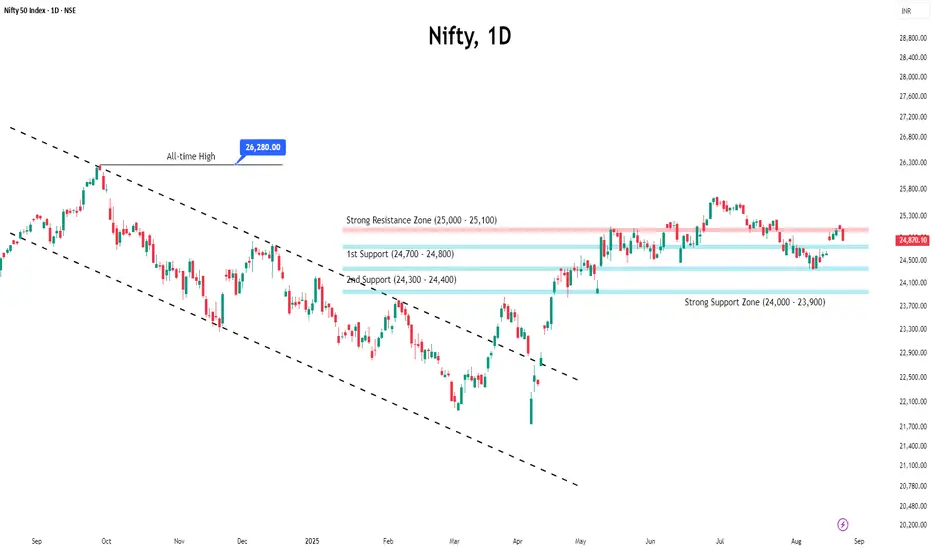
"Nifty Hits a Red Light After a Four-Week Sprint — What’s Next?"Indian markets finally took a breather after a four-week winning streak, ending the week marginally lower at 25,722.
The week began on an upbeat note, with the index advancing through the first three sessions. However, back-to-back declines in the last two days wiped out those early gains.
Even with this mild correction, October stood out as the best month in seven months, marking the strongest performance since March.
Technically, the index appears to be losing some steam after hitting a strong resistance near 26,000. This weakness could drag it toward the 25,400–25,500 support zone, and if the weakness deepens, a slide toward 25,000 cannot be ruled out.
On the fundamental side, one key factor to watch is India’s ongoing bilateral trade negotiations with the US, which are now in their final stages — a development that could sway market sentiment in the near term.
For traders, the strategy remains clear: stay stock-specific and adopt a buy-on-dips approach, as the broader market undertone remains constructive.
Nifty Analysis EOD – October 29, 2025 – Wednesday🟢 Nifty Analysis EOD – October 29, 2025 – Wednesday 🔴
Bulls fight back, but 26,100 still guards the gate to new highs
🗞 Nifty Summary
Nifty opened 22 points higher at 25,982 and immediately tested the 26010 ~ 26020 resistance zone within the first 5 minutes. This zone once again acted as a strong supply area, forcing an early rejection and filling the opening gap.
Despite multiple attempts, Nifty couldn’t break through in the first hour. During this phase, a symmetrical triangle pattern took shape, and its breakout finally triggered a sharp move upward, pushing the index beyond both the 26010 ~ 26020 zone and the PDH level.
However, the bulls failed to hold above PDH, slipping back below where the same zone flipped into support. From there, with persistent effort, Nifty managed to reclaim the PDH and mark a new intraday high near 26085 ~ 26100, the next key resistance zone.
Around 1:10–1:15 PM, heavy volume spikes were noted — particularly on ITM option strikes — signaling a fierce tug-of-war between buyers and sellers. Price consolidated in this area and created a false breakout, eventually sliding back to retest PDH and the 26010 ~ 26020 zone.
By the closing bell, Nifty settled at 26,068.30, posting a 102.90-point gain — a healthy positive finish despite intraday turbulence.
Yesterday’s note had warned about false breakouts, which proved useful today. Up to 13:40, Nifty moved cleanly along a trendline, but once it broke, bias turned unclear — signaling traders to step back. Those who detached after the early profit phase likely preserved gains and avoided the afternoon whipsaws.
Going ahead, 26010 ~ 26020 must hold as support to keep bullish momentum intact. A breakout above 26,100 could open the door toward 26,220, 26,280, and possibly a new all-time high (ATH) soon.
🛡 5 Min Intraday Chart with Levels
🛡 Intraday Walk
Gap-up open of 22 pts → early rejection at 26010 ~ 26020.
Gap filled → forms symmetrical triangle.
Breakout triggers sharp rally → crosses PDH, hits 26085 ~ 26100.
Fakeout at highs → slides back below PDH to support.
Afternoon session volatile, strong volumes between 1:00–1:15 PM.
Index rebounds again, closes strong near 26068.
📉 Daily Time Frame Chart with Intraday Levels
🕯 Daily Candle Breakdown
Open: 25,982.00
High: 26,097.85
Low: 25,960.30
Close: 26,053.90
Change: +117.70 (+0.45%)
🏗️ Structure Breakdown
Type: Bullish candle with small lower shadow and moderate upper wick.
Range (High–Low): 137.55 pts → steady intraday movement.
Body: ≈ 71.9 pts → consistent buying strength.
Upper Wick: ≈ 43.95 pts
Lower Wick: ≈ 21.70 pts
📚 Interpretation
The session opened flat, briefly dipped below 25,960, and then trended higher. Buyers maintained firm control through the day, though some supply was visible near 26,100. The close near the upper end of the range confirms bullish continuation.
🕯Candle Type
Bullish Continuation Candle (Rising Marubozu variant)
Indicates renewed buying interest following a brief pause in momentum (after previous spinning top).
🛡 5 Min Intraday Chart
⚔️ Gladiator Strategy Update
ATR: 202.26
IB Range: 64.75 → Medium
Market Structure: Balanced
Trade Highlights:
10:10 – Long Trade → Target Achieved (R:R 1:2.45)
12:10 – Long Trade → Target Achieved (R:R 1:1.36)
13:30 – Long Trade → SL Hit
📌 What’s Next? / Bias Direction
Bias: Bullish continuation with cautious optimism.
Holding 26,010–26,020 keeps the trend intact;
break above 26,100 can extend the rally toward 26,220+.
📌 Support & Resistance Levels
Resistance Zones:
25996
26010 ~ 26020
26085 ~ 26100
Support Zones:
25865
25828
25790
25725 ~ 25715
💡 Final Thoughts
“Momentum rewards patience — not prediction.”
Nifty is showing healthy consolidation beneath resistance, and the strength of the last two sessions indicates buyers are still in charge. One decisive breakout above 26,100 could set the tone for the next leg higher.
✏️ Disclaimer
This is just my personal viewpoint. Always consult your financial advisor before taking any action.

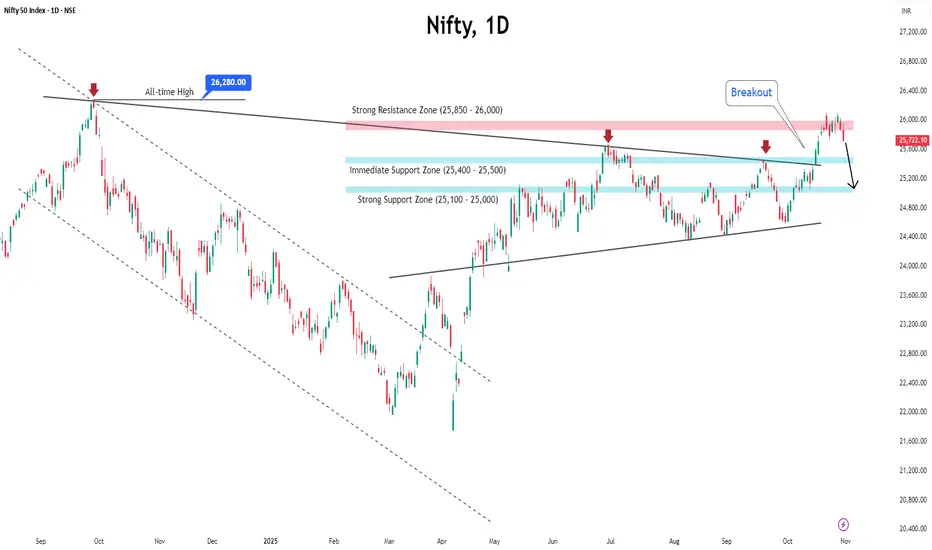
Nifty Hits the 26K Wall—Market Awaits the Spark for a Big LeapAfter six consecutive gains, the Indian benchmark Nifty paused on Friday and slipped slightly from its recent highs, mainly due to profit booking.
Despite the mild correction, the index still ended the week in green, registering modest gains — a sign that the broader market sentiment remains upbeat.
Meanwhile, The India VIX declined 0.30% to 11.59, pointing to subdued market volatility.
Technical View:
On the charts, Nifty attempted a breakout above the 26,000 mark but couldn’t sustain above it.
According to Open Interest (OI) data:
● Resistance: 26,000 remains the strong resistance zone, with heavy call writing indicating a supply wall.
● Support: The 25,500–25,400 zone holds firm as crucial support, backed by significant put writing activity.
Key Triggers for the Week Ahead:
1. US Fed Meeting (Oct 28–29)
Markets will watch closely as the Federal Reserve meets this week. Experts widely expect a rate cut to support growth and ease borrowing costs.
2. Q2 FY26 Earnings Season
The ongoing earnings season will continue to drive stock-specific moves as major Indian corporates announce their quarterly results.
3. US–China Presidential Meeting
Investors will keep an eye on global cues from the upcoming U.S.–China talks, which could influence global sentiment and trade outlook.
4. India–US Trade Deal Progress
Reports suggest India is close to finalising a trade pact with the U.S. — a move that could further boost investor confidence if concluded smoothly.
Looking Ahead
Nifty seems to be catching its breath within a tight range of 25,400–26,000. The bias remains positive, but a decisive breakout above 26,000 is needed to confirm fresh upside momentum.
Until then, traders should focus on stock-specific opportunities, manage risk tightly and stay agile — the next breakout could set the tone for November’s trend.

Pre-Diwali Cheer on Dalal Street! Nifty Hits Fresh Yearly HighIndian markets extended their rally for a third straight session on Friday, October 17, with the Nifty hitting fresh one-year highs, spreading early Diwali cheer across Dalal Street.
With this surge, the Nifty 50 is now just 2.16% away from its all-time high of 26,277, reached in September 2024. October has been particularly strong, with the index closing most sessions in the green and posting month-to-date gains of 4.46%, its best performance since March 2025.
Key Drivers of the Rally
● Consumption Stocks Lead the Charge – FMCG and other consumption-oriented stocks gained as investors anticipate improved volume growth.
● Banking Sector Strength – A strong start to the earnings season, led by Axis Bank, boosted confidence with better-than-expected margins and improving asset quality. Nifty Bank NSE:BANKNIFTY even hit a fresh all-time high in the last session.
● Foreign Investor Support – FPIs turned net buyers, helping fuel the rally.
● Positive Macroeconomic Signals – Hopes of an India-U.S. trade deal and falling crude oil prices added to market optimism.
● Geopolitical Stability – Easing tensions in the Middle East reduced risk sentiment, supporting equities.
● Earnings Recovery Expectations – Investors expect H2 FY26 to see stronger earnings, aided by GST rate cuts and the RBI’s cumulative 100-basis-point repo rate reduction, boosting domestic consumption.
Technical Observations
Nifty has broken past the trendline resistance near its previous high of 25,670, signaling continued bullish momentum.
● Immediate support: 25,400–25,500
● Strong support: 25,000
● Resistance zone: 25,850–26,000
Outlook
Next week may stay muted as market holidays on October 21 and 22 could limit major moves. Nifty is likely to remain sideways with a slight bullish bias. Muhurat trading on Tuesday, October 21 (1:45 PM–2:45 PM) will serve as an early indicator of market momentum post-Diwali.

Nifty Pauses Below Resistance, Eyes Earnings-Driven MoveIndian markets closed on a strong note last week, with the Nifty rising over 1.5% to 25,285. The rally was led by IT sector (up nearly 5%) and PSU banks (up around 1.5%), reflecting sectoral strength during the earnings season.
The India VIX inched up 0.42% to 10.10, still near multi-month lows, though volatility may rise as corporate results roll in.
Technically, the Nifty is now testing a crucial resistance zone at 25,400–25,500, aligning with the apex of a large symmetrical triangle pattern. Open interest data shows heavy call writing at this zone, while strong put writing around 25,100–25,200 indicates immediate support. A decisive breakout on either side may set the tone for the next directional move.
Looking ahead, some consolidation or range-bound movement is likely as the market digests earnings and global developments. US–China trade tensions and semiconductor supply chain concerns may weigh on sentiment if risks intensify.
Given the current setup, traders are advised to adopt a cautious, stock-specific approach. While the broader bias remains positive, protecting profits and avoiding aggressive long positions until a clear breakout is confirmed would be prudent.

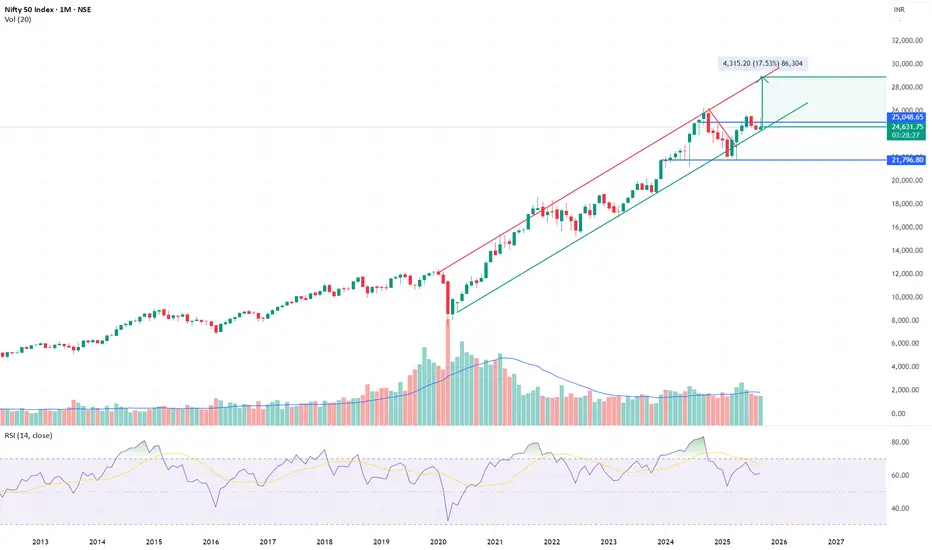
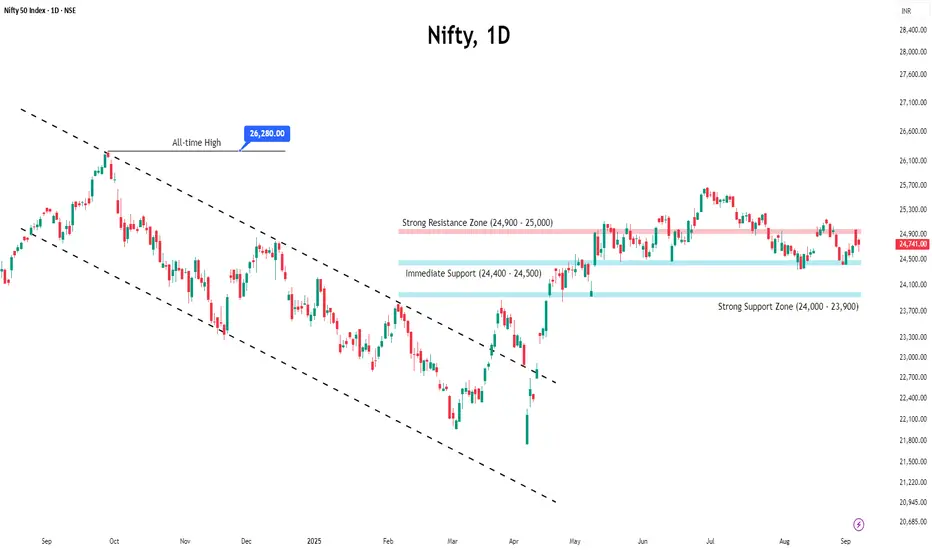
NIFTY 50 – Holding Lower Channel, Eyeing Continuation Above 26kNIFTY is respecting the lower boundary of its long-term upward channel near 24.5–24.6k. This zone remains the key support for the secular uptrend.
Support: 24,000–24,200 must hold to preserve structure.
Trigger: A sustained break above 26,000 would mark continuation of the bull leg, with targets at 28,500–29,000.
Risk: Losing 24k opens room for a deeper slide toward the 21,800 channel base.
Macro Context: Domestic earnings growth remains constructive, but global liquidity, crude oil, and US yields will dictate the timing of the next leg.
Verdict: NIFTY is at the lower channel inflection, not the top. As long as 24k holds, the setup remains bullish, with 26k as the breakout trigger for continuation.
For educational purposes only. This is not investment advice.
Nifty Rides 3-Week Rally, Faces Tough Resistance AheadThe Indian benchmark indices extended their rally for the third week in a row, reinforcing the ongoing bullish sentiment.
From a technical perspective, Nifty is trading just below its long-term trendline resistance, where it recently lost some steam. Immediate support lies in the 25,200–25,300 zone, while resistance is expected around 25,400–25,500, due to heavy call writing.
On the global front, markets were briefly unsettled after Donald Trump announced a sharp H-1B visa fee hike, triggering concerns for Indian IT companies. However, clarity came soon after — the White House confirmed that the $100,000 fee would apply only to new petitions, not to renewals or existing holders. This eased fears, ensuring minimal impact on ongoing IT operations.
Outlook: Nifty may witness short-term swings amid global uncertainties, but the broader setup still points to an underlying bullish trend.

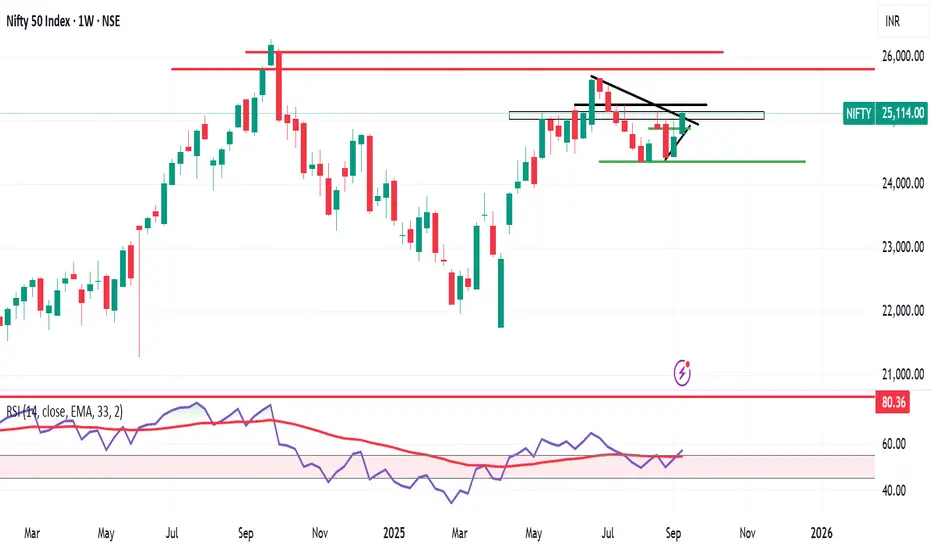
Nifty Weekly Market Outlook – Bulls on the ChargeNifty closed the week at 25,114 (+373 points 📈),
with a high of 25,139 and low of 24,751.
As I mentioned last week, Nifty once again played perfectly within my range of 25,100 – 24,300.
Now, we are standing at a critical resistance zone of 25,200 – 25,300 – exactly where the market started its downward journey after 21st Aug 2025.
🔑 Key Levels to Watch for Next Week
✅ Bullish Scenario:
If Nifty sustains above 25,250, we may see a strong move towards 25,500 / 25,600.
❌ Bearish Scenario:
A break below Friday’s low of 25,038 could invite bears back and take Nifty down to 24,700 or even lower.
💡 Pro Tip for Investors
Those waiting for a dip to invest might get a chance around 18th / 19th September.
But remember – waiting too long often means missing the rally!
✅ Action Plan:
📋 Keep a list of fundamentally strong stocks ready.
📉 If Nifty corrects towards 24,200 / 24,000, start buying in SIP mode – don’t wait for the “perfect bottom.”
🌎 S&P 500 Update
S&P 500 closed at 6,584 (+100 points), finally touching the crucial Fib level of 6,568.
📈 Above 6,568: Rally towards 6,959 could start.
🔒 Trailing SL: Move your stop-loss to 6,430 to lock profits and protect gains.
Nifty Holds Above 25K, Market Drivers Signal More UpsideNifty’s winning streak hit eight sessions, closing above psychological 25,000 mark as global optimism and strong domestic cues kept the rally alive.
Technical View
● The index has registered a fresh breakout above the trendline resistance, pointing toward renewed bullish momentum.
Key Levels to Watch
● Immediate resistance is seen around 25,200–25,300, while a stronger hurdle lies at 25,500–25,600.
● Support has shifted higher to 25,000–24,900, keeping the short-term outlook positive.
Market Drivers
● Global cues: Hopes of a US Fed rate cut and progress on the India–US trade deal have lifted market sentiment.
● Domestic macros: India’s economy looks strong with solid financial stability, steady GDP growth, and easing inflation.
● Consumer demand: Spending is expected to rise sharply after September 22, especially in automobiles and consumer durables, which could boost markets in the near term.
● Policy & earnings: Market mood is supported by GST reforms, easier monetary policy, and positive earnings expectations for the second half of FY26.
Strategic View
● The overall market trend is expected to stay positive. Traders should follow a buy-on-dips strategy with strict stop-losses. As long as Nifty holds above support, it can gradually move higher in the coming sessions.

Nifty Analysis EOD – September 12, 2025 – Friday 🟢 Nifty Analysis EOD – September 12, 2025 – Friday 🔴
Momentum Building – Eyes Set on 25,240 Next
🗞 Nifty Summary
Nifty began the session with a strong 80-point gap-up, right at our first target level. A sudden retracement of 50 points found support at the previous two days' high (25,038), which became the day’s low.
From there, the index climbed gradually yet confidently toward the resistance zone of 25,085 ~ 25,095, where it paused briefly. After the breakout, a sharp move pushed the index to our second target of 25,140, marking the day’s high at 25,139.45 — just 16 points shy of the Inside Bar Pattern target.
Following this intraday expansion, the index cooled off and retraced toward the 25,085 ~ 25,095 zone, settling into a small consolidation range between 25,100 ~ 25,125. The day ended at 25,104.55 on a very positive note.
Overall, today’s session fulfilled our expectations.
👉 Tomorrow, a sustained breakout above 25,140 ~ 25,160 may open the door toward the powerful supply and resistance zone of 25,240.
🛡 5 Min Intraday Chart with Levels
📉 Daily Time Frame Chart with Intraday Levels
🕯 Daily Candle Breakdown
Open: 25,074.45
High: 25,139.45
Low: 25,038.05
Close: 25,114.00
Change: +108.50 (+0.43%)
🏗️ Structure Breakdown
Green candle (Close > Open).
Body: ~39.55 points → moderate.
Upper wick: ~25.45 points.
Lower wick: ~36.40 points.
Balanced intraday action with attempts from both bulls and bears, but closed firmly higher.
📚 Interpretation
Buyers defended 25,038–25,040 support zone consistently.
Price moved above 25,100, though sellers capped near 25,140.
The candle reflects controlled bullishness with gradual accumulation, not a runaway rally.
🕯Candle Type
Balanced bullish candle / small-bodied bullish bar → shows steady buying interest.
📉📈 Short-Term View – September 12, 2025
Support: 25,040 (defended strongly for the 4th session).
Resistance: 25,140 (fresh rejection zone).
👉 Key Insight:
The market is forming a tight upward channel with bulls gradually pushing, but sellers remain active near resistance.
Sustaining above 25,140 will be crucial to target 25,240.
📊 Context over last 3 sessions (September 4–8):
Market is holding 24,940–25,040 as a strong floor.
Each session shows a higher close → steady buying pressure accumulating.
🛡 5 Min Intraday Chart
⚔️ Gladiator Strategy Update
ATR: 178.76
IB Range: 51.7 → Medium
Market Structure: ImBalanced
Trade Highlights:
10:00 AM – Long Trigger → Target Hit (R:R - 1:2.5)
📌 Support & Resistance Levels
Resistance Zones:
25,140 ~ 25,160
25,240
Support Zones:
25,085
25,035
25,000 ~ 24,975
24,940
💡 Final Thoughts
Today’s action reflects a healthy consolidation phase with bullish undertones. Bulls are preparing for a potential breakout, while sellers defend the upper band. The next session’s ability to sustain above 25,140–25,160 will be a clear momentum trigger.
📖 “Patience in accumulation today builds strength for tomorrow’s breakout.”
✏️ Disclaimer
This is just my personal viewpoint. Always consult your financial advisor before taking any action.

Nifty Wraps Week Positive: Sustainability in QuestionIndian equity markets closed the week with strong gains, with the Nifty rising 1.29% supported by solid domestic economic data and policy reforms.
Key economic indicators like Q1 GDP growth at 7.8%, steady FDI inflows, and a smaller current account deficit have boosted investor confidence.
Despite these positives, global challenges and heavy FII selling over the last two months (₹94,600 crore) still pose risks.
Sector-wise, the picture is mixed. While the overall market outlook is positive, weakness in banking and IT is restraining gains. A rebound in these sectors is crucial for the uptrend to sustain.
Technically, the index faces immediate resistance at the 24,950–25,000 zone, with support positioned at 24,500–24,400.
A decisive breakout from this range is needed to establish the next directional trend; otherwise, the market is poised for a period of consolidation.
Nifty Analysis EOD – September 5, 2025 – Friday🟢 Nifty Analysis EOD – September 5, 2025 – Friday 🔴
Double Bottom at the Lows—Hope for Bulls or Just Another Trap?
🗞 Nifty Summary
Nifty opened with a 98-point gap-up at 24,825 but showed hesitation, spending the first 45 minutes stuck in the CPR zone within a narrow 60-point band. By 10 AM, the index slipped sharply—breaking both IB Low and BC level, and within minutes also pierced PDL, tumbling nearly 143 points. Support emerged at S1 (24,635), where the fall finally halted.
The index then spent over two hours base-building between PDL and S1, forming a double bottom (Adam–Eve) pattern. Once this base broke out above PDL, the index rallied quickly, meeting its upside target.
Structurally, the session shaped into a triple distribution day:
Early selling phase,
Midday consolidation,
Late recovery rally.
Intraday option traders found strong opportunities with fast 2x expansion off a small IB, but swing traders likely struggled with whipsaws.
Closing nearly flat at 24,741 (+6.7 pts) keeps the directional dilemma alive. Yesterday’s rejection repeated today—but the 125-point recovery off lows and close above PDL gives bulls a glimmer of hope.
🛡 5 Min Intraday Chart with Levels
📉 Daily Time Frame Chart with Intraday Levels
🕯 Daily Candle Breakdown
Open: 24,818.85
High: 24,832.35
Low: 24,621.60
Close: 24,741.00
Change: +6.70 (+0.03%)
🏗️ Structure Breakdown
Red candle (Close < Open), but still slightly positive vs. previous day.
Body: 77.85 pts → small bearish body.
Upper wick: 13.50 pts → negligible.
Lower wick: 119.40 pts → long tail.
🕯Candle Type
Hammer / Pin Bar → indicates potential reversal with bullish undertone.
📚 Interpretation
Market slipped nearly 200 pts intraday but bounced back strongly.
Long downside tail reflects demand defense at 24,620–24,635 zone.
Despite red body, price action leans neutral-to-bullish.
🔍 Short-Term View – September 8, 2025
Support: 24,620 (defended low).
Resistance: 24,830–24,980 (recent rejection zone).
👉 Bias Direction:
> If 24,620 breaks, weakness could extend to 24,450.
> If 24,830 sustains, bulls may regain the upper hand.
🛡 5 Min Intraday Chart
⚔️ Gladiator Strategy Update
ATR: 211.61
IB Range: 59.7 → Small
Market Structure: Balanced
Trade Highlights:
1) 10:00 AM – Short Trigger → Target Hit (R:R = 1:3.64)
📌 Support & Resistance Levels
Resistance Zones:
24,785
24,835 ~ 24,845
24,895 ~ 24,910
24,975 ~ 25,004
Support Zones:
24,685
24,657
24,630 ~ 24,620
24,540 ~ 24,525
💡 Final Thoughts
Today’s Hammer at the lows signals that buyers are quietly absorbing supply. But conviction remains missing—two back-to-back sessions show indecision at higher levels. Until either 24,620 breaks or 24,830 is sustained, expect choppy action favoring intraday trades over positional setups.
📖 “Reversals don’t start with noise—they begin with defense at key levels.”
✏️ Disclaimer
This is just my personal viewpoint. Always consult your financial advisor before taking any action.

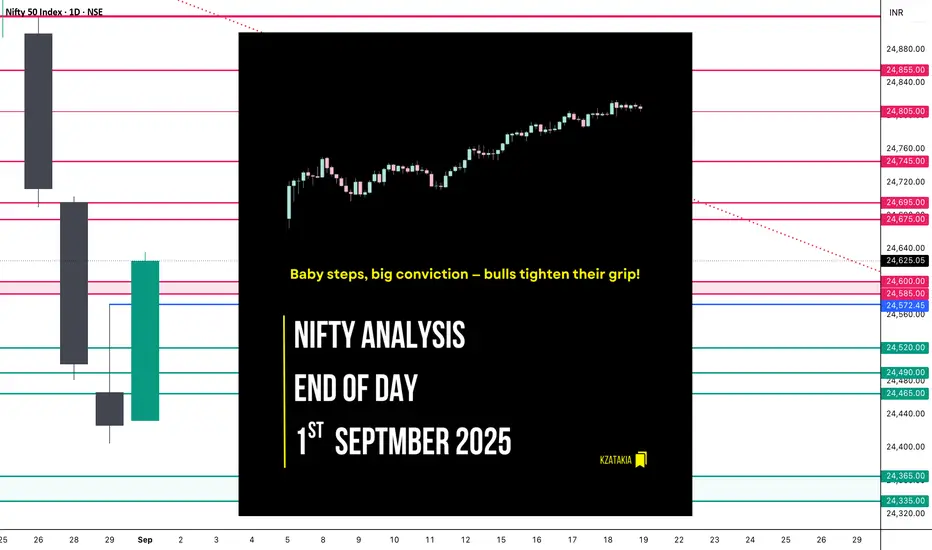
Nifty Analysis EOD - September 1, 2025 - Monday🟢 Nifty Analysis EOD - September 1, 2025 - Monday 🔴
Baby steps, big conviction — bulls tighten their grip!
🗞 Nifty Summary
Nifty opened with a 47-point gap-up, carrying a positive vibe. The index extended gains by nearly 80 points, marking a high of 24,560.85 before slipping back to 24,500. There it found strong support and gradually climbed to break IB High and later breach PDH.
Step by step, bulls showcased steady dominance, ultimately closing at 24,624.15, a solid 190-point gain. The daily timeframe formed a Bullish Marubozu candle, breaking out and closing above the Previous Day High — a decisive statement from buyers.
🛡 5 Min Intraday Chart with Levels
🚶 Intraday Walk
Opened gap-up +47 points.
Climbed ~80 points, touched 24,560.85.
Pulled back to 24,500, took support.
Gradually rose, broke IB High, then PDH.
Closed at 24,624.15, strong bullish grip intact.
📉 Daily Time Frame Chart with Intraday Levels
🕯️ Daily Candle Breakdown
Open: 24,432.70
High: 24,635.60
Low: 24,432.70
Close: 24,625.05
Change: +198.20 (+0.81%)
🏗️ Structure Breakdown
Green candle (Close > Open).
Body: 192.35 points → strong, dominant.
Upper wick: ~10.55 points (negligible).
Lower wick: 0 (open = low).
🕯Candle Type
Bullish Marubozu (near perfect).
📚 Interpretation
Market opened at low, never looked back.
Strong buying all day, closing at peak.
After 3 days of selling (23–25 Aug), this candle marks first solid bullish comeback.
Short-Term View
Support: 24,430 (today’s low & open).
Resistance: 24,635 (today’s high) → breakout may target ~24,800.
Trend Context: After a bearish continuation, today signals a bullish reversal. Needs follow-through buying in the next 1–2 sessions.
🛡 5 Min Intraday Chart
⚔️ Gladiator Strategy Update
ATR: 201.88
IB Range: 93.05 → Medium
Market Structure: Balanced
Trade Highlights
12:25 → Long trade triggered - Trailing SL hit ( R:R = 1 : 1.16 )
📌 Support & Resistance Levels
Resistance Zones
24,675 ~ 24,695
24,745
24,805
24,855
Support Zones
24,575
24,520
24,490 ~ 24,465
🔮 What’s Next? / Bias Direction
Momentum has shifted in favour of bulls, with today’s Marubozu breakout signalling strong conviction. As long as Nifty sustains above 24,500–24,520 zone, buyers remain in control. A clean break above 24,635 opens the gates for 24,800 and beyond.
💭 Final Thoughts
Today’s action reminded us: “Trends don’t announce themselves, they whisper first — and today’s candle was a loud hint.”
✏️ Disclaimer
This is just my personal viewpoint. Always consult your financial advisor before taking any action.
Nifty Ends August in Pain: Can September Spark a Turnaround?Nifty slipped nearly 1.8% in the last week of August as global headwinds and US-India tariff concerns weighed on sentiment.
Selling was broad-based, with Banking and Financials dragging the index down the most.
The index currently trades just above 24,400, a crucial support level. Open interest data indicates that the 24,400–24,300 zone may provide short-term support, while the 25,500–25,600 zone remains significant resistance due to heavy call writing. A decisive break below 24,300 could quickly push the index toward 24,000.
Amid the weakness, a silver lining emerges — India’s strong 7.8% GDP growth, the highest in five quarters and well above expectations, may help cushion further downside.
Looking ahead, Monday’s open will set the tone for September—a gap-up above 25,500 could spark a rebound, while staying below may keep Nifty under pressure.
Why is Nifty50 Falling? | Technical OutlookBackground:
On 30th June, Nifty50 made a high of 25,699.35. From that point, the index entered a bearish trend, which extended down to the recent low of 24,337.50. This low marked a Break of Structure (BoS), signaling that a pullback phase was likely to follow.
-----------------------------------------------------------------------------------------------------------------
Pullback Phase:
The pullback began on 11th August, when price failed to break below the previous low and started forming higher highs (HH) and higher lows (HL).
If we plot a Fibonacci retracement from 30th June (high) to 11th August (low), the 0.618 (golden ratio) comes in around 25,139.45.
-----------------------------------------------------------------------------------------------------------------
Price Action:
On 14th August, the market opened with a gap up, likely leaving some unfilled buy orders behind. This gap also opened within the supply premium zone around the golden fib level.
Since then, the price has reversed to the downside, forming lower lows (LL) and lower highs (LH) aligning with the higher time frame bearish trend.
------------------------------------------------------------------------------------------------------------------
Key Levels to Watch:
24,600 – 24,465: Important POI (Point of Interest) for buyers.
24,337.50: A crucial structural level. If this level holds and price begins to form HH and HL again, it can be considered a strong low for buyers.
-------------------------------------------------------------------------------------------------------------------
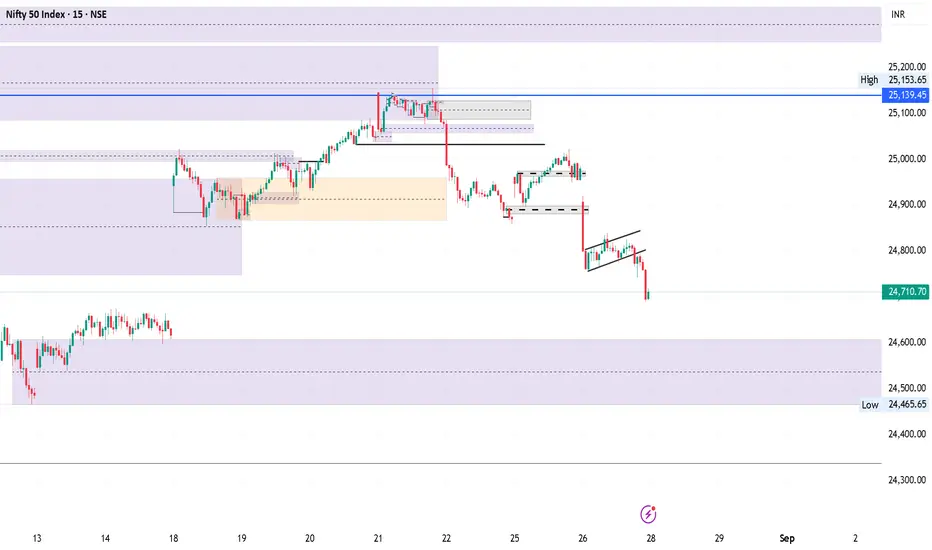
Chart Patterns (15m timeframe):
Head & Shoulders formation.
Bear Flag pattern.
------------------------------------------------------------------------------------------------------------------
Additionally, Gift Nifty is already showing signs of weakness near 24,600. With markets closed tomorrow for the festive holiday, Thursday could potentially open with a gap down.
Nifty Hits Resistance; Volatility Looms Ahead of Monthly ExpiryReason Behind the Fall
The Indian market snapped its six-session winning streak on Friday as investors turned cautious ahead of US Federal Reserve Chair Jerome Powell’s speech at the Jackson Hole symposium.
Concerns over the upcoming 25% US tariffs, set to take effect on August 27, further added to market volatility.
Importantly, Powell signalled in his remarks on Friday that the Federal Reserve is likely to cut interest rates in September.
Technical Setup
The Nifty faced rejection from the key resistance zone of 25,000–25,100, which may trigger further downside towards 24,500–24,400.
OI Data Analysis
Open interest data shows significant call writing at 25,000, reinforcing it as a strong resistance for the upcoming monthly expiry.
On the downside, 24,800 is emerging as immediate support with notable put writing. If this level fails to hold, the next support is likely near 24,500.
Suggested Strategy
With the additional tariff deadline approaching alongside monthly expiry, heightened volatility is expected.
Traders are advised to stay cautious and adopt a wait-and-watch approach until the index provides clear directional cues.