NIFTY 50 Analysis For Feb 23rd!Hello Traders,
Here is a Brief Overview About The Analysis of NIFTY 50 For Feb 23rd,
There Are Total of 3 Support Zones Which You Need To Look For And Same 2 Resistance Zones And To Be Mentioned One Grey Area And We Have 3 Imbalance Zones!
The Horizontal Lines From Volume To Volume And OI To OI Indicates The Market Range in Between For That Particular Day!
The Blue Arrow Path Showing The Direction of The NIFTY 50 For That Day.
Note : Those Levels Are For That Particular Day Only.
Please Note That The Only Purpose of The Information On This Page is Purely Educational.
We Are Not Registered with SEBI; Therefore, Before Making Any Financial Decisions OR Investing, Please Consult with A SEBI-Qualified Financial Advisor. We Don't Have Any Responsibility For Your Profits OR Losses.
I Would Welcome Your Participation And Support in the Form of Likes, Comments, And Follow us to Offer Some Encouragement.
Thank You.
Nifty50pricetrendanalysis

NIFTY 50 Analysis For Feb 22nd!Hello Traders,
Here is a Brief Overview About The Analysis of NIFTY 50 For Feb 22nd,
There Are Total of 3 Support Zones Which You Need To Look For And Same 2 Resistance Zones And To Be Mentioned One Grey Area And We Have 5 Imbalance Zones!
The Horizontal Lines From Volume To Volume And OI To OI Indicates The Market Range in Between For That Particular Day!
The Blue And Red Arrow Path Showing The Direction of The NIFTY 50 For That Day.
Note : Those Levels Are For That Particular Day Only.
Please Note That The Only Purpose of The Information On This Page is Purely Educational.
We Are Not Registered with SEBI; Therefore, Before Making Any Financial Decisions OR Investing, Please Consult with A SEBI-Qualified Financial Advisor. We Don't Have Any Responsibility For Your Profits OR Losses.
I Would Welcome Your Participation And Support in the Form of Likes, Comments, And Follow us to Offer Some Encouragement.
Thank You.

I think from now Indian market is going to 🚀 shoot up The Indian market is showing signs of a strong recovery after a period of volatility and uncertainty. This is just my analysis its not any type of call

Nifty 50: October week 1 Weekly Market SetupWeekly Review
Nifty 50 declined by 0.18% last week to close at 19,638. The major meltdown was seen on last Thursday (weekly expiry) where the index lost close to 200 points where it touched its key support around 19,495 as per our expectations too. While broadly market is now showing mixed sentiments and is largely looking to be a stock specific trading only.
Week Ahead:,
On Daily charts, technical indicators shows bulls giving a good fght to pick up pace for what all the gains were lost in previous few weeks. Momentum is starting to build u but higher levels at 19,740-795 remains key hurdle to continue the larger rally. On the lower side 19495, 19438 and 19376 are important support to hold on.
From levels perspective, I believe it has been quite a downfall and we should see some uptick or a sideway markets now but to say further the outlook would completely depend on how Q2 numbers starts rolling out and what holds post RBI’s MPC meeting results.
*Disclaimer*: I am not SEBI registered analyst and hence the above market outlook is for only educational study and research purposes only. In no way do I endorse this opinion to take a trade or for any investments in markets in any form by any Participant. Be a responsible investor with proper risk management and keep learning as a true focus.


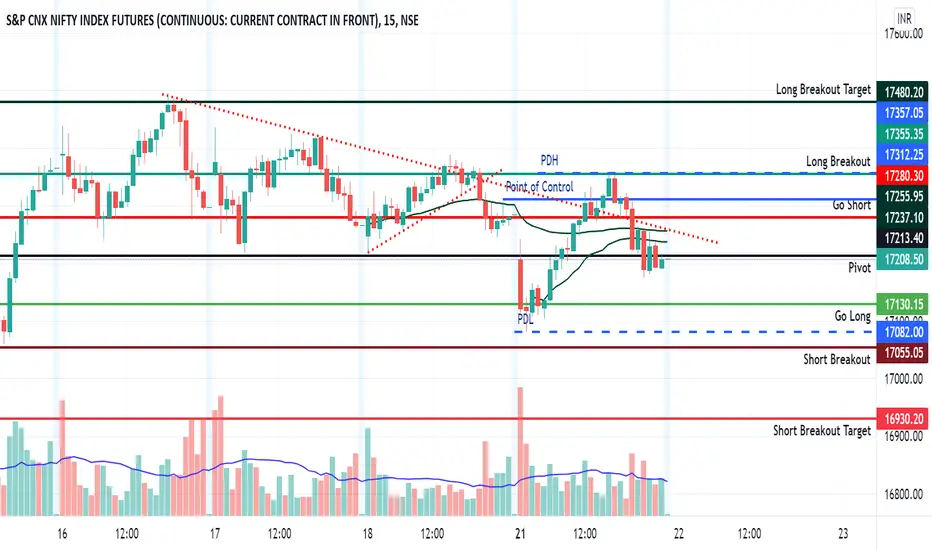
Nifty50 Tuesday trading levels .Nifty50 Tuesday 25/04/2023 trading levels .
This breakout strength will only be confirmed by the end of this week. So it is still good to trade in small quantity.

NIFTY GOING UP to 19000 BUCKLE UP FOR THE RIDE!!!
Price has started making Higher Highs which denotes an Uptrend, currently Price is giving a correction in the downward direction which again sigifies the Impulse Wave is in Uptrend and hence Uptrend is confirm.
Price has this Fresh Demand formed in The Daily chart which synchronises with the Weekly Demand as well, hence this is a Trade Zone in Daily with a minumum Risk 1 against the Reward of 13 makes this a favourable Reward to Risk ratio Trade,
The Target is derived as per the Fibonacci Extension considering the Wave 3 @ 1.618 Level which is Price 18948.15.
Cheers !!! Enjoy the Ride!!!

Nifty hourly Elliott wave analysisThe move from 17348 is corrective. There is no way an elliottician calls it an impulse move going on.
So, the move should be correct 100% to justify it as a corrective move.
There are a few corrective moves that don't retrace fully, eg. the legs of a triangle. But this move seems like it should correct 100% soon.
A good elliottician is not the one who always has counts, but the one who give counts when there is most and more probability and possibility.

NIFTY 50 - Holding the trend lineHi Fellow traders
NIFTY 50 seems to holding the trend line very well and currently touched the upper band.
Very nice move today as per my analysis in my previous post.
Lets see where it goes from here.

NIFTY 50 - Trend Lines (8th Dec Exp)NIFTY 50
- If Candle Breaks & sustains Green line (above / Below) then the target is next green line
- If Candle Breaks & sustains Blue line (above / Below) then the target is next Blue line
Market Range
High Range: 18780 - 18920
Mid Range: 18640 - 18780
Low Range: 18500 - 18640
caution:
cannot guarantee the accuracy of the data & it's presentation
stock market investments are risky by nature so we are not responsible for
your losses or profits, and your returns will depend on
your own personal trading methods only.

Nifty 50 upcoming dayNifty 50 important support17200 break then start to down trend rally to 16000 upcoming months.

NIFTY 50, WAVES(THIS MONTH)!!although nifty 50 has crossed 18000 previously in its 3rd wave, it will reach its new all time high in 5th wave. nifty 50 is following the waves very greatly. i had previously drawn waves for bull run and updated you till 3rd wave. now here's an update for the 5th one.
i have explained each and every trend line , bull run in my previous nifty 50 analysis, and i will link it below, you will understand my analysis more understandingly, after reading the description of those analysis.
nifty is already in a bull run, this bull run is carried in 5 waves, and now we are in the last wave of it.
let see what happens after that...

Nifty 50 range from 17500 to 18500 till September 15th Weekly ExUS CPI data and Indian CPI data suggest that there will be no big downtrend in the market or a big uptrend. The safest range for option selling for the 15th of September weekly expiry is in the range of 17500 to 18500.

nifty50today I was expecting a correction or bearish market, following a head & Shoulder pattern in nifty if it goes as marked direction to the level of 17234 we can sell only it cross and sustain below that level.

#Nifty During Market count change FOMC meeting rate hike 75bps is what market expected, a rally to complete and make a local top?
I think monthly wave 4 is finished here at almost 50% retracement - looks fishy?
For now wave count has changed.
You have to follow rules in this market and rules like HA candle, Trigger line will always work.
Always use stop loss.
The entire rally suggested that weekly green ABC is done.
I will wait for price to fall below previous green candle, or I will need a red candle on Heikinashi chart to start a confirmation of down trend. Till then scalpi opportunities continue.

NiftyFutures Key Trading Levels Weekly 4th July to 8th July#Nifty50 Futures Key Trading Levels Weekly 4th July to 8th July.
Strong Resistance zone is 15950 to 16000 any breakout above 16000 will lead upside target of 16177 to 16200.
if case of breakdown from Resistance Will lead to downside target of 15780 to 15730.
If It Closes above 15830 on hourly time then Long Position can be created with stop below 15700 for a 1st target of 15968 and if close above 16020 then 2nd Target will be 1677.
If Close below 15680 on hourly time then short positions can be created with stop loss above 15780 for the 1st target of 15609 and further close below 15600 then 2nd target would be 15525, further close below15480 the 3rd target would be 15330 to 15300
Strong support Zone is between 15525 to 15480 any breakdown from this support zone will lead to downside target of 15330 to 15300 or even 15200 level.
Disclaimer: These levels are purely based on Price action/demand and supply zones & and consumed only for educational purpose & should not be taken as buy/sell recommendation. I will not be responsible for any loss/profit incurred if anyone takes trades based on my views.
Please consult your Financial Advisor before making any trading decision.
Leave a comment that is helpful or encouraging. Let's master the markets together.

Nifty Bottom Predictor Pt 2A 50% rally from pre covid also means a minimum touching of -25% is needed before a heathy upmove
Negative July Results
June and July Rate Hikes
Will ensure we hit these,
RSI needs to be create double bottom - please check 2014-15 chart before for exact similarities

Nifty 50 Tips - 24-05-2022Nifty50 following downtrend.
Touch resistance multiple times, facing major resistance.
more downward moment possible. NSE:NIFTY

nifty will recover for a whilecombined analysis of both EW & PA clearly tells that wave C3(third leg) completed at 15711. expecting temporary suspension of UKRAINE war.
HNI,FII are covered their shorts today (to compensate the loss in cash market).
what next? buy calls!

NIFTY 50 BUY SELL.NIFTY making of HEAD & SHOULDER pattern in 1week time fram.. if break 17000.. than we can see long target... buy 17000PE AND SELL 17000CE
aap log line chart me clearly dekhskte hai head and shoulder pattern

Nifty Futures Key Trading Levels for 22nd Feb 2022 ExpiryNifty Futures Key Trading Levels for 22nd Feb 2022 Expiry
Disclaimer: These levels are purely based on Price action/demand and supply zones & and consumed only for educational purpose & should not be taken as buy/sell recommendation. I will not be responsible for any loss/profit incurred if anyone takes trades based on my views.
Please consult your Financial Advisor before making any trading decision.
Leave a comment that is helpful or encouraging. Let's master the markets together.
Jackpot #nifty50 view as discussed in Morning 18th Jan 2021Nifty 50 view as we discussed in the morning. #Nifty

Breakdown of long trendline #nifty50 18 jan as we can see nifty was following the trendline long back which is breakdown today. Maybe we get to see the downfall till the red line below that circle I have drawn.
let's see what the market shows us!!!
#nifty50 #markettoday
