Nifty trying to inch back into Bullish territoryNifty has done a good job so far in the last 2 weeks to inch back towards bullish territory. This was the second week where we saw a fantastic Green candle. We saw Nifty close above an important Fibonacci resistance of 24994 at 25114.
The Next major Fibonacci resistances are at 25152 which is very near and 25378 which might also look relatively nearby. Once we get a closing above these 2 levels the next targets for Nifty will be at 25669, 26044 and 26529. Let us see if Nifty momentum takes us above 25152 or 25378 within next week.
If the resistance stops nifty growth the supports for Nifty will be at Fibonacci levels of 24994, 24804, 24645 (next strong Fibonacci support). Final support for Nifty before it falls back into bearish zone will be at 24337. Mother line support of 50 Weeks EMA is at 24144.
Shadow of the candle looks positive as of now and RSI is also slowly getting into the Bullish zone. Currently the RSI of Weekly chart is 56.99 which is very conducive for further progress.
Disclaimer: The above information is provided for educational purpose, analysis and paper trading only. Please don't treat this as a buy or sell recommendation for the stock or index. The Techno-Funda analysis is based on data that is more than 3 months old. Supports and Resistances are determined by historic past peaks and Valley in the chart. Many other indicators and patterns like EMA, RSI, MACD, Volumes, Fibonacci, parallel channel etc. use historic data which is 3 months or older cyclical points. There is no guarantee they will work in future as markets are highly volatile and swings in prices are also due to macro and micro factors based on actions taken by the company as well as region and global events. Equity investment is subject to risks. I or my clients or family members might have positions in the stocks that we mention in our educational posts. We will not be responsible for any Profit or loss that may occur due to any financial decision taken based on any data provided in this message. Do consult your investment advisor before taking any financial decisions. Stop losses should be an important part of any investment in equity.
Niftyfibo

Good Closing By Nifty On Hourly ChartNifty has finally closed above the Mother and Father resistance line on the hourly chart. We have tried to draw the Fibonacci retracement based on recent movements of Nifty which can be seen in the chart. We can clearly see the places from where Nifty found resistance recently where Fibonacci lines and places where Nifty took support where also Fibonacci lines.
To know more about Fibonacci retracement and use them for trading/investing you can read my book THE HAPPY CANDLES WAY TO WEALTH CREATION. In this book you can also know more about Trend lines, Supports, Resistances, Mother line and Father line and to draw the same on your chart and for learning Techo-Funda analysis read my Book THE HAPPY CANDLES WAY TO WEALTH CREATION. Heart of the book is my Mother, Father and Small child theory which makes investment easy for those who understand it an use it in their analysis. The book is available on Amazon and will help you in your investing journey whether you are a seasoned investor or a new beginner. The chapters in the book are mostly standalone. The book is rated 4.8/5 on Amazon. It is a value for money book priced at Rs.349/- (Delivery charges extra as charged by Amazon).
Now the next Fibonacci level resistances for Nifty will be at: 24994(Tough Trend line resistnace and Fibonacci resistance, 25152, 25378 and 25669. Above 25669 closing the major Bull run can begin which can take Nifty towards 26K+ levels indicated in the chart.
Mother line and Father line are both supports as of now these are at 24760 and 24783. So the zone between 24760 and 24783 becomes a very strong support zone.
Fibonacci supports for Nifty will be at: 24645 and 24337. A closing below 24337 will create a bear grip on the market which can drag if further downwards.
As of now the shadow of the candles is looking positive and green in colour.
Disclaimer: The above information is provided for educational purpose, analysis and paper trading only. Please don't treat this as a buy or sell recommendation for the stock or index. The Techno-Funda analysis is based on data that is more than 3 months old. Supports and Resistances are determined by historic past peaks and Valley in the chart. Many other indicators and patterns like EMA, RSI, MACD, Volumes, Fibonacci, parallel channel etc. use historic data which is 3 months or older cyclical points. There is no guarantee they will work in future as markets are highly volatile and swings in prices are also due to macro and micro factors based on actions taken by the company as well as region and global events. Equity investment is subject to risks. I or my clients or family members might have positions in the stocks that we mention in our educational posts. We will not be responsible for any Profit or loss that may occur due to any financial decision taken based on any data provided in this message. Do consult your investment advisor before taking any financial decisions. Stop losses should be an important part of any investment in equity.

The Year that was and the year that can be. 2024/2025 story.Highlights of 2024:
a) Single digit return for Nifty in 2024. Nifty and Sensex rise 9% each.
b) Mid and Small Cap both rise 24% each.
c) Pharma and Real Estate both rise 40% each.
d) Trent, M&M and Bharti Airtel are the best performing Nifty stocks.
e) Asian Paints, Indusind Bank and Nestle are the worst performing Nifty stocks.
f) Dixon, BSE, OFSS and RVNL are the best performing Midcap stocks.
g) Vodafone Idea, AU SFB & Bandhan Bank are top Mid cap loosers.
Zones Where Nifty can form base and give closing in 2025.
Pessimistic Zone: In case of very negative year and some global catastrophe we can find Nifty forming a bottom between 19922 to 18476. *(Looks very unlikely as of now)*
Negative Zone: In case we have a negative closing for the year we may find Nifty closing the year between 21137 to 19922. *(Possible but we might get a bottom here and then the index might move upwards)*
Neutral Zone: The combination of Neutral to negative and neutral to Positive zone ranges from 26277 to 21137. Nifty can consolidate in this range. *(These are the lows and high of 2024).*
Positive Zone: We can see Nifty making a new high above 26277 and 27880. After which we can see a dip and further consolidation. *(A probable scenario)*
Optimistic Zone: In case we have a fantastic year we might see Nifty making a major peak between 27880 and 30060. *(This is a very optimistic scenario and less likely but you can never say never)*
Above assumptions of Nifty in 2025 are made based on Fibonacci Retracement applied from top to bottom and Bottom to top on the 2024 candle.
Disclaimer: The above information is provided for educational purpose, analysis and paper trading only. Please don't treat this as a buy or sell recommendation for the stock. We do not guarantee any success in highly volatile market or otherwise. Stock market investment is subject to market risks which include global and regional risks. We will not be responsible for any Profit or loss that may occur due to any financial decision taken based on any data provided in this message.

Be cautious while travelling in the Runaway Train (Nifty). Passengers of the Runaway Train (Nifty) need to be cautious now. The current Nifty rally has hit the Euphoria phase. India is watching a Bullet train rally and probably the station is near by. Reasons behind the rally are:
1) Recent Assembly elections considered as Semi Finals before the lok sabha elections of 2024 met the market expectations.
2) US Fed continued a the rate hike Pause and there were some indications of rate cut cycle starting in 2024.
3) Some opinion polls suggesting return of the incumbent government for the Third time in India.
Political Stability is what market loves. If we add global factors like rate hike pause that gave a steroid dose to the markets.
The question is: What should the investor do now?
1) Book Profit in the risky / mid-cap / Small-cap stocks with weak fundamentals. At least partial profits can be booked.
2) Find avenues where growth is still possible. Choose stocks with strong fundamentals / Monopoly / Strong MOAT. (Some large caps companies fall in this category)
3) Look at the Technicals and Fundamentals of the company you are investing in.
4) Be very choosy.
I am an advocate of staying invested in the market come what may but portfolio rotation, some reshuffling profits into fundamentally strong players with vision for growth is need of the hour.
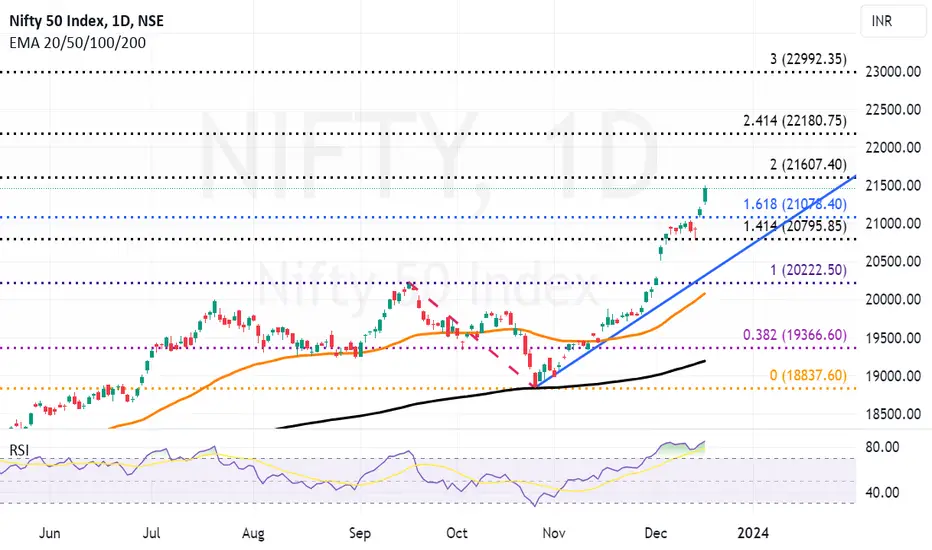
As far as support and Resistance levels are concerned the next fibonacci resistance will be at 21607. If the euphoria continues into reminder of the month we may even see the levels of 22180. If the momentum continues further into 2024 I see the rally reaching 22922 or 23000 levels. Supports at the lower level are 21235, 21078. 20795 level will be a strong support level falling below which bears will start breathing again.
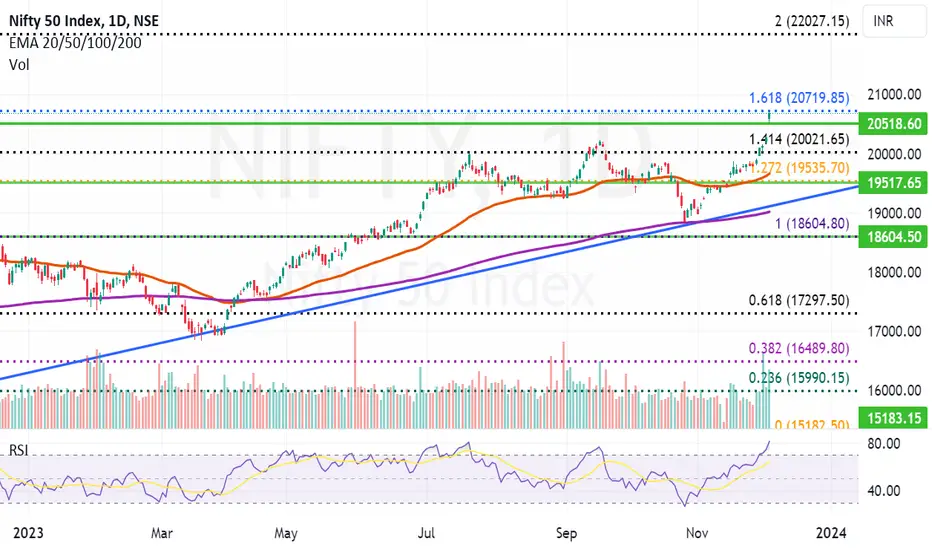
After a Mega Breakout Nifty Faces Major Fibonacci Resistance. After a Mega Breakout Nifty Faces Major Fibonacci Resistance in the coming days. This resistance is at 20720. Once we get a closing above 20720 channel going towards 22000 will open. Since Nifty may face consolidation / Profit booking in the coming days the supports for Nifty will remain near 20518 and 20021. 19659 will be the level closing below which bull run might end.
Nifty missed our Target of 20002 by about 10 points. Nifty just missed our Target of 20002 by just about 10 points. RSI is indicating that the Nifty has entered the overbought zone and a small or medium sized correction is due. however the fibonacci levels applied to Nifty Indicate a medium term target of Nifty near 20126. To reach there Nifty has to cross the major hurdle at 20002. Incase Nifty respects the Overbought Zone RSI correction theory a little bit of Correction might be due with a support at 19800, 19724, 19418 being a major Fibonacci support and below that 19321 is the main support. 50 days EMA of Nifty is too deep at 18861 below which the trend will change into a negative one.

The hourly Channel broken on the upper side. What Next?The hourly channel that we were following since last 2 months or more has been broken on the upper side due to the ongoing mad bull run. The question that comes to various minds is what next for Nifty or where next for Nifty. To answer that we go back to the daily chart and apply simple fibonacci levels. Fibonacci levels on daily charts suggest the following supports and resistances:
Next Fibonacci Resistance at: 19448 followed by 20162 (Both have potential to be Major resistances with many minor resistances in between).
Fibonacci Supports: 18887.6 (previous Peak), 18446 (Major Fibonacci support and 50 days EMA very close to it), 17856 (Another Mega Fibonacci support with 200 days EMA very close by).
