Nifty Analysis EOD – November 3, 2025 – Monday🟢 Nifty Analysis EOD – November 3, 2025 – Monday 🔴
A Day of False Breakouts — Signs of Base Building or Just Another Trap?
🗞 Nifty Summary
Nifty opened 38 points lower, quickly filled the gap in the initial move but couldn’t hold above the 25715 support zone, slipping further to mark the day’s low at 25645.50. From there, a sharp recovery of over 100 points lifted the index above the previous day’s close (PDC) to a new day high of 25761.5, forming the Initial Balance (IB) High.
After a brief retracement, a strong rally attempted to break the IB High, but the very next candle proved it a false breakout, pulling Nifty back under control of the bears. Price hovered near the IB zone, with multiple breakout attempts followed by quick rejections. A double bottom pattern emerged around the earlier swing low, which helped bulls stage another rally toward the IB High — and once again, a false breakout ensued.
Finally, around 2:10 PM, Nifty decisively broke above the IB High, rallying to the next resistance zone of 25790, where it again faced rejection but managed to close near the day’s high at 25774.3, above both CDO and PDC levels.
While the day looked random at first glance, the price behavior reflected a pattern typical of base-building phases — a mix of failed breakouts, mid-range compressions, and reactive rallies. If this indeed is a base formation, the 25700 zone must hold in coming sessions.
As highlighted in yesterday’s note, 25790 was the key level, and today’s close near it makes tomorrow’s close above 25790 crucial for bulls’ continuation. The 25700 level remains the guiding line for short-term structure.
🛡 5 Min Intraday Chart with Levels
🛡 Intraday Walk
Opened 38 points negative and tested 25715 zone.
Failed to sustain, slipped to 25645.5 marking day’s low.
Sharp 100+ point recovery to 25761.5 forming IB High.
Multiple fake breakouts above IB High followed by rejections.
Double bottom near 25650–25670 region provided strong bounce.
Final rally tested 25790 resistance; closed at 25774.3 near the high.
📉 Daily Time Frame Chart with Intraday Levels
🕯 Daily Candle Breakdown
Open: 25,696.85
High: 25,803.10
Low: 25,645.50
Close: 25,763.35
Change: +41.25 (+0.16%)
🏗️ Structure Breakdown
Type: Small-bodied bullish candle with wicks on both ends — indecision with mild bullish bias.
Range (High–Low): 157.60 points → moderate volatility.
Body: ≈ 66.50 points → limited directional strength.
Upper Wick: ≈ 39.75 points → rejection near 25,800.
Lower Wick: ≈ 51.35 points → buying support near 25,650.
📚 Interpretation
After two strong bearish days, Nifty managed to hold key supports and stage a mild comeback. Bulls defended the 25,650–25,700 zone well, though momentum above 25,800 remains lacking. The close above open signals buyer re-entry, albeit cautiously — a potential pause before reversal or consolidation.
🕯Candle Type
A Spinning Top, appearing after consecutive bearish sessions — a classic indecision candle often preceding a short-term base or pullback.
🛡 5 Min Intraday Chart
⚔️ Gladiator Strategy Update
ATR: 201.94
IB Range: 116. → Medium
Market Structure: balanced
Trade Highlights:
9:36 – Long Trade → Target Achieved (R:R 1:1.69)
10:43 – Long Trade → SL Hit
11:26 – Short Trade → Trailing SL Hit
📌 What’s Next? / Bias Direction
The short-term trend remains in flux — bulls are attempting to defend their ground, while bears continue rejecting higher zones.
A close above 25790 could confirm short-term strength and push Nifty toward 25880–25940.
If the 25700 level fails, the market may retest 25580–25550 as the next strong demand area.
📌 Support & Resistance Levels
Resistance Zones:
25790
25865 ~ 25880
25920 ~ 25944
Support Zones:
25635 ~ 25615
25585
25550
25510
25460 ~ 25440
💡 Final Thoughts
“Base-building phases test patience — not skill. The disciplined trader sees patterns where others see noise.”
✏️ Disclaimer
This is just my personal viewpoint. Always consult your financial advisor before taking any action.
Niftyintraday

Nifty Analysis EOD – October 31, 2025 – Friday🟢 Nifty Analysis EOD – October 31, 2025 – Friday 🔴
Bulls Trapped Early — Bears Closed the Week with Authority!
🗞 Nifty Summary
Nifty opened flat to mildly negative, but the sentiment quickly turned bearish as the index slipped 63 points within the first minute, breaking below the Previous Day’s Low (PDL). Just as the tone seemed set for a full bearish day, a sudden aggressive recovery spike flipped the momentum — Nifty rallied 131 points from the day’s low, crossing CDO, CDH, and even the CPR zone.
However, the 25950 resistance zone halted this unexpected surge. The CPR tried to hold as support but eventually failed, leading to a sharp fall below PDL, CDL, and S1. The index finally found a pause around the 25790 support, staying range-bound between 25830 ~ 25760 for most of the session.
In the final minutes (around 2:50 PM), Nifty broke the
consolidation and tested the key 25715 ~ 25725 support zone, closing the day at 25731.90, almost at the day’s low.
The first 20 minutes trapped the bulls, and the bears rode comfortably through the rest of the session. Today’s close erased the past 9 trading days of gains, also finishing below last week’s low, signaling clear selling pressure between 25800 ~ 26,000.
Heading into Monday, sustaining below 25725 ~ 25715 could open the door to the next support zone of 25580 ~ 25550. Bulls need to reclaim 25790 quickly to avoid deeper retracement.
🛡 5 Min Intraday Chart with Levels
🛡 Intraday Walk
Flat-to-weak open quickly turned bearish, breaking PDL.
A surprise 131-point spike trapped early bulls.
Resistance at 25950 and CPR rejection flipped momentum back to bears.
Sharp fall below S1; support emerged at 25790.
Long sideways phase around 25800, followed by a late sell-off to 25725.
Closed near the day’s low — bears in firm control.
📉 Daily Time Frame Chart with Intraday Levels
🕯 Daily Candle Breakdown
Open: 25,863.80
High: 25,953.75
Low: 25,711.20
Close: 25,722.10
Change: −155.75 (−0.60%)
🏗️ Structure Breakdown
Type: Bearish candle with long upper wick, close near day’s low.
Range (High–Low): 242.55 points → wide and volatile.
Body: ≈ 141.70 points → decisive selling pressure.
Upper Wick: ≈ 89.95 points → strong rejection from highs.
Lower Wick: ≈ 10.90 points → weak recovery near close.
📚 Interpretation
Despite a volatile start, the bears dominated throughout. The session’s failed recovery and close near the lows reflect an exhaustion of buying power. The long upper shadow signals repeated rejections at resistance, confirming that sellers continue to defend higher levels strongly.
🕯Candle Type
A Bearish Continuation Candle, extending Thursday’s weakness. The upper shadow rejection shows that bulls’ attempts to reclaim ground were quickly overpowered by sellers.
🛡 5 Min Intraday Chart
⚔️ Gladiator Strategy Update
ATR: 206.86
IB Range: 131.65 → Medium
Market Structure: Imbalanced (Bearish Bias)
Trade Highlights:
9:53 – Short Trade → Target Achieved (R:R 1:2.89)
10:26 – Short Trade → Trailing SL Hit
13:37 – Short Trade → Trailing SL Hit
📌 What’s Next? / Bias Direction
The October expiry week ended with a decisive bearish tone.
If Monday opens below 25715 and fails to reclaim 25790, expect a slide toward 25580 ~ 25550 in the short term.
Conversely, only a close above 25880 can ease selling pressure and hint at a relief bounce.
For now, bearish momentum remains dominant — trade light, stay objective, and let the structure confirm before committing.
📌 Support & Resistance Levels
Resistance Zones:
25790
25865 ~ 25880
25920 ~ 25944
Support Zones:
25635 ~ 25615
25585
25550
25510
25460 ~ 25440
💡 Final Thoughts
“When the market traps the impatient, it rewards the disciplined. Let structure—not emotion—guide your trades.”
✏️ Disclaimer
This is just my personal viewpoint. Always consult your financial advisor before taking any action.

Nifty Analysis EOD – October 30, 2025 – Thursday 🟢 Nifty Analysis EOD – October 30, 2025 – Thursday 🔴
Bears Take the Driver’s Seat — 26K Slips Away Again!
🗞 Nifty Summary
Nifty opened with a 55-point gap-down right at the previously marked support zone of 26010 ~ 26020. However, the very first minute of trade confirmed weakness — the index couldn’t hold this zone and lost nearly 140 points within the first 40 minutes, breaking both key support and PDL levels.
A brief rescue attempt came from 25900, leading to a 75-point bounce, but conviction was missing — the market stayed rangebound for the majority of the session. Around 1:30 PM, a breakdown below IB Low triggered another wave of selling, marking the day’s low at 25845 in a highly volatile session.
By the close, Nifty settled at 25891.20, down 177 points, reflecting a clear shift in control to the bears.
🛡 5 Min Intraday Chart with Levels
🛡 Intraday Walk
Gap-down open near key support (26010–26020) failed instantly.
Sharp 140-point fall in early trade broke multiple support levels.
Rebound from 25900 lacked conviction; sideways phase dominated mid-session.
Breakdown below IB Low (13:30) opened a fresh range to 25845.
Wild volatility throughout; end-of-day close below 26K strengthened bearish grip.
📉 Daily Time Frame Chart with Intraday Levels
🕯 Daily Candle Breakdown
Open: 25,984.40
High: 26,032.05
Low: 25,845.25
Close: 25,877.85
Change: −176.05 (−0.68%)
🏗️ Structure Breakdown
Type: Bearish candle with long upper wick and wide range.
Range (High–Low): 186.80 points → high volatility.
Body: ≈ 106.55 points → strong selling pressure.
Upper wick: ≈ 47.65 points → rejection from intraday highs.
Lower wick: ≈ 32.60 points → mild recovery from lows.
📚 Interpretation
The day began with optimism but ended in disappointment for bulls. Early strength faded quickly as sellers dominated from 26,000 onward.
The close near the lower end of the range confirms profit booking and mild distribution at higher levels. This candle follows the earlier bullish continuation with a strong bearish response, signaling short-term caution.
🕯Candle Type
A Bearish Engulfing–like continuation candle, though not textbook perfect, represents a decisive rejection near 26K — an early warning for bulls.
🛡 5 Min Intraday Chart
⚔️ Gladiator Strategy Update
ATR: 202.90
IB Range: 139.80 → Medium
Market Structure: Imbalanced (Bearish Tilt)
Trade Highlights:
10:31 – Short Trade → Trailing SL Hit
10:57 – Long Trade → Target Achieved (R:R 1:1.31)
13:18 – Long Trade → SL Hit
📌 What’s Next? / Bias Direction
As mentioned in yesterday’s note, 26010 ~ 26020 was the must-hold zone — and losing it handed full control to bears.
For bulls to regain ground, Nifty needs to close above 26K with strength.
For bears, a close below 25700 will confirm short-term dominance and possibly extend weakness toward 25580–25500.
Until then, expect high volatility and range-bound play. Avoid emotional trades; discipline is your edge.
📌 Support & Resistance Levels
Resistance Zones:
25920
25944
25977
26010 ~ 26020
Support Zones:
25865 ~ 25845
25810 ~ 25790
25725 ~ 25715
💡 Final Thoughts
“Markets test patience before rewarding conviction. In volatility, your biggest weapon is restraint.”
✏️ Disclaimer
This is just my personal viewpoint. Always consult your financial advisor before taking any action.

Nifty Analysis EOD – October 3, 2025 – Thursday🟢 Nifty Analysis EOD – October 3, 2025 – Thursday 🔴
Bulls stamp authority with a strong close near the highs
🗞 Nifty Summary
Nifty opened with a 67-point gap down at 24,785.70, and the first 5-min candle was wild, spanning 97 points. The initial upmove managed to fill the gap but couldn’t sustain above, slipping back quickly.
The IB Range (24,747.55 – 24,855.70) set the tone, and for most of the session (until 2:40 PM), the index swung wildly inside this wide band, offering multiple trade opportunities on both sides.
Around 2:10 PM, a trendline false breakdown (liquidity trap) shook out bears. Soon after, bulls reclaimed control, breaking the trendline, PDC, and PDH, and pushed the index to a new day high of 24,904.80. Nifty closed strong at 24,895, almost at the high, firmly above the previous day’s high.
The session was energetic for traders, packed with volatility and clean structure, and the close reinforced bullish continuation.
🛡 5 Min Intraday Chart with Levels
🛡 Intraday Walk
Gap down open at 24,785.70.
First 5-min candle = 97 points → extreme volatility.
IB Range set between 24,747 – 24,856, market chopped inside until 2:40 PM.
2:10 PM: False breakdown trap → liquidity grab.
Bulls took charge → breakout above IB, PDC, and PDH.
Day high: 24,904.80 → close: 24,895 (near highs).
📉 Daily Time Frame Chart with Intraday Levels
🕯 Daily Candle Breakdown
Open: 24,759.55
High: 24,904.80
Low: 24,747.55
Close: 24,894.25
Change: +57.95 (+0.23%)
🏗️ Structure Breakdown
Solid green body: ~134.7 pts.
Range: ~157.25 pts (moderate).
Very tiny upper/lower wicks.
📚 Interpretation
Flat-to-weak open, dip to 24,747, then steady climb.
Closing almost at the high = strong conviction.
Minimal rejection → clean bullish candle.
🕯Candle Type
Bullish Marubozu (near-perfect) → Buyers in full control.
Confirms continuation of bullish reversal from Oct 1st.
🛡 5 Min Intraday Chart
⚔️ Gladiator Strategy Update
ATR: 179.73
IB Range: 108.15 → Wide
Market Structure: Balanced
Trade Highlights
11:10 Long Trade – Target Achieved (R:R 1:2.08)
14:10 Short Trade – SL Hit
14:35 Long Trade – Target Achieved (R:R 1:3.96)
📌 What’s Next? / Bias Direction
Bias: Bullish continuation.
If bulls clear 25,000 with momentum, the next leg may unfold toward 25,115–25,250. Supports at 24,785–24,830 need to hold for trend continuity.
📌 Support & Resistance Levels
Resistance Zones:
24890 ~ 24915
24990 ~ 25000
25048
25085
25115
Support Zones:
24830
24785
24745
💡 Final Thoughts
“Markets often test patience with traps before rewarding conviction with momentum. Today’s close above PDH is a classic sign of strength.”
✏️ Disclaimer
This is just my personal viewpoint. Always consult your financial advisor before taking any action.

Nifty Analysis EOD – October 1, 2025 – Wednesday 🟢 Nifty Analysis EOD – October 1, 2025 – Wednesday 🔴
Bulls kick off October with a breakout surge
🗞 Nifty Summary
Nifty opened flat, dipped slightly, and then rallied 85 points from the low. The index repeatedly tried to break the 24,675–24,685 resistance zone, but early attempts failed. With support holding at PDC, an ascending triangle pattern formed, and its breakout finally ignited a 130-point rally to 24,800, meeting the pattern target.
After a retracement to 24,750 support, a trendline breakout around 2 PM added another 80 points, marking the day’s high at 24,867.95. Nifty closed strong at 24,853.40, near the high of the day.
The first trading day of October turned out to be a sentiment shift, with bulls firmly in control. The day’s 262-point range nearly engulfed the last three sessions combined, with a close at the highest high in 3 days.
🛡 5 Min Intraday Chart with Levels
🛡 Intraday Walk
Flat open → dip to 24,606.
85-pt rally attempts 24,675–24,685 resistance, multiple failures.
Support at PDC → ascending triangle breakout, rally to 24,800.
Pullback → support at 24,750.
2:00 PM → trendline breakout, sharp +80-pt rally.
Day high: 24,867.95, close: 24,853.40 (near high).
📉 Daily Time Frame Chart with Intraday Levels
🕯 Daily Candle Breakdown
Open: 24,620.55
High: 24,867.95
Low: 24,605.95
Close: 24,836.30
Change: +225.20 (+0.92%)
🏗️ Structure Breakdown
Large green body (~215.75 pts).
Wide range: 262 pts.
Tiny wicks → minimal rejection.
📚 Interpretation
Buyers stepped in strongly from 24,600 zone.
Trend sustained all day, with close near high.
Momentum shifted firmly to the bulls.
🕯Candle Type
Bullish Marubozu-like candle → strong, decisive buyer dominance.
🛡 5 Min Intraday Chart
⚔️ Gladiator Strategy Update
ATR: 173.37
IB Range: 95.80 → Medium
Market Structure: Balanced
Trade Highlights
11:05 Long Trade – Target Achieved (R:R 1:3.63)
14:00 Long Trade – Trailing SL Hit (R:R 1:3.12)
📌 What’s Next? / Bias Direction
Bias has turned bullish above 24,750. A close above 24,870 could open the gates toward 24,980–25,000, while 24,600 remains the key downside base.
📌 Support & Resistance Levels
Resistance Zones:
24868
24890 ~ 24915
24990 ~ 25000
25048.75
Support Zones:
24775 ~ 24750
24735
24685 ~ 24675
💡 Final Thoughts
“Momentum loves confirmation — when resistance breaks and holds, the market often rewards patience with decisive follow-through.”
✏️ Disclaimer
This is just my personal viewpoint. Always consult your financial advisor before taking any action.

Nifty Analysis EOD – September 29, 2025 – Monday 🟢 Nifty Analysis EOD – September 29, 2025 – Monday 🔴
Bulls wrestle, but bears still dictate the close
🗞 Nifty Summary
Nifty opened with a 39-point gap up, far below the 100+ points Gift Nifty indicated. After adding 32 more points, the index slipped to fill the gap, only to stage a strong recovery towards the 24,750–24,775 resistance zone.
At this zone, a Head & Shoulders pattern formed with a neckline at 24,735. Once broken, Nifty quickly tumbled below the day’s low, meeting the H&S target within minutes. After a brief box pattern breakdown, price dipped below the PDL — but this turned into a false breakdown trap, sparking a 132-point recovery back to the neckline level at 24,735.
Despite multiple bullish attempts, the neckline flipped into strong resistance. Bears regained control, dragging Nifty back below PDL, though another late bounce of 77 points lifted the close to 24,677.55.
Overall, the 185-point wide range offered rich intraday trading opportunities, but the close below PDC keeps the index in a bearish framework with no clear reversal yet.
🛡 5 Min Intraday Chart with Levels
🛡 Intraday Walk
Gap Up +39 pts, minor push to +71 pts, then slipped for gap fill.
Strong rebound to 24,750–24,775 resistance, rejected at neckline (H&S setup).
H&S breakdown → hit target quickly, flushed below day’s low.
False PDL breakdown → 132-pt recovery back to neckline (24,735).
Neckline polarity shift to resistance → multiple failed bull attempts.
Another bear move below PDL, but bulls rescued with 77-pt bounce into close.
📉 Daily Time Frame Chart with Intraday Levels
🕯 Daily Candle Breakdown
Open: 24,728.55
High: 24,791.30
Low: 24,606.20
Close: 24,634.90
Change: −19.80 (−0.08%)
🏗️ Structure Breakdown
Small red body (~93.65 pts).
Range: ~185.10 pts → decent volatility.
Upper wick: ~62.75 pts → sellers rejected upside.
Lower wick: ~28.70 pts → mild buying near lows.
📚 Interpretation
Bulls attempted a rally but met heavy resistance at 24,790.
Bears dragged price down to 24,606.
Close near low → bearish tilt despite recovery attempts.
🕯Candle Type
Small-bodied bearish candle → Spinning Top with bearish bias.
Signals indecision but sellers still defending control.
🛡 5 Min Intraday Chart
⚔️ Gladiator Strategy Update
ATR: 175.10
IB Range: 110.20 → Medium
Market Structure: ImBalanced
Trade Highlights:
11:30 Long Trade – Target Achieved (R:R 1:3.3)
📌 What’s Next? / Bias Direction
Bias remains bearish below 24,800. A sustained breach above this level can revive bullish momentum, else further weakness toward 24,600–24,420 is likely.
📌 Support & Resistance Levels
Resistance Zones:
24735
24750 ~ 24775
24868
24890 ~ 24915
24990 ~ 25000
25048
Support Zones:
24600 ~ 24572
24500
24430 ~ 24400
💡 Final Thoughts
“Markets don’t lie — they trap. False breakouts and breakdowns are the real test of discipline. Those who chase often lose, those who wait often win.”
✏️ Disclaimer
This is just my personal viewpoint. Always consult your financial advisor before taking any action.

Nifty Analysis EOD – September 26, 2025 – Friday🟢 Nifty Analysis EOD – September 26, 2025 – Friday 🔴
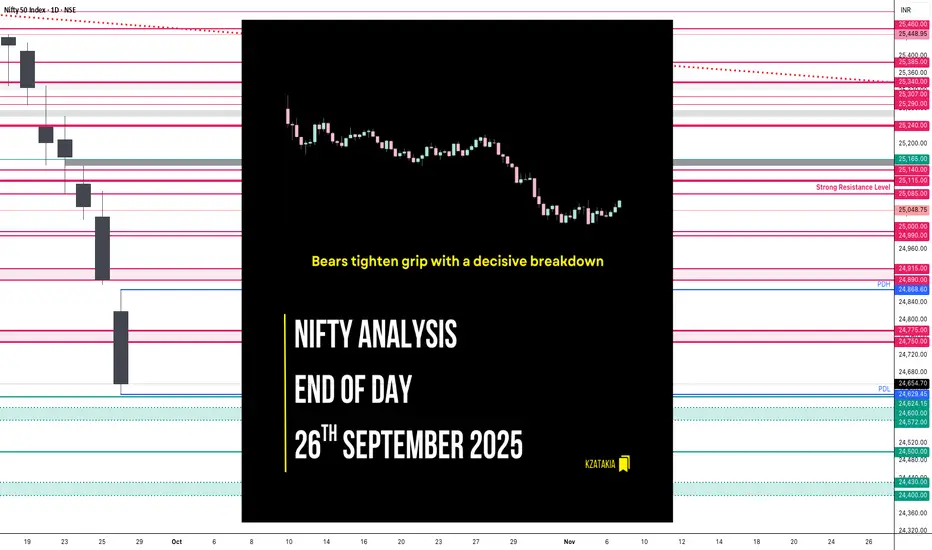
Bears tighten grip with a decisive breakdown
🗞 Nifty Summary
Nifty opened with a Gap Down of 61 points, below the Previous Day Low, and made an initial attempt to recover but stretched only 25 points. From there, a strong selloff dragged it down 109 points from the day high, finding temporary support at the 24,775–24,750 zone.
Multiple attempts to hold this zone failed, and finally around 13:20, the level gave way, triggering a sharp fall of ~125 points to the day’s low at 24,629.50. The index closed weak at 24,673.10, just above the low.
Today’s 239.15-point range was significantly above the Gladiator Avg Range (175.68), highlighting heightened volatility. Importantly, Nifty tested key supports from 5th Sept and 1st Sept closes, while also closing below the 3rd Sept close.
This marks the 7th consecutive red candle session, with none crossing the previous day’s high or close — a clear sign of strong bearish dominance. If Monday breaks 24,430–24,400, the structure shifts from retracement to a new leg of breakdown.
🛡 5 Min Intraday Chart with Levels
🛡 Intraday Walk
Opened Gap Down 61 points below PDL.
Attempted to fill gap, capped at +25 points.
Fell further 109 points from high, tested 24,775–24,750 support zone.
Bears broke this zone at 13:20, sparking a 125-point sharp decline to 24,629.5.
Closed weak at 24,673.10, near the low.
📉 Daily Time Frame Chart with Intraday Levels
🕯 Daily Candle Breakdown
Open: 24,818.55
High: 24,868.60
Low: 24,629.45
Close: 24,654.70
Change: −236.15 (−0.95%)
🏗️ Structure Breakdown
Strong red candle (Close << Open).
Body: ~163.85 points → large bearish body.
Range: ~239.15 points → wide volatility.
Upper wick: ~50 points → firm rejection at 24,860 zone.
Lower wick: ~25 points → minor buying attempt.
Close near lows → clear bear dominance.
📚 Interpretation
Overnight sentiment carried into the gap down.
Bulls tried a mild recovery but failed at 24,868.
Bears controlled the day with a near Marubozu-like structure.
🕯Candle Type
Bearish Marubozu-like candle → decisive bearish continuation with minimal lower shadow.
🛡 5 Min Intraday Chart
⚔️ Gladiator Strategy Update
ATR: 175.68
IB Range: 125.10 → Wide
Market Structure: ImBalanced
Trade Highlights:
09:45 Short Trade – Target Achieved (R:R 1:2.15)
11:50 Long Attempt – SL Hit
13:25 Short Trade – Target Achieved (R:R 1:3.10)
📌 What’s Next? / Bias Direction
Resistance Zones: 24,750–24,775 · 24,868 · 24,890–24,915 · 24,990–25,000 · 25,048
Support Zones: 24,630–24,625 · 24,600–24,572 · 24,500 · 24,430–24,400
Bias stays bearish as long as Nifty trades below 24,860–25,000. A breakdown under 24,430–24,400 can extend the bearish trend toward deeper supports.
📌 Support & Resistance Levels
Resistance Zones:
24750 ~ 24775
24868
24890 ~ 24915
24990 ~ 25000
25048
Support Zones:
24630 ~ 24625
24600 ~ 24572
24500
24430 ~ 24400
💡 Final Thoughts
“Seven red candles in a row — when bears take the fort, the trend is their best ally. Until bulls reclaim higher ground, caution remains the winning trade.”
✏️ Disclaimer
This is just my personal viewpoint. Always consult your financial advisor before taking any action.
Nifty Analysis EOD – September 24, 2025 – Wednesday🟢 Nifty Analysis EOD – September 24, 2025 – Wednesday 🔴
Bears tighten grip as bulls lose ground near key supports
🗞 Nifty Summary
Nifty opened with a Gap Down of 38 points, extended losses by another 98 points, and broke below the previous day’s low, touching the crucial 25,048.75 level. A recovery attempt lifted the index to 25,115, but renewed selling dragged it back near the day’s lows. Despite a false breakdown attempt at IB Low, the afternoon saw recovery till 25,140, where bulls and bears clashed briefly. Eventually, bears regained control and pushed Nifty below 25,048.75, closing at 25,060.90, just off the day’s low.
The session was a roller-coaster ride, giving intraday traders multiple opportunities. Despite bulls’ mid-session efforts, the day ended decisively in the bears’ favor. Bigger picture: in just 9 sessions, the 400-point rally since 12th Sep has been wiped out, putting the index back at the breakout base of 25,115.
If 25,000–24,990 breaks, the next strong support lies at 24,915–24,890. On the upside, bulls must reclaim 25,115 to regain any meaningful grip.
🛡 5 Min Intraday Chart with Levels
🛡 Intraday Walk
Gap Down of 38 points, extended fall of 98 points → tested 25,048.75.
Sharp recovery to 25,115, but sell-off resumed.
False breakdown attempt below IB Low → recovery toward 25,140.
Bulls failed to push higher → bears dragged back below 25,048.75.
Closed weak at 25,060.90, near day’s low.
📉 Daily Time Frame Chart with Intraday Levels
🕯 Daily Candle Breakdown
Open: 25,109.20
High: 25,150.30
Low: 25,027.90
Close: 25,060.90
Change: −93.80 (−0.37%)
🏗️ Structure Breakdown
Red candle (Close < Open).
Body: ~51.85 points → bearish.
Range: ~122.40 points → moderate volatility.
Upper wick: ~41.10 points → rejection near 25,150.
Lower wick: ~29.45 points → buyers defended 25,030 weakly.
Close near lows → bearish dominance.
📚 Interpretation
Sellers took control early and maintained pressure.
Bulls defended 25,030 briefly but couldn’t sustain higher levels.
Strong rejection from 25,150 supply zone.
🕯Candle Type
Bearish continuation candle → confirms seller strength after prior indecision.
🛡 5 Min Intraday Chart
⚔️ Gladiator Strategy Update
ATR: 160.79
IB Range: 100.40 → Medium
Market Structure: ImBalanced
Trade Highlights:
10:30 Short Trade – Target Achieved (R:R 1:2.26)
12:10 Long Trade – Target Achieved (R:R 1:1.58)
13:45 Short Trade – Target Achieved (R:R 1:2.97)
📌 What’s Next? / Bias Direction
Resistance Zones: 25,085 · 25,115 · 25,140–25,165 · 25,240
Support Zones: 25,045–25,030 · 25,000–24,990 · 24,915–24,890
Bias remains bearish unless bulls reclaim 25,115–25,200. Breach of 25,000 may trigger stronger selling pressure toward 24,915.
📌 Support & Resistance Levels
Resistance Zones:
25085
25115
25140 ~ 25165
25240
Support Zones:
25048 ~ 25030
25000 ~ 24990
24915 ~ 24890
💡 Final Thoughts
Today’s session reminds us: “Markets can erase days of gains in hours – that’s why defense matters as much as offense.”
Respect levels, protect capital, and adapt to the changing momentum.
✏️ Disclaimer
This is just my personal viewpoint. Always consult your financial advisor before taking any action.

Nifty Analysis EOD – September 23, 2025 – Tuesday🟢 Nifty Analysis EOD – September 23, 2025 – Tuesday 🔴
Expiry Day Drama – Two-Sided Moves, Tug of War Continues
🗞 Nifty Summary
Nifty opened with a 43-point gap up right at the strong resistance of 25,240, but selling pressure quickly kicked in. Within the first 30 minutes, the index fell 140 points from the high to test the crucial support at 25,115.
From there, a descending triangle pattern formed. Breakdown was triggered at 11:00 AM, but the next support at 25,085 came to the rescue. This 25,085–25,115 zone acted as a base, and once 25,115 was reclaimed, Nifty surged 108 points back to PDC. After a brief pause, the rally extended toward the day’s high, but the CPR Zone, CDO, CDH, and strong 25,240 resistance halted the move. Sellers pushed the index back below mean and PDC, closing at 25,169.50.
👉 Overall, expiry day was a roller coaster —
Great for option buyers with two-sided moves, but also tough to handle both sides that saw traps.
Tough for option sellers as both sides move on expiry day, too hot to handle.
Another spinning top–like candle emerged, reflecting the tug of war. With range expansion already visible, the next session may cool down into a narrower range, provided today’s high or low holds.
🛡 5 Min Intraday Chart with Levels
📉 Daily Time Frame Chart with Intraday Levels
🕯 Daily Candle Breakdown
Open: 25,209.00
High: 25,261.90
Low: 25,084.65
Close: 25,169.50
Change: −32.85 (−0.13%)
🏗️ Structure Breakdown
Small red candle (Close < Open).
Body: ~39.5 points → small body, indecision.
Range: ~177.25 points → wide swings.
Upper wick: ~52.90 points → rejection at 25,260.
Lower wick: ~84.85 points → buyers active at 25,085.
Close near lower-mid of the range.
📚 Interpretation
Opened at resistance → sellers took control early.
Buyers held 25,085–25,115, creating a base.
Rally attempts were capped at 25,240 resistance.
Close shows market still in tug of war, with sellers slightly ahead.
🕯Candle Type
Spinning Top → indecision but weak bias.
📉📈 Short-Term View – September 24, 2025
Resistance Zone: 25,250–25,340 → repeated selling here.
Support Zone: 25,085–25,115 → defended again today.
Break below 25,085 → downside to 25,048 / 25,000 / 24,990.
Bullish continuation only above 25,260–25,340.
👉 3-Day Context (19th → 23rd Sept)
19th Sept: Bearish rejection candle from ~25,420.
22nd Sept: Strong rejection near 25,330, weak close at 25,202.
23rd Sept: Spinning Top at 25,170 → hesitation, indecision, tilt bearish.
👉 The sequence shows distribution pressure building.
📌 Conclusion:
Nifty is losing bullish momentum as sellers hold 25,250–25,450 firmly, while bulls are desperately defending 25,080–25,150. Until one side gives way, expect volatile but range-bound trade. The bias leans toward a short-term correction unless bulls reclaim 25,330+ convincingly.
🛡 5 Min Intraday Chart
⚔️ Gladiator Strategy Update
ATR: 162.87
IB Range: 140.8 → Big
Market Structure: Imbalanced
Trade Highlights:
09:20 → Short Trade ✅ Target Achieved (R:R = 1:2)
11:10 → Short Trade ❌ SL Hit
12:25 → Long Trade ✅ Target Achieved (R:R = 1:3.63)
📌 Support & Resistance Levels
Resistance Zones:
25,240
25,290 ~ 25,307
25,340 ~ 25,385
25,425 ~ 25,460
Support Zones:
25,165 ~ 25,140
25,115
25,085
25,045
25,000 ~ 24,990
💡 Final Thoughts
The market played both sides on expiry day, rewarding nimble traders and punishing late movers. Key battle zone remains 25,085–25,150 vs. 25,250–25,340. Whoever wins this zone will dictate the next directional leg.
📖 “A range is the battlefield — breakout is the victory.”
✏️ Disclaimer
This is just my personal viewpoint. Always consult your financial advisor before taking any action.

Nifty Analysis EOD – September 22, 2025 – Monday🟢 Nifty Analysis EOD – September 22, 2025 – Monday 🔴
Gap-Down, Whipsaw, and Late-Session Breakdown
🗞 Nifty Summary
Nifty opened with a 93-point gap down at 25,240, right at our support level, but slipped another 48 points to test 25,212, marking the day’s low. A sharp 120-point recovery followed, filling the gap within 35 minutes.
For most of the session, price action stayed muted in a 54-point range (25320–25267) near PDL and S1, reflecting indecision. However, the late second half brought a sharp sell-off as 25,240 broke, sending Nifty to test 25,165 before a minor bounce. The index closed at 25,202.35, just above the day’s low.
👉 Overall, the session was rough:
Morning = Bulls dominated with recovery.
Midday = Both sides in a stalemate.
Late = Bears seized control with a decisive breakdown.
🛡 5 Min Intraday Chart with Levels
📉 Daily Time Frame Chart with Intraday Levels
🕯 Daily Candle Breakdown
Open: 25,238.10
High: 25,331.70
Low: 25,151.05
Close: 25,202.35
Change: −124.70 (−0.49%)
🏗️ Structure Breakdown
Red candle (Close < Open).
Body: ~35.75 points (small vs. range).
Range: ~180.65 points (high intraday volatility).
Upper wick: ~93.60 points (rejection near 25,331).
Lower wick: ~51.30 points (buyers tried to defend near 25,150).
Closed near the day’s low → bears ended in control.
📚 Interpretation
Nifty tested 25,331 early but supply kicked in hard.
Selling dragged price to 25,151 before buyers attempted defense.
Recovery attempts failed near 25,200 → sellers controlled late trade.
🕯Candle Type
Resembles an Inverted Hammer / Shooting Star–like red candle, with strong upper rejection.
📉📈 Short-Term View – September 23, 2025
Resistance Zone: 25,320–25,350 (tested, rejected).
Support Zone: 25,150–25,200 (buyers active intraday, but weak close).
Break below 25,150 → could extend fall toward 25,050–25,000.
Upside strength only if 25,330+ is reclaimed.
📌 Conclusion: Recent sessions are showing distribution signs after a strong rally. Bulls are holding 25,150–25,200, but repeated failures near 25,330–25,450 hint at a short-term pullback unless reclaimed.
🛡 5 Min Intraday Chart
⚔️ Gladiator Strategy Update
ATR: 161.28
IB Range: 120.10 → Medium
Market Structure: Imbalanced
Trade Highlights:
11:15 Short Trade → ❌ SL Hit
13:20 Short Trade → ✅ Target Achieved (R:R = 1:2)
📌 Support & Resistance Levels
Resistance Zones:
25,240
25,290 ~ 25,307
25,340 ~ 25,385
25,425 ~ 25,460
Support Zones:
25,165 ~ 25,140
25,115
25,085
25,045
25,000 ~ 24,990
💡 Final Thoughts
The index danced in all directions today but closed with bears firmly ahead. Buyers are still defending 25,150–25,200, but cracks are visible.
👉 Watch 25,150 carefully — losing this could open the gates toward 25,000.
📖 “Markets don’t move in straight lines — they trap, test, and only then trend.”
✏️ Disclaimer
This is just my personal viewpoint. Always consult your financial advisor before taking any action.

Nifty Analysis EOD – September 19, 2025 – Friday🟢 Nifty Analysis EOD – September 19, 2025 – Friday 🔴
Flat Open, Sharp Fall, and a Range-Bound Trap
🗞 Nifty Summary
Gift Nifty hinted at a 50-point gap down, but Nifty opened nearly flat at 25,410. However, the bulls couldn’t hold, and within the first 45 minutes, the index slipped 132 points, breaking S1 and PDL to mark the day’s low at 25,297.
The rest of the day was stuck in a narrow 50-point band, with both sides witnessing fakeouts. The index finally closed exactly at S1 (25,352.5), about 66 points above the low.
The total range for the day stood at 142 points, and closing below previous day low showing weakness after yesterday’s sharp recovery attempt.
Yesterday’s note highlighted:
“The 100-point recovery was unexpected.”
— Today, that very recovery got completely wiped out in the early part of the session.
🗞 Last 3 Sessions breakdown
17th Sep 2025 → Open: 25,276.60 | Close: 25,330.25 | Change: +91.15 (+0.36%) → Bullish, small green candle
18th Sep 2025 → Open: 25,441.05 | Close: 25,423.60 | Change: +93.35 (+0.37%) → Bullish continuation, narrow range
19th Sep 2025 → Open: 25,410.20 | Close: 25,327.05 | Change: −96.55 (−0.38%) → Bearish, closes near 17th close
📌 Pattern Check:
The 3-session structure shows some similarity (~65%) with an Evening Star, but not a textbook one:
1st candle = Bullish
2nd candle = Strong bullish continuation (not a small-bodied star)
3rd candle = Bearish close near/below 17th session’s midpoint
👉 Interpretation:
This looks like a weak Evening Star variation, hinting at possible reversal.
For trading perspective, it’s more of a caution signal than a short trigger — confirmation from the next session’s candle is essential.
🛡 5 Min Intraday Chart with Levels
📉 Daily Time Frame Chart with Intraday Levels
🕯 Daily Candle Breakdown
Open: 25,410.20
High: 25,428.75
Low: 25,286.30
Close: 25,327.05
Change: −96.55 (−0.38%)
🏗️ Structure Breakdown
Red candle (Close < Open).
Body: ~83.15 points (moderate).
Upper wick: ~18.55 points.
Lower wick: ~40.75 points.
Closed closer to the low → Selling pressure throughout the session.
📚 Interpretation
Market opened flat but faced resistance near 25,428 (close to yesterday’s high).
Selling dragged it to 25,286, with only a mild recovery into the close.
Indicates a supply zone around 25,420–25,450.
🕯Candle Type
Bearish candle with a small lower wick.
Not a reversal by itself, but signals loss of momentum after prior strength.
📉📈 Short-Term View – September 22, 2025
Resistance: 25,420–25,450 remains strong.
Support: 25,285–25,300 (today’s low).
Breakdown below 25,240 → Downside may stretch to 25,200–25,140.
Bulls need to reclaim 25,400+ quickly to keep the uptrend alive.
🛡 5 Min Intraday Chart
⚔️ Gladiator Strategy Update
ATR: 159.12
IB Range: 114.45 → Wide
Market Structure: balanced
Trade Highlights:
11:45 Short Trade → SL Hit
📌 Support & Resistance Levels
Resistance Zones:
25,340 ~ 25,385
25,425 ~ 25,460
25,500 (Psychological Level)
25,535
Support Zones:
25,307
25,290
25,275 ~ 25,260
25,240
💡 Final Thoughts
The market delivered a sharp fall early, followed by a dull range-bound trap. The weak Evening Star variation hints that momentum is fading.
👉 Bulls must reclaim 25,400+, else a drift toward 25,200 cannot be ruled out.
📖 “Markets often whisper before they shout — today was one such whisper of caution.”
✏️ Disclaimer
This is just my personal viewpoint. Always consult your financial advisor before taking any action.

Nifty Analysis EOD – September 18, 2025 – Thursday🟢 Nifty Analysis EOD – September 18, 2025 – Thursday 🔴
Gap-Up Test, Triangle Breakdown, and Sharp Recovery
🗞 Nifty Summary
Nifty opened with a 111-point gap-up at 25,441, right near our target zone of 25,460. The first 10 minutes formed an IB range of 55 points, and for the next 3 hours the index consolidated inside this band, shaping a symmetrical triangle pattern. (Refer to the 5 min Chart)
At 12:30 PM, the triangle broke down, and within 30 minutes its pattern target was achieved. In this move, Nifty not only filled the opening gap but also broke below R1 and PDH. At that stage, PDC, CPR, and the previous day’s resistance zone at 25,340 acted as strong support.
From there, a sudden 100-point sharp recovery pulled the index back to the mid-point of the earlier triangle. Nifty closed at 25,420, just 28 points below the day’s high.
📌 Yesterday’s note said:
Bulls face resistance at 25,340, breakout above it could open 25,460+ ✅ (tested in gap-up).
Sideways consolidation may happen ✅ (saw 3+ hours).
Pullback for gap-filling likely ✅ (done by mid-session).
📌 Yesterday’s note end:
👉 What wasn’t expected: the late-session sharp recovery, which shows bulls are still alive but lack strength to break new highs decisively. Tomorrow’s session becomes a litmus test for bulls — they must cross today’s high and close above 25,450 to keep momentum intact.
🛡 5 Min Intraday Chart with Levels
📉 Daily Time Frame Chart with Intraday Levels
🕯 Daily Candle Breakdown
Open: 25,441.05
High: 25,448.95
Low: 25,329.75
Close: 25,423.60
Change: +93.35 (+0.37%)
🏗️ Structure Breakdown
Red candle (Close < Open), yet index closed higher vs yesterday’s close.
Body: ~17.45 points (small).
Upper wick: ~7.90 points.
Lower wick: ~93.85 points (long).
Close is slightly below open but far above the day’s low → strong intraday recovery.
📚 Interpretation
Opened strong, extended slightly to 25,449, then fell to 25,330.
Buyers defended support and absorbed selling pressure, pulling back to 25,420.
Despite closing red, the candle reflects bullish undertone with demand at lower levels.
🕯Candle Type
Hammer-like candle → long lower shadow, small real body near the high. Suggests support defence and dip-buying strength.
📉📈 Short-Term View – September 19, 2025
Support: 25,330 (today’s low).
Resistance: 25,445–25,450 (today’s high).
👉 Sustaining above 25,330 keeps the bullish structure intact.
👉 Breakout above 25,450 could open doors to 25,535–25,550.
🛡 5 Min Intraday Chart
⚔️ Gladiator Strategy Update
ATR: 160.98
IB Range: 55.15 → Medium
Market Structure: ImBalanced
Trade Highlights:
12:30 PM – Short Trigger → Target Achieved (R:R = 1:3.59)
📌 Support & Resistance Levels
Resistance Zones:
25,460
25,500 (Psychological)
25,535
Support Zones:
25,385
25,340
25,307 ~ 25,290
25,275 ~ 25,260 (Previous Day Low & Gap)
💡 Final Thoughts
The day perfectly tested the upper target, retraced for gap fill, and rebounded sharply. Bulls showed resilience but need confirmation. Tomorrow is key: above 25,450 = continuation; below 25,330 = weakness resurfaces.
📖 “Markets often test your conviction by shaking you out before the real move begins.”
✏️ Disclaimer
This is just my personal viewpoint. Always consult your financial advisor before taking any action.

Nifty Analysis EOD – September 16, 2025 – Tuesday🟢 Nifty Analysis EOD – September 16, 2025 – Tuesday 🔴
Powerful Breakout to New Highs – Bulls Taking Control
🗞 Nifty Summary
Nifty began the day with a 15-point gap up, then climbed steadily and strongly upward from the first tick. Every key level respected the price movement, with pauses followed by decisive breakthroughs:
Crossed 25115 (PDH), 25140, and 25160 levels smoothly.
Marked a day high of 25181.85 within just 45 minutes.
After a ~2-hour consolidation in a narrow ~25-point range, Nifty broke the Current Day High (CDH) and marked a new high at 25,203. Though crossing 25200 was tough for a while, 25150 support came to the rescue. From there, a fresh rally pushed the index to our expected target level of 25,240.
As noted earlier, 25240 acted as strong resistance, visible in multiple 5-minute candle shadows. The day ended near the high, signaling strong bullish conviction.
📊 The total range today was 190 points, compared to the 172-point average range of the Gladiator Indicator → indicating expansion after recent contraction.
✅ Today’s close is the highest closing since July 11, 2025, and above the previous swing high (July 23, 2025 close).
👉 For tomorrow:
If Nifty gaps up above the 25240 ~ 25260 resistance zone and sustains, it could aim for 25300 ~ 25340 and 25385.
If it opens within today’s range, expect a possible retest of 25165 ~ 25140, with 25115 as strong support — a possible zone for long reversal trades.
Initial Balance (IB) will be key to plan trades and view tomorrow.
🛡 5 Min Intraday Chart with Levels
📉 Daily Time Frame Chart with Intraday Levels
🕯 Daily Candle Breakdown
Open: 25,073.60
High: 25,261.40
Low: 25,070.45
Close: 25,239.10
Change: +169.90 (+0.68%)
🏗️ Structure Breakdown
Green candle (Close > Open)
Body: ~165.50 points (strong, wide body)
Upper wick: ~22.30 points
Lower wick: ~3.15 points (almost no tail)
Strong close near day high → clear sign of intraday momentum.
📚 Interpretation
Buyers fully controlled the session from the start, defending 25,070.
Broke above 25,140 resistance (last week’s ceiling) with confidence.
Closing near the high shows high conviction buying and likely short-covering.
🕯Candle Type
Bullish Marubozu type → Signals decisive breakout with strong buying pressure.
📉📈 Short-Term View – September 17, 2025
Support: 25,140–25,150 (key floor now)
Resistance: 25,260–25,290 (today’s high zone)
👉 Key Insight:
The multi-day sideways consolidation (24,940–25,140) has ended.
Today’s strong green Marubozu confirms bullish breakout.
Bulls are now clearly in charge, aiming next for 25,340–25,385, provided they sustain above 25,140.
🛡 5 Min Intraday Chart
⚔️ Gladiator Strategy Update
ATR: 172.09
IB Range: 87.4 → Medium
Market Structure: Balanced
Trade Highlights:
9:20 AM – Long Trigger → Target Hit (R:R - 1:2.68)
📌 Support & Resistance Levels
Resistance Zones:
25240
25290 ~ 25307
25340 ~ 25385
Support Zones:
25165 ~ 25140
25115
25085 ~ 25070
💡 Final Thoughts
Today’s textbook inside bar breakout shows that bulls have the upper hand now. The next few sessions will decide if momentum will carry toward 25,300+ or if profit-taking sets in.
📖 “Momentum favors the brave. Keep an eye on the key levels and trade with discipline.”
✏️ Disclaimer
This is just my personal viewpoint. Always consult your financial advisor before taking any action.

Nifty Analysis EOD – September 12, 2025 – Friday 🟢 Nifty Analysis EOD – September 12, 2025 – Friday 🔴
Momentum Building – Eyes Set on 25,240 Next
🗞 Nifty Summary
Nifty began the session with a strong 80-point gap-up, right at our first target level. A sudden retracement of 50 points found support at the previous two days' high (25,038), which became the day’s low.
From there, the index climbed gradually yet confidently toward the resistance zone of 25,085 ~ 25,095, where it paused briefly. After the breakout, a sharp move pushed the index to our second target of 25,140, marking the day’s high at 25,139.45 — just 16 points shy of the Inside Bar Pattern target.
Following this intraday expansion, the index cooled off and retraced toward the 25,085 ~ 25,095 zone, settling into a small consolidation range between 25,100 ~ 25,125. The day ended at 25,104.55 on a very positive note.
Overall, today’s session fulfilled our expectations.
👉 Tomorrow, a sustained breakout above 25,140 ~ 25,160 may open the door toward the powerful supply and resistance zone of 25,240.
🛡 5 Min Intraday Chart with Levels
📉 Daily Time Frame Chart with Intraday Levels
🕯 Daily Candle Breakdown
Open: 25,074.45
High: 25,139.45
Low: 25,038.05
Close: 25,114.00
Change: +108.50 (+0.43%)
🏗️ Structure Breakdown
Green candle (Close > Open).
Body: ~39.55 points → moderate.
Upper wick: ~25.45 points.
Lower wick: ~36.40 points.
Balanced intraday action with attempts from both bulls and bears, but closed firmly higher.
📚 Interpretation
Buyers defended 25,038–25,040 support zone consistently.
Price moved above 25,100, though sellers capped near 25,140.
The candle reflects controlled bullishness with gradual accumulation, not a runaway rally.
🕯Candle Type
Balanced bullish candle / small-bodied bullish bar → shows steady buying interest.
📉📈 Short-Term View – September 12, 2025
Support: 25,040 (defended strongly for the 4th session).
Resistance: 25,140 (fresh rejection zone).
👉 Key Insight:
The market is forming a tight upward channel with bulls gradually pushing, but sellers remain active near resistance.
Sustaining above 25,140 will be crucial to target 25,240.
📊 Context over last 3 sessions (September 4–8):
Market is holding 24,940–25,040 as a strong floor.
Each session shows a higher close → steady buying pressure accumulating.
🛡 5 Min Intraday Chart
⚔️ Gladiator Strategy Update
ATR: 178.76
IB Range: 51.7 → Medium
Market Structure: ImBalanced
Trade Highlights:
10:00 AM – Long Trigger → Target Hit (R:R - 1:2.5)
📌 Support & Resistance Levels
Resistance Zones:
25,140 ~ 25,160
25,240
Support Zones:
25,085
25,035
25,000 ~ 24,975
24,940
💡 Final Thoughts
Today’s action reflects a healthy consolidation phase with bullish undertones. Bulls are preparing for a potential breakout, while sellers defend the upper band. The next session’s ability to sustain above 25,140–25,160 will be a clear momentum trigger.
📖 “Patience in accumulation today builds strength for tomorrow’s breakout.”
✏️ Disclaimer
This is just my personal viewpoint. Always consult your financial advisor before taking any action.

Nifty Analysis EOD – September 10, 2025 – Wednesday🟢 Nifty Analysis EOD – September 10, 2025 – Wednesday 🔴
📌 Doji at Resistance – Market in Consolidation Grip
🗞 Nifty Summary
Nifty opened with a 114-point gap-up, well above the previous day’s high and right in the middle of the strong resistance zone of 24,975 ~ 25,004. Initially, the index attempted to stabilize and hold above 25,000, but couldn’t sustain the level. It gradually lost ground, broke the VWAP and day’s low, marking a low of 24,915.
A recovery of 75 points from the low brought Nifty back to 24,977.5 at close, resulting in a Doji candle formed near the middle of the resistance zone.
Such large gap-ups or gap-downs are not favorable for intraday players, and positional BTST option buyers were left vulnerable, as the first-minute slip wiped out initial gains.
🛡 5 Min Intraday Chart with Levels
📉 Daily Time Frame Chart with Intraday Levels
🕯 Daily Candle Breakdown
Open: 24,991.00
High: 25,035.70
Low: 24,915.05
Close: 24,973.10
Change: +104.50 (+0.42%)
🏗️ Structure Breakdown
Red candle (Close < Open).
Body: 17.90 points → small.
Upper wick: 44.70 points.
Lower wick: 58.05 points.
This forms a Spinning Top-type candle with long shadows on both sides → indicative of intraday tug-of-war.
📚 Interpretation
Market opened near 25,000, briefly touched 25,035, but sellers rejected higher levels.
Buyers defended 24,915, as seen from the long lower wick.
Closing slightly below open signals mild bearish pressure despite overall gains compared to the previous close.
This is a classic indecision candle, with bulls managing to hold ground but failing to assert dominance.
🕯Candle Type
Spinning Top / Indecision Candle with balanced pressure leaning slightly bearish (due to red close).
📉📈 Short-Term View – September 11, 2025
Support: 24,910 – 24,915 (defended today).
Resistance: 25,030 – 25,050 (strong supply zone with multiple rejections).
👉 Key Insight:
Bulls are trying to protect 24,900 but facing strong resistance near 25,030–25,050.
Market is consolidating and coiling tighter between 24,900–25,050.
A breakout above 25,050 may trigger fresh momentum towards 25,160, while a dip below 24,900 opens risk toward 24,750.
🛡 5 Min Intraday Chart
⚔️ Gladiator Strategy Update
ATR: 193.36
IB Range: 59.3 → Small
Market Structure: Balanced
Trade Highlights:
10:30 AM – Long Trigger → SL Hit
13:20 PM – Short Trigger → SL Hit
📌 Support & Resistance Levels
Resistance Zones:
24,975 ~ 25,004
25,035 ~ 25,140
25,160
Support Zones:
24,915 ~ 24,895
24,845 ~ 24,835
24,785
💡 Final Thoughts
Today’s indecisive spinning top reflects a market stuck in consolidation, caught between supply and demand. Until a decisive breakout occurs, avoid large positional bets and remain focused on intraday tactical trades.
📖 “Patience in consolidation builds the strongest trends later.”
✏️ Disclaimer
This is just my personal viewpoint. Always consult your financial advisor before taking any action.

Nifty Analysis EOD – September 5, 2025 – Friday🟢 Nifty Analysis EOD – September 5, 2025 – Friday 🔴
Double Bottom at the Lows—Hope for Bulls or Just Another Trap?
🗞 Nifty Summary
Nifty opened with a 98-point gap-up at 24,825 but showed hesitation, spending the first 45 minutes stuck in the CPR zone within a narrow 60-point band. By 10 AM, the index slipped sharply—breaking both IB Low and BC level, and within minutes also pierced PDL, tumbling nearly 143 points. Support emerged at S1 (24,635), where the fall finally halted.
The index then spent over two hours base-building between PDL and S1, forming a double bottom (Adam–Eve) pattern. Once this base broke out above PDL, the index rallied quickly, meeting its upside target.
Structurally, the session shaped into a triple distribution day:
Early selling phase,
Midday consolidation,
Late recovery rally.
Intraday option traders found strong opportunities with fast 2x expansion off a small IB, but swing traders likely struggled with whipsaws.
Closing nearly flat at 24,741 (+6.7 pts) keeps the directional dilemma alive. Yesterday’s rejection repeated today—but the 125-point recovery off lows and close above PDL gives bulls a glimmer of hope.
🛡 5 Min Intraday Chart with Levels
📉 Daily Time Frame Chart with Intraday Levels
🕯 Daily Candle Breakdown
Open: 24,818.85
High: 24,832.35
Low: 24,621.60
Close: 24,741.00
Change: +6.70 (+0.03%)
🏗️ Structure Breakdown
Red candle (Close < Open), but still slightly positive vs. previous day.
Body: 77.85 pts → small bearish body.
Upper wick: 13.50 pts → negligible.
Lower wick: 119.40 pts → long tail.
🕯Candle Type
Hammer / Pin Bar → indicates potential reversal with bullish undertone.
📚 Interpretation
Market slipped nearly 200 pts intraday but bounced back strongly.
Long downside tail reflects demand defense at 24,620–24,635 zone.
Despite red body, price action leans neutral-to-bullish.
🔍 Short-Term View – September 8, 2025
Support: 24,620 (defended low).
Resistance: 24,830–24,980 (recent rejection zone).
👉 Bias Direction:
> If 24,620 breaks, weakness could extend to 24,450.
> If 24,830 sustains, bulls may regain the upper hand.
🛡 5 Min Intraday Chart
⚔️ Gladiator Strategy Update
ATR: 211.61
IB Range: 59.7 → Small
Market Structure: Balanced
Trade Highlights:
1) 10:00 AM – Short Trigger → Target Hit (R:R = 1:3.64)
📌 Support & Resistance Levels
Resistance Zones:
24,785
24,835 ~ 24,845
24,895 ~ 24,910
24,975 ~ 25,004
Support Zones:
24,685
24,657
24,630 ~ 24,620
24,540 ~ 24,525
💡 Final Thoughts
Today’s Hammer at the lows signals that buyers are quietly absorbing supply. But conviction remains missing—two back-to-back sessions show indecision at higher levels. Until either 24,620 breaks or 24,830 is sustained, expect choppy action favoring intraday trades over positional setups.
📖 “Reversals don’t start with noise—they begin with defense at key levels.”
✏️ Disclaimer
This is just my personal viewpoint. Always consult your financial advisor before taking any action.

Nifty Analysis EOD – September 4, 2025 – Thursday🟢 Nifty Analysis EOD – September 4, 2025 – Thursday 🔴
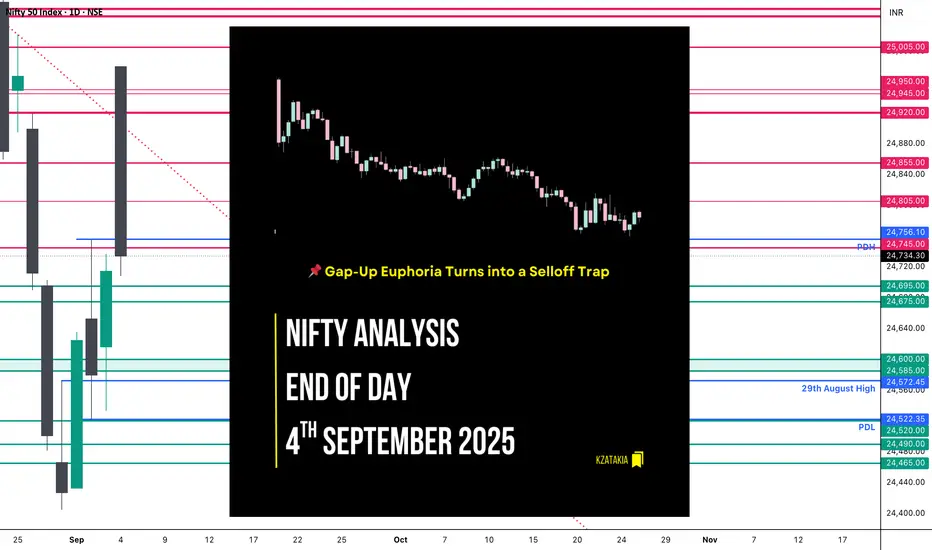
📌 Gap-Up Euphoria Turns into a Selloff Trap
🗞 Nifty Summary
A news-driven opening saw Nifty gap up by 254 points at 24,970, immediately triggering all upside targets from the prior day’s Inside Bar pattern. But the euphoria didn’t last long—profit booking hit in the very first 5 minutes. By 10 AM, once the IB Low broke, selling intensified and the index never even tested VWAP for the rest of the session.
Despite intraday swings of over 230 points from high to close, the index managed to end almost flat at 24,739.80 (+26 pts)—back to square one. Yesterday was about a bottom reversal; today screamed rejection at higher levels. The mixed signals leave direction uncertain.
🛡 5 Min Intraday Chart with Levels
📉 Daily Time Frame Chart with Intraday Levels
🕯️ Daily Candle Breakdown
Open: 24,980.75
High: 24,980.75
Low: 24,708.20
Close: 24,734.30
Change: +19.25 (+0.08%)
🏗️ Structure Breakdown
Red candle (Close < Open) despite being marginally positive vs. yesterday.
Body: 246.45 points → large bearish body.
Upper wick: 0 (open = high).
Lower wick: 26.10 points → very small.
🕯Candle Type
Bearish Marubozu (Gap-Up Failure) → supply rejection at upper zone.
📚 Interpretation
Sharp gap-up faded instantly—a textbook bull trap.
Relentless intraday selling pressure; buyers weakly defended lows.
Closing just above key support keeps the tug-of-war alive, but momentum favors sellers.
🔍 Short-Term View – September 5, 2025
Resistance: 24,980–25,000 (failed breakout zone).
Support: 24,700 (tested today, critical).
👉 In short: Today marks exhaustion at the top. Unless Nifty reclaims 24,980–25,000, the risk of sliding back toward 24,600–24,520 remains high.
🛡 5 Min Intraday Chart
⚔️ Gladiator Strategy Update
ATR: 211.71
IB Range: 123.05 → Medium
Market Structure: Imbalanced
Trade Highlights: No trade triggered today.
📌 Support & Resistance Levels
Resistance Zones:
24,740 ~ 24,760
24,805
24,855
24,900 ~ 24,920
Support Zones:
24,695 ~ 24,675
24,600 ~ 24,585
24,520
24,490 ~ 24,465
💡 Final Thoughts
The market teased the bulls with a powerful gap-up, only to hand the reins to sellers. This kind of gap-up failure is often a strong reversal signal. For now, traders should respect the 24,700 support zone—break it, and the downside may accelerate.
📖 “Markets don’t reward euphoria; they test conviction.”
✏️ Disclaimer
This is just my personal viewpoint. Always consult your financial advisor before taking any action.
Nifty Analysis EOD – September 2, 2025 – Tuesday🟢 Nifty Analysis EOD – September 2, 2025 – Tuesday 🔴
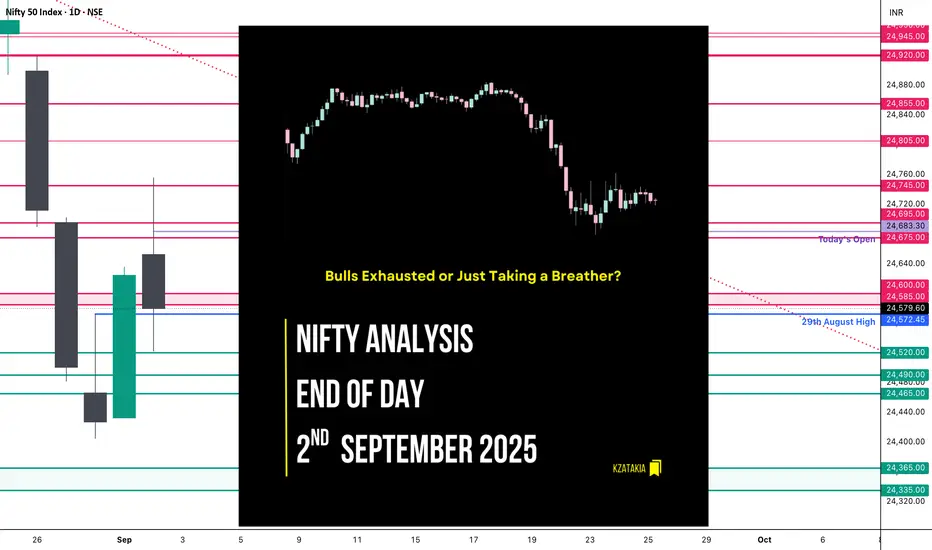
Bulls Exhausted or Just Taking a Breather?
🗞 Nifty Summary
Nifty opened with a 62-point gap-up above the previous day’s high, but the excitement didn’t last long. The index quickly rushed to fill the gap, pulled back, and initially tried to extend the bullish sentiment from yesterday. However, the 24,750 hurdle proved too strong.
After multiple failed attempts to break above it, Nifty slipped below key supports — mean, CDL, PDH, PDC, and the 24,600–24,585 support zone — finally taking a pause around 24,520.
The big question: Was this just a weekly expiry adjustment or early signs of bullish momentum exhaustion?
For the upcoming sessions, the critical range is 24,750 ~ 24,500.
🛡 5 Min Intraday Chart with Levels
📉 Daily Time Frame Chart with Intraday Levels
🕯️ Daily Candle Breakdown
Open: 24,653.00
High: 24,756.10
Low: 24,522.35
Close: 24,579.60
Change: −45.45 (−0.18%)
🏗️ Structure Breakdown
Red candle (Close < Open).
Body: 73.40 points → moderate.
Upper wick: 103.10 points (strong rejection near high).
Lower wick: 57.25 points (buyers attempted defense).
This created a long upper wick → intraday bullish attempt got rejected.
🕯Candle Type
Shooting Star–like red candle → reflects bullish exhaustion and supply pressure.
📚 Interpretation
Gap-up open above previous close (24,625 → 24,653).
Bulls attempted to break 24,750, but failed multiple times.
Sellers dominated late, dragging the index red.
Strong rejection shows supply pressure near 24,750.
📉 Short-Term View
Resistance: 24,750 (rejection zone).
Support: 24,520 (today’s low).
Context: Yesterday’s bullish Marubozu was negated by today’s failure.
👉 If bulls reclaim 24,750+, momentum revives.
👉 If 24,520 breaks, sellers may gain the upper hand.
In short: Market is in a tug-of-war zone between 24,750 and 24,520.
🛡 5 Min Intraday Chart
⚔️ Gladiator Strategy Update
ATR: 205.07
IB Range: 98.85 → Medium
Market Structure: Balanced
Trade Highlight:
13:50 Short Trigger → Target Hit (R:R = 1:1.5)
📌 Support & Resistance Levels
Resistance Zones:
24,675 ~ 24,695
24,745
24,805
24,855
Support Zones:
24,575
24,520
24,490 ~ 24,465
💭 Final Thoughts
The index showed signs of exhaustion near 24,750. Whether this is just expiry-related or a genuine pause in momentum, tomorrow’s action will confirm.
"Markets don’t lie, they whisper. Today’s rejection was one such whisper — respect it."
✏️ Disclaimer
This is just my personal viewpoint. Always consult your financial advisor before taking any action.
Nifty Analysis EOD - September 1, 2025 - Monday🟢 Nifty Analysis EOD - September 1, 2025 - Monday 🔴
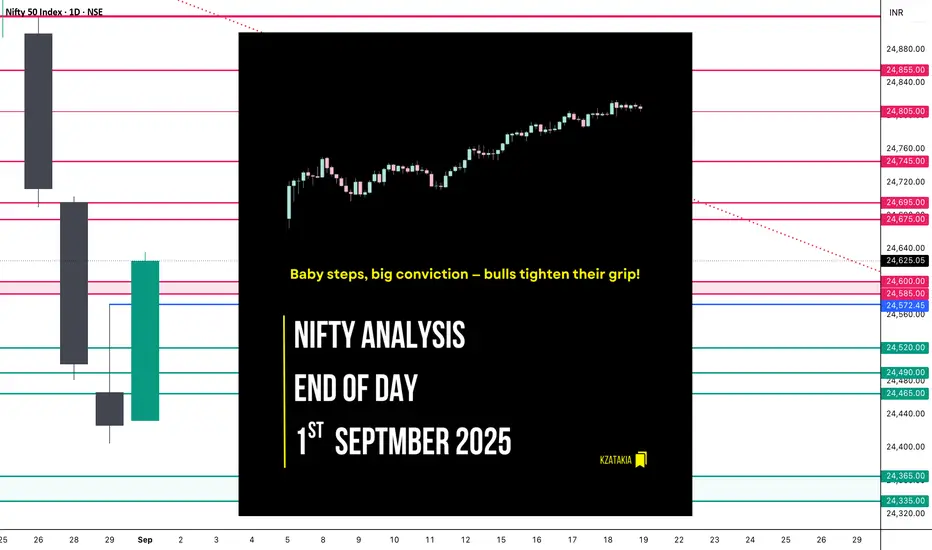
Baby steps, big conviction — bulls tighten their grip!
🗞 Nifty Summary
Nifty opened with a 47-point gap-up, carrying a positive vibe. The index extended gains by nearly 80 points, marking a high of 24,560.85 before slipping back to 24,500. There it found strong support and gradually climbed to break IB High and later breach PDH.
Step by step, bulls showcased steady dominance, ultimately closing at 24,624.15, a solid 190-point gain. The daily timeframe formed a Bullish Marubozu candle, breaking out and closing above the Previous Day High — a decisive statement from buyers.
🛡 5 Min Intraday Chart with Levels
🚶 Intraday Walk
Opened gap-up +47 points.
Climbed ~80 points, touched 24,560.85.
Pulled back to 24,500, took support.
Gradually rose, broke IB High, then PDH.
Closed at 24,624.15, strong bullish grip intact.
📉 Daily Time Frame Chart with Intraday Levels
🕯️ Daily Candle Breakdown
Open: 24,432.70
High: 24,635.60
Low: 24,432.70
Close: 24,625.05
Change: +198.20 (+0.81%)
🏗️ Structure Breakdown
Green candle (Close > Open).
Body: 192.35 points → strong, dominant.
Upper wick: ~10.55 points (negligible).
Lower wick: 0 (open = low).
🕯Candle Type
Bullish Marubozu (near perfect).
📚 Interpretation
Market opened at low, never looked back.
Strong buying all day, closing at peak.
After 3 days of selling (23–25 Aug), this candle marks first solid bullish comeback.
Short-Term View
Support: 24,430 (today’s low & open).
Resistance: 24,635 (today’s high) → breakout may target ~24,800.
Trend Context: After a bearish continuation, today signals a bullish reversal. Needs follow-through buying in the next 1–2 sessions.
🛡 5 Min Intraday Chart
⚔️ Gladiator Strategy Update
ATR: 201.88
IB Range: 93.05 → Medium
Market Structure: Balanced
Trade Highlights
12:25 → Long trade triggered - Trailing SL hit ( R:R = 1 : 1.16 )
📌 Support & Resistance Levels
Resistance Zones
24,675 ~ 24,695
24,745
24,805
24,855
Support Zones
24,575
24,520
24,490 ~ 24,465
🔮 What’s Next? / Bias Direction
Momentum has shifted in favour of bulls, with today’s Marubozu breakout signalling strong conviction. As long as Nifty sustains above 24,500–24,520 zone, buyers remain in control. A clean break above 24,635 opens the gates for 24,800 and beyond.
💭 Final Thoughts
Today’s action reminded us: “Trends don’t announce themselves, they whisper first — and today’s candle was a loud hint.”
✏️ Disclaimer
This is just my personal viewpoint. Always consult your financial advisor before taking any action.
Nifty Analysis EOD – August 29, 2025 – Friday🟢 Nifty Analysis EOD – August 29, 2025 – Friday 🔴
Failed bounce, sellers strike back at higher levels
🗞 Nifty Summary
Nifty opened with a GapDown of 66 points but immediately started moving up with an OL formation (Open = Low at 24,466.60) — a sign of bullish intent.
The first 5-min range of 98 points set the IB (Initial Balance), marking Day Low = Open and Day High = 24,564.35.
Throughout the session, the index attempted multiple IB breakouts but they all turned into false moves until 2:30 PM, when Nifty finally broke down IB Low and tested 24,400 zone before closing weak at 24,426.85 (−74.05 / −0.30%).
This structure suggests bears are still in control, though signs of base-building are emerging.
🛡 5 Min Intraday Chart with Levels
📝 Intraday Walk
GapDown start, but immediate OL formation = bullish sentiment
Quick gap-filling attempt, but resistance capped upside near 24,564
Multiple failed IB breakouts (both sides) = choppy action
Post 2:30 PM → decisive IB Low breakdown toward 24,400
Weak close at 24,426, below the midpoint of the day
📉 Daily Time Frame Chart with Intraday Levels
🕯 Daily Candle Breakdown
Open: 24,466.70
High: 24,572.45
Low: 24,404.70
Close: 24,426.85
Change: −74.05 (−0.30%)
🏗️ Structure Breakdown
Upper Wick (~105 pts): strong selling rejection at higher levels
Lower Wick (~22 pts): weak buyer defense near lows
Body (39.85 pts): indecisive but bearish bias
🕯Candle Type
Rejection-style red candle with small body and long upper wick.
📚 Interpretation
Early rebound attempt failed.
Close well below midpoint = sellers retain control.
Candle resembles a Shooting Star (bearish context) → signals supply pressure at higher levels.
🛡 5 Min Intraday Chart
⚔️ Gladiator Strategy Update
ATR: 201.12
IB Range: 97.75 → Medium
Market Structure: Balanced
Trade Highlights: No trade signal triggered
📌 Support & Resistance Levels
Resistance Zones:
24,585 ~ 24,600
24,675 ~ 24,695
24,745
Support Zones:
24,665 ~ 24,650
24,365 ~ 24,335
🔮 What’s Next? / Bias Direction
If 24,400 holds, short-term base formation could play out.
If 24,400 breaks, expect further downside toward 24,250.
Bias → Bearish continuation unless 24,600 is decisively reclaimed.
💭 Final Thoughts
“Markets don’t reverse in a single day – they build a base. Respect the levels, not the noise.”
✏️ Disclaimer
This is just my personal viewpoint. Always consult your financial advisor before taking any action.

Nifty Analysis EOD – August 28, 2025 – Thursday🟢 Nifty Analysis EOD – August 28, 2025 – Thursday 🔴
Bulls Tried, But Bears Closed the Table
🗞 Nifty Summary 🗞
Nifty started almost flat but below the prior low, and selling pressure hit from the first tick — falling 195 points in just 10 minutes to mark the day low at 24,507. Support came in, leading to a 170-point recovery, almost touching the day high near 24,675–24,695, but the support zone flipped into resistance. A sharp rejection dragged the index back to the lows, even breaching them to mark a new day low at 24,481.60.
By the close, a mild 50-point recovery couldn’t change the tone, with Nifty finishing at 24,533.10, down −211.15 points (−0.85%).
Over the last 5 sessions, Nifty has lost 672 points, slipping below the Fib 0.786 retracement of the recent swing high-low range.
🛡 5 Min Intraday Chart with Levels
📊 Intraday Walk
Gap-down, immediate 195-point fall to 24,507.
Bulls attempt recovery, index climbs 170 points.
Faces rejection at 24,675–24,695, prior support turned resistance.
Sellers regain control, Nifty revisits lows.
Breach of earlier low, new low at 24,481.60.
Small 50-point bounce, closes weak at 24,533.10.
📉 Daily Time Frame Chart with Intraday Levels
🕯 Daily Candle Breakdown
Open: 24,695.80
High: 24,702.65
Low: 24,481.60
Close: 24,500.90
Change: −211.15 (−0.85%)
🏗️ Structure Breakdown
Candle: Red (Close < Open)
Body: 194.90 points (large bearish body)
Upper wick: ~7 points → no strength above open
Lower wick: ~19 points → weak recovery attempt
📚 Interpretation
Gap-down open, below PDL.
Buyers failed to sustain upside; day’s high just 7 points above open.
Persistent selling throughout, only a minor bounce at close.
Another strong bearish candle, very similar to yesterday’s.
🕯Candle Type
Bearish Marubozu–style (big red body, tiny wicks).
Signifies trend-confirming, decisive selling pressure.
🔎 Short-Term View
Support: 24,480–24,450 (tested today). Break → 24,365–24,335.
Resistance: 24,695–24,720 (gap-down + rejection zone).
📌 The market is clearly moving in phases:
21st → Pause and alert
22nd → trend reversal confirmation
25th → pullback rejection
26th → confirmation
28th → bearish extension
Bulls must defend 24,350 to prevent a deeper correction.
🛡 5 Min Intraday Chart
⚔️ Gladiator Strategy Update
ATR: 204.83
IB Range: 195.45 → Medium
Market Structure: ImBalanced
Trade Highlights
9:45 AM – Long Trigger → Target achieved (R:R 1:1.5)
12:55 PM – Short Trigger → Target achieved (R:R 1:1.5)
📌 Support & Resistance Levels
Resistance Zones:
24,585 ~ 24,600
24,675 ~ 24,695
24,745
Support Zones:
24,665 ~ 24,650
24,365 ~ 24,335
🏹 Final Thoughts
“Markets don’t lie. When a support flips to resistance, the message is loud and clear — respect the structure.”
✏️ Disclaimer ✏️
This is just my personal viewpoint. Always consult your financial advisor before taking any action.

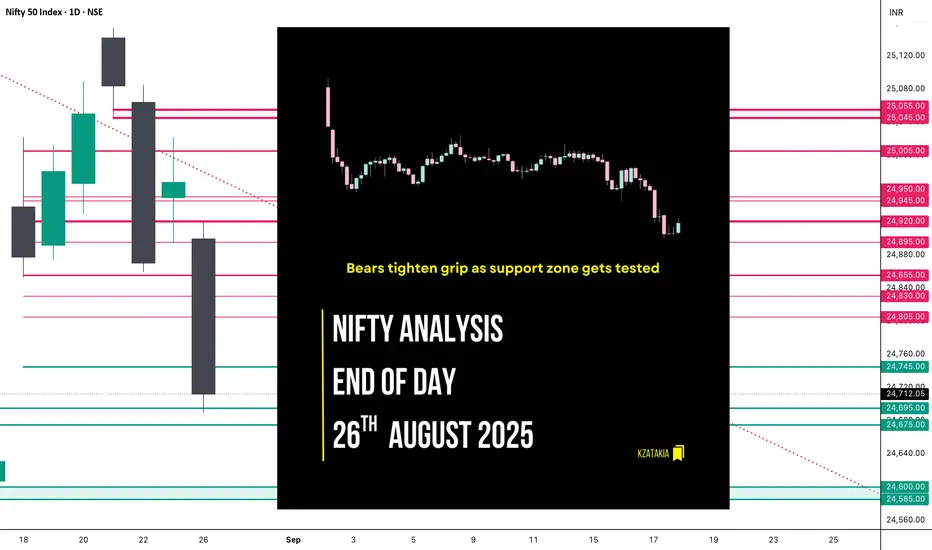
Nifty Analysis EOD – August 26, 2025 – Tuesday🟢 Nifty Analysis EOD – August 26, 2025 – Tuesday 🔴
Bears tighten grip as support zone gets tested
📰 Nifty Summary
Nifty opened with a 72-point gap-down and extended the fall by more than 150 points, finding support at 24,755.
Despite a few recovery attempts, the index mostly hovered around VWAP. Around 3 PM, Nifty broke the day’s low to hit 24,689.60 before a minor 21-point bounce, finally closing at 24,710.70.
Monday’s upmove proved to be just a dead-cat bounce of Friday’s fall. After forming an Inside Bar on the daily chart, today’s breakdown extended the weakness. Now, holding the 24,585–24,600 zone will be crucial for any base-building attempts.
🛡 5 Min Intraday Chart with Levels
📊 Intraday Walk
Opened with a 72-point gap-down.
Sharp selling → tested 24,755 support.
Multiple recovery attempts, stuck around VWAP.
3 PM breakdown → new day low at 24,689.60.
Closed weak at 24,710.70, right at support.
📉 Daily Time Frame Chart with Intraday Levels
🕯 Daily Candle Breakdown
Open: 24,899.50
High: 24,919.65
Low: 24,689.60
Close: 24,712.05
Change: −255.70 (−1.02%)
🏗️ Structure Breakdown
Strong red candle (Close < Open).
Body: 187.45 points → decisive selling.
Upper wick: 20 points → no buying strength.
Lower wick: 22 points → negligible bounce.
📚 Interpretation
Market opened lower, weak recovery above 24,919.
Continuous selling dragged it near the day’s low.
Confirms bearish follow-through after rejection at 25,000 on Aug 22.
Candle type:
Bearish Marubozu-like, signaling bear dominance.
🛡 5 Min Intraday Chart
⚔️ Gladiator Strategy Update
ATR: 201.98
IB Range: 164.05 → Medium
Market Structure: ImBalanced
Trade Highlights: No trade triggered by the system
today.
📌 Support & Resistance Levels
Resistance Zones:
24,805 ~ 24,830
24,855
24,895
24,920
24,945 ~ 24,950
Support Zones:
24,695 ~ 24,675
24,600 ~ 24,585
🔮 What’s Next?
Short-term resistance now sits at 24,920, acting as a ceiling.
Support lies at 24,695–24,675, already tested today.
If broken, the next key zone is 24,585–24,600, crucial for base-building.
Trend clearly shifted from buying fatigue → decisive selling.
💭 Final Thoughts
“Markets don’t reverse on hope, they reverse on structure.”
With today’s close hugging the support zone, the next few sessions will decide if Nifty can stabilize—or if bears extend their grip further.
✏️ Disclaimer
This is just my personal viewpoint. Always consult your financial advisor before taking any action.
Nifty Analysis EOD – August 22, 2025 – Friday🟢 Nifty Analysis EOD – August 22, 2025 – Friday 🔴
Bears finally break the wall — wiping out 4 sessions’ gains
🗞 Nifty Summary
Yesterday, we noted:
“Though the close is higher by +33 points vs the previous day, it left behind a red daily candle (close < open). This indicates fading bullish momentum, even though HH-HL structure is still intact. The range was narrow (≈98 points), categorising the day as range-bound, not sideways. The previous weekly expiry was also narrow yet sideways.”
That caution proved valid today. Right from the opening candle, Nifty broke the PDL + S1 zone, invalidating the HH-HL structure and giving bears a clean entry. The past two sessions’ range contraction added fuel to the breakdown, resulting in a 225-point fall.
The attempted defense at 24,995, 24,955, 24,920, and 24,890 provided only temporary halts, but the downside momentum was too strong. The day ended at 24,869.45, erasing gains of the last 4 sessions.
On the weekly chart, the index now resembles a bearish pin bar / inverted hammer, a sign of exhaustion at the top.
📌 For Monday:
If Nifty fails to hold 24,850–24,820, then 24,745 and 24,650 come into play.
Bulls must reclaim and close above 24,955 to hold their fort.
🛡 5 Min Intraday Chart with Levels
📌 Intraday Walk
Opened at 25,064.15 with mild optimism.
First 1-min candle → broke PDL + S1 decisively → bears in control.
Gradual fall → temporary fights at 24,995 → 24,955 → 24,920 → 24,890, but all failed.
Closing print at 24,870.10, almost at the day’s low.
📉 Daily Time Frame Chart with Intraday Levels
🕯 Daily Candle Breakdown
Open: 25,064.15
High: 25,084.85
Low: 24,859.15
Close: 24,870.10
Change: −213.65 (−0.85%)
🏗️ Structure Breakdown
Strong red candle (Close < Open)
Body: 194.05 points
Upper wick: 20.70 points
Lower wick: 10.95 points
Full-body bearish bar → strong downside momentum
📚 Interpretation
Sellers seized control after three days of stalling at 25,150–25,180.
Break below 25,000 confirms supply dominance.
Closing near day’s low = no recovery attempt → decisive distribution.
🕯️Candle Type
Bearish Marubozu-style → clear trend shift to sellers.
🛡 5 Min Intraday Chart
⚔️ Gladiator Strategy Update
ATR: 198.19
IB Range: 134.25 → Medium
Market Structure: ImBalanced
Trade Highlight:
9:20 → Short Trigger → Target Achieved (R:R = 1:2).
🕵️Range & Bias
Support zone: 24,850–24,820
Resistance zone: 25,000–25,080
Bias: Bearish momentum → “Sell on rise” until 25k is reclaimed.
📌 Support & Resistance Levels
🎚️ Resistance Zones
24,920
24,955
24,995 ~ 25,005
25,080 ~ 25,090
🎚️ Support Zones
24,850 ~ 24,820
24,770
24,745
24,695 ~ 24,675
💡 Final Thoughts
The market has shifted gears from cautious bullish to outright bearish, with 25,000 now acting as a supply zone. Unless bulls reclaim lost ground above 24,955–25,000, the slide toward 24,745–24,650 seems inevitable.
“Markets climb the stairs but take the elevator down — today, the elevator arrived.”
✏️ Disclaimer
This is my personal analysis — not investment advice. Please consult your financial advisor before trading.
