Nifty Analysis EOD – December 11, 2025 – Thursday🟢 Nifty Analysis EOD – December 11, 2025 – Thursday 🔴
Bulls Recapture Lost Ground: Strong Recovery Confirms Demand at 25700 Base.
🗞 Nifty Summary
Despite early indications from Gift Nifty suggesting a large Gap Up, the Nifty only opened up 27 points. It immediately filled the gap, testing the 25800 level, and sharply faced rejection, falling below 25700 to mark a low at 25,693.25.
This aggressive dip served to trap bears before a powerful V-shaped recovery began. Buyers stepped in decisively at the 25715 ~ 25740 support, breaching the Day High and testing 25840, and gradually reaching 25900.
Multiple attempts to conquer the strong overhead resistance zone of 25920 ~ 25930 failed, but the Nifty successfully closed near the day’s high at 25,898.55. This strong bullish close recaptures the ground lost yesterday and shows a decisive change in short-term sentiment.
🛡 5 Min Intraday Chart with Levels
🛡 Intraday Walk
The day started with a crucial test: the early breakdown below the PDL was swiftly negated by strong buyer defense at the 25700 level.
This V-shaped recovery confirms the conviction of the bulls at the key support base. The remainder of the session was a sustained, steady grind upward.
The most significant takeaway is the successful close near the PDH, signaling strong momentum.
However, the consistent rejection at 25920 ~ 25930 confirms this remains the most immediate and difficult overhead supply zone.
📉 Daily Time Frame Chart with Intraday Levels
🕯 Daily Candle Breakdown
Open: 25,771.40
High: 25,922.80
Low: 25,693.25
Close: 25,898.55
Change: +140.55 (+0.55%)
🏗️ Structure Breakdown
Type: Bullish candle with a strong lower wick.
Range (High–Low): ≈ 230 points — high intraday activity.
Body: ≈ 24 points — minor profit booking near highs.
Upper Wick: ≈ 83.6 points — strong rejection near the day’s high
Lower Wick: ≈ 78 points — decisive buying from lower levels, forming a long lower shadow.
📚 Interpretation
The candle is strongly bullish, demonstrating that despite the sharp early volatility, demand aggressively absorbed the selling pressure. The strong body and close near the high signals that bulls have regained control of the short-term trend. The long lower wick suggests the low of the day served as a successful bear trap, and the rally has strong underlying support.
🕯 Candle Type
Bullish Candle with Strong Lower-Wick Support — Indicates demand dominance and potential continuation if follow-up buying appears.
🛡 5 Min Intraday Chart
⚔️ Gladiator Strategy Update
ATR: 203.87
IB Range: 109.80 → Medium
Market Structure: Balanced
Trade Highlights:
11:17 Long Trade - Target Hit (R:R 1:2.15) (IBH Breakout + Vwap & Trendline support)
13:07 Short Trade - SL Hit (Contra Trade : Trendline Breakout)
Trade Summary: The volatile reversal day provided mixed results. The strategy successfully captured the core bullish trend with a high R:R long trade following the confirmed recovery, but the attempt to catch the trendline failure later in the day resulted in a stop-loss hit.
🧱 Support & Resistance Levels
Resistance Zones:
25930 ~ 25920 (Immediate Polarity Flip Resistance)
25985
26030
Support Zones:
25740 ~ 25715 (Critical Immediate Base Support)
🧠 Final Thoughts
“The 25920 zone is the key to unlocking the next 26,000 target.”
The bulls successfully reclaimed the ground lost yesterday, and the 25715 ~ 25740 support is now confirmed as a strong base. The immediate challenge for tomorrow is the 25920 ~ 25930 resistance. If this is broken and held, a short covering rally could quickly trigger toward 26030 and potentially 26104. A break and sustain above 26104 would be a very strong signal for a broader reversal.
✏️ Disclaimer
This is just my personal viewpoint. Always consult your financial advisor before taking any action.
Niftyintradaytradesetup

Nifty Analysis EOD – December 4, 2025 – Thursday🟢 Nifty Analysis EOD – December 4, 2025 – Thursday 🔴
Bulls Retake 26K: Recovery Capped by Late Selling Pressure.
🗞 Nifty Summary
The session began flat, immediately plunging 50 points to mark the day low at 25,938.95. The subsequent recovery was swift and confident, successfully pushing the Nifty above the initial resistance at 26030 and completing the Initial Balance (IB) formation.
The index then methodically climbed through 26075, PDH, and 26104. Bulls tried hard to sustain above the PDH but failed, leading to a sharp fallback below 25985 and the PDC.
After another strong, 100-point recovery attempt failed to reclaim the PDH, the day concluded with a surprise element: sharp selling in Reliance (2% fall within last 30 minutes) wiped out 50 points in the last 30 minutes.
Despite this late pressure, the Nifty closed successfully at 26,010.35, securing a close above the psychological 26K level. The day was full of action, showing strong territorial fighting from both sides.
🛡 5 Min Intraday Chart with Levels
🛡 Intraday Walk
The initial market weakness was quickly negated by strong buyers at 25938, turning the early move into a deep lower wick.
The strong recovery confirmed demand below 26K. The most crucial structural failure occurred when Nifty broke 26104 but could not hold it, showing overhead supply at that level. This failure indicates that while bulls are defending 26K, they lack the conviction for a sustained breakout.
The final sharp sell-off, attributed primarily to a major heavyweight stock (Reliance), dragged the closing price lower, but the close above 26K remains a small victory for the bulls.
📉 Daily Time Frame Chart with Intraday Levels
🕯 Daily Candle Breakdown
Open: 25,981.85
High: 26,098.25
Low: 25,938.95
Close: 26,033.75
Change: +47.75 (+0.18%)
🏗️ Structure Breakdown
Type: Bullish candle with a moderately long upper wick.
Range (High–Low): ≈ 159 points — demonstrating moderate intraday movement.
Body: ≈ 52 points — reflecting controlled upside strength.
Upper Wick: ≈ 64 points — indicates that buyers attempted a breakout but faced significant resistance near the highs (26,100).
Lower Wick: ≈ 43 points — confirms buyers protected the lower levels early in the session.
📚 Interpretation
The candle is bullish, confirming a successful defense of the 25930 ~ 25920 zone. However, the long upper wick is a warning signal, showing strong supply near 26,100. The overall structure suggests that while bulls are fighting back, they are meeting strong resistance at critical breakout levels. The successful close above the 26K psychological level is the primary positive takeaway.
🕯 Candle Type
Bullish Candle with Upper-Wick Resistance — Upside continuation requires clearing the 26100 resistance decisively.
🛡 5 Min Intraday Chart
⚔️ Gladiator Strategy Update
ATR: 189.97
IB Range: 97.4 → Medium
Market Structure: Balanced
Trade Highlights:
10:07 Long Trade - Target Hit (R:R 1:1.74) (IBH + Resistance Breakout)
12:05 Long Trade - SL Hit (IBH + Resistance Breakout)
Trade Summary: The strategy capitalized on the strong morning recovery from the day’s low, securing an early long target. However, the unexpected high-level rejection and subsequent choppy price action around the PDH resulted in the second trade hitting its stop loss.
🧱 Support & Resistance Levels
Resistance Zones:
26030 ~ 26075
26104
26132 ~ 26160
26220
Support Zones:
25985
25930 ~ 25920 (Immediate Base)
🧠 Final Thoughts
“The fight for 26100 defines the week.”
The market is holding above 26K, which is positive, but the strong selling near 26100 shows bears remain active. For tomorrow’s session, bulls must breach the 26160 gap zone and secure a close above 26100 to maintain bullish momentum. Failure to do so could lead to a re-test of the 25985 support.
✏️ Disclaimer
This is just my personal viewpoint. Always consult your financial advisor before taking any action.

Nifty Analysis EOD – November 26, 2025 – Wednesday🟢 Nifty Analysis EOD – November 26, 2025 – Wednesday 🔴
The “Greenest Day”: Open = Low and a One-Sided Rally Towards ATH.
🗞 Nifty Summary
Responding strongly to positive news and global market cues, the Nifty started with the formation of Open = Low (25,842.95) and launched a relentless, one-sided rally toward the 26200 level. Many traders were expecting a dip at resistance, but this slow, steady, and strong northern run kept pushing upward.
After a long period, all indices traded firmly in the green. The index closed powerfully at 26,205.30, adding a massive +320.50 points (+1.24%).
The sheer magnitude and structure of the move—a full-body bullish candle—raises the key questions: Was this heavy short covering on the first day of the new expiry, or genuine fresh institutional long positioning? The move has been stunning, and the Nifty is now right on the doorstep of the All-Time High (ATH).
🛡 5 Min Intraday Chart with Levels
🛡 Intraday Walk
The Open = Low condition immediately signaled aggressive buying and zero morning hesitation. The rally consumed all previous resistance levels from the past two days with minimal effort.
This strongly imbalanced market structure created a challenging trading day for those expecting a retracement. The steady climb, driven by strong volumes, suggests high conviction behind the move. The focus now shifts entirely to the imminent challenge of the All-Time High at 26277.
📉 Daily Time Frame Chart with Intraday Levels
🕯 Daily Candle Breakdown
Open: 25,842.95
High: 26,215.15
Low: 25,842.95
Close: 26,205.30
Change: +320.50 (+1.24%)
🏗️ Structure Breakdown
Type: Strong Bullish candle (Marubozu).
Range (High–Low): ≈ 372 points — high volatility and decisive trend strength.
Body: ≈ 362 points — reflecting powerful upside momentum with strong institutional buying.
Upper Wick: ≈ 10 points — buyers held control till the very end, minimal profit booking near the close.
Lower Wick: ≈ 0 points — the market never traded below the open (Open = Low), indicating aggressive, non-stop buying from the first minute.
📚 Interpretation
This is a textbook signal of extreme bullish conviction. The Marubozu-like structure completely engulfs several previous days’ candles, negating the recent bearish retracement and confirming the continuation of the primary trend. The focus now is on follow-through; a move of this strength often precedes an immediate challenge of the next major objective.
🕯 Candle Type
Marubozu Bullish Candle
🛡 5 Min Intraday Chart
⚔️ Gladiator Strategy Update
ATR: 210.90
IB Range: 195.5 → Big
Market Structure: ImBalanced
Trade Highlights:
09:45 Long Trade - Target Hit (R:R 1:2.94)
Trade Summary: Given the powerful one-sided nature of the move, the strategy quickly identified the bullish imbalance and captured the core directional move with a high R:R long trade, performing perfectly in a trending market.
🧱 Support & Resistance Levels
Resistance Zones:
26220 (Immediate Resistance)
26277 (All-Time High / Key Hurdle)
Support Zones:
26104 (Previous Strong Resistance, now first support)
26030
25985
25930 ~ 25920
🧠 Final Thoughts
“Frozen by the move? Now, plan for the ATH breach.”
The market has cleared all immediate resistance and is poised to challenge the All-Time High (26277). Given the strength of today’s close, the bias for Thursday is strongly bullish.
We must watch for an immediate follow-through above 26220. If the market fails to breach the ATH (26277) on the first attempt, a minor dip back to the 26104 support would be healthy before the next attempt.
✏️ Disclaimer
This is just my personal viewpoint. Always consult your financial advisor before taking any action.

Nifty Intraday Levels : 24-Nov-25Nifty closed near the support level of trendline and Support Zone sustain above the zone upside move and if break will expect downfall
Bearish < 26020
Bullish > 26130
Wait for Proper Rejection/Pattern :
Support : Bullish
Resistance : Bearish
Use Sl Trailing to reduce Risk
*All views for educational purpose only

Nifty Analysis EOD – November 19, 2025 – Wednesday 🟢 Nifty Analysis EOD – November 19, 2025 – Wednesday 🔴
Bulls Reclaim Dominance, Securing a Strong Close Above 26,000
🗞 Nifty Summary
The Nifty opened with a 39-point Gap Up, immediately dipping to find strong support at 25,857.50, which marked the day’s low. From this base, the index began a steady climb, reaching the 25977 resistance without significant hindrance.
After a brief retrace to 25920, the main buying pressure pushed the index into the contentious 26010 ~ 26030 zone. Here, bulls and bears engaged in a strong fight for dominance. Ultimately, the bulls won, successfully breaching 26,040 and marking the day’s high at 26,074.65.
The Nifty closed firmly at 26,052.65, adding +142.60 points (+0.55%) and closing higher than the previous session’s high. This move is a strong indicator of bullish control, completely engulfing the negative candle from the prior day.
For tomorrow, the 25920 ~ 25944 range is critical support, setting the stage for a potential move toward 26104 and higher.
🛡 5 Min Intraday Chart with Levels
🛡 Intraday Walk
The session featured an excellent demonstration of buy-on-dip sentiment. After the initial dip, the price movement was characterized by strong, gradual ascent, indicating institutional participation.
The most challenging part of the day was the consolidation around the 26,000 psychological mark, where high volatility was observed. Although the intraday price action around 26K was tough, the decisive final close near the high confirms that the sellers ran out of steam, and bulls secured dominance.
The daily chart forming an Engulfing Candle is a classic pattern indicating a potential trend continuation with renewed momentum.
📉 Daily Time Frame Chart with Intraday Levels
🕯 Daily Candle Breakdown
Open: 25,918.10
High: 26,074.65
Low: 25,856.20
Close: 26,052.65
Change: +142.60 (+0.55%)
🏗️ Structure Breakdown
Type: Bullish candle, engulfing the previous day’s bearish body.
Range (High–Low): ≈ 218 points — a wide range showing strong intraday activity.
Body: ≈ 134 points — confirming buyers were firmly in control throughout the session.
Upper Wick: ≈ 22 points — mild rejection near the highs, but overall insignificant.
Lower Wick: ≈ 62 points — the early dip was aggressively bought, confirming demand at lower levels.
📚 Interpretation
The strong close near the day’s high indicates solid bullish conviction, completely negating the bearish price action from the previous session. The close above the previous day’s high is a key technical signal. While the move above 26,000 was contested, the resulting Bullish Engulfing Candle on the daily time frame strongly suggests that the bullish momentum is back and possibly accelerating.
🕯 Candle Type
Strong Bullish Candle with Lower-Wick Buying Support — A powerful continuation signal.
🛡 5 Min Intraday Chart
⚔️ Gladiator Strategy Update
ATR: 196.97
IB Range: 77.45 → Medium
Market Structure: ImBalanced
Trade Highlights:
9:32 Long Trade - SL Hit
9:55 Long Trade - Target Hit (R:R 1:1.8)
11:25 Long Trade - Target Hit (R:R 1:3.46)
13:26 Short Trade - Trailing SL Hit
Trade Summary: The volatile nature of the range-bound morning led to an initial loss, but the strategy successfully captured two high R:R long trades during the main directional move upwards. The day’s action provided good two-sided opportunities, but the final outcome confirmed the long side as dominant.
🧱 Support & Resistance Levels
Resistance Zones:
26075 (Day’s High)
26104
26220
Support Zones:
26010 (Psychological Support)
25977
25944 ~ 25920 (Critical Intraday Support)
🧠 Final Thoughts
“The bulls have responded with force. The range battle is over.”
The decisive close above 26,000 has shifted the bias back to the upside. For the continuation, Nifty must clear and hold above 26075. A clean break of 26104 would likely open the path toward 26220. The key level to watch for short-term support is the 25920 ~ 25944 band; as long as Nifty holds here, the path is upward.
✏️ Disclaimer
This is just my personal viewpoint. Always consult your financial advisor before taking any action.

Nifty Analysis EOD – November 14, 2025 – Friday🟢 Nifty Analysis EOD – November 14, 2025 – Friday 🔴
Last-Hour Bull Spike Erases Weekly Uncertainty; 170 Points Fulfilled Descending Triangle Target!
🗞 Nifty Summary
The Nifty opened the final session of the week with a significant 117.80-point Gap Down. The session started with an OL formation (Open = Low), and the initial gap was swiftly filled within the first 20 minutes. However, the market immediately fell back to the opening price, marking the beginning of an extremely volatile, range-bound day characterized by sharp 50-100 point moves. The price action successfully trapped sellers multiple times around the PDL, IB Low, and Open Price Zone. Gradually, the range tightened, forming a Descending Triangle pattern.
The entire picture shifted dramatically at 3:00 PM when this pattern triggered a powerful breakout, spiking 170 points within 10 minutes and fulfilling the pattern’s target.
The day closed at 25,910.05, near the day’s high and above the Previous Day’s Close (PDC).
This close above 25850 successfully maintains the short-term bullish momentum, setting sights on 26100 and the All-Time High (ATH) next week, provided the crucial 25750 support holds tight.
🛡 5 Min Intraday Chart with Levels
🛡 Intraday Walk
The session commenced with a deep gap-down, but the initial OL formation saw bulls immediately absorb the selling, filling the gap. However, the rest of the day was a struggle, defined by a choppy, balanced Market Structure with high volatility. The resistance near the previous day’s trading range successfully pushed the index lower repeatedly. The critical development was the formation of the Descending Triangle throughout the afternoon, reflecting consolidation and potential breakout tension. The explosive breakout at 3:00 PM caught many off-guard, demonstrating the sustained underlying buying interest and conviction to close the week strong.
📉 Daily Time Frame Chart with Intraday Levels
🕯 Daily Candle Breakdown
Open: 25,767.90
High: 25,940.20
Low: 25,740.80
Close: 25,910.05
Change: +30.90 (+0.12%)
🏗️ Structure Breakdown
Type: Small bullish candle with a long lower wick.
Range (High–Low): ≈ 199.40 points — reflecting healthy and active intraday volatility.
Body: ≈ 142.15 points — a moderately sized bullish body, demonstrating buyer dominance by the close.
Upper Wick: ≈ 30.15 points — limited profit booking near the day’s high.
Lower Wick: ≈ 27.10 points — immediate, sharp buying response from the lower levels.
📚 Interpretation
The market opened soft but confirmed buyers were present at the low (25,740). The strong, rapid close near 25,940 is the most important structural element, confirming that the bulls decisively won the weekly close battle. The overall day was active due to factors like financial/election results and the week’s end, but the final action indicates trend continuation.
🕯 Candle Type
Bullish Candle with minor rejection at highs — This is a strong continuation candle and indicates that the underlying uptrend remains intact heading into next week.
🛡 5 Min Intraday Chart
⚔️ Gladiator Strategy Update
ATR: 208.20
IB Range: 112.85 → Medium
Market Structure: Balanced
Trade Highlights:
13:44 Short Trade – SL Hit
Trade Summary: The tight, volatile, and balanced nature of the day resulted in tricky trade management. Many opportunities arise, but the system is not permitted due to Risk Reward (R:R) Rules.
🧱 Support & Resistance Levels
Resistance Zones:
25920 ~ 25944
25977 ~ 26010
26040
26100
Support Zones:
25880 ~ 25865
25790
25740 ~ 25715
🧠 Final Thoughts
“The close is not just a number; it’s a statement.”
The weekly close is firmly bullish, successfully securing the required level above 25850. The challenge for the start of the next week will be to convert the short-term 25920 ~ 25944 resistance into support. A sustained move above this zone should quickly challenge 26100. For the bears to gain control, they must push the Nifty below the 25750 level.
✏️ Disclaimer
This is just my personal viewpoint. Always consult your financial advisor before taking any action.

Nifty Analysis EOD – November 12, 2025 – Wednesday🟢 Nifty Analysis EOD – November 12, 2025 – Wednesday 🔴
Bulls Advance, But Pause at the Gate: 25920 Proves to be a Fortress!
🗞 Nifty Summary
The Nifty continued its strong bullish journey with a massive 117-point Gap Up, opening above the previous day’s high and confirming a clear continuation of positive sentiment. While the index successfully reached and tested the target of 25920 outlined in yesterday’s commentary, it was unable to sustain the breakout. The slow, zigzag movement into this key resistance zone suggests supply is aggressively defending the 25920 ~ 25940 range. The close at 25,875.80 is still structurally bullish, sitting above the prior week’s high, but the bulls must find conviction to conquer the 25920 hurdle to unlock the next 26050 ~ 26100 expansion.
🛡 5 Min Intraday Chart with Levels
🛡 Intraday Walk
The session commenced with a powerful 117-point Gap Up, immediately absorbing the aggressive buying from the previous session. Following a brief 40-point retrace that tested the 25790 support, Nifty sharply jumped around 80 points to the next resistance band of 25865. The index then consolidated with a slight pause between 25865 ~ 25880 before attempting a push toward 25920. This final leg of the upward journey was notably slow, characterized by smaller candles and a zigzag micro-trend, indicating diminishing conviction and resistance from sellers. The high was marked at 25,934.55 before the index pulled back slightly to close just below the key structural resistance.
📉 Daily Time Frame Chart with Intraday Levels
🕯 Daily Candle Breakdown
Open: 25,834.30
High: 25,934.55
Low: 25,781.15
Close: 25,875.80
Change: +180.85 (+0.70%)
🏗️ Structure Breakdown
Type: Bullish candle with moderately long, balanced wicks.
Range (High–Low): ≈ 153.40 points — a tighter range than yesterday, suggesting consolidation.
Body: ≈ 41.50 points — smaller body size, reflecting a loss of directional dominance near the close.
Upper Wick: ≈ 58.75 points — indicating sellers defending the upper resistance band (25920+).
Lower Wick: ≈ 53.15 points — confirming sustained buying interest on intraday dips.
📚 Interpretation
The candle is essentially a Bullish Spinning Top, representing indecision or a temporary equilibrium near a major resistance area. While the overall close is positive (a higher high and a higher close), the relatively balanced wicks show strong two-way action. Buyers pushed aggressively, but sellers successfully capped the high at 25,934, confirming that the 25920-25940 zone is a significant supply barrier.
🕯 Candle Type
Bullish Spinning Top — A continuation candle but signals a necessary pause before the next major move. It confirms the need for a decisive breakout before further vertical expansion.
🛡 5 Min Intraday Chart
⚔️ Gladiator Strategy Update
ATR: 209.94
IB Range: 80.05 → Medium
Market Structure: ImBalanced
Trade Highlights:
10:34 Long Trade – Target Achieved (R:R 1:1.64)
Trade Summary: The strategy capitalized successfully on the initial bullish continuation move following the gap-up. The lower volatility day, indicated by the medium IB range, limited the overall high R:R opportunities, but the core long trend was managed profitably.
🧱 Support & Resistance Levels
Resistance Zones:
25920 ~ 25944 (Crucial Barrier)
25977
26050
26100
Support Zones:
25835
25790
25715 ~ 25680
🧠 Final Thoughts
“The market rewards the patient general, not the emotional soldier.”
Tomorrow’s session promises to be a tricky battlefield for intraday players. The current resistance at 25920 ~ 25944 is the gatekeeper.
Discipline is paramount:
either wait for a decisive, sustained breach and hold above 25920 for the continuation long trade, or wait for the market to fail the PDL and execute the counter-trend short trade with targets at 25715 ~ 25680. Don’t chase the slow moves—wait for confirmation at the structural levels.
✏️ Disclaimer
This is just my personal viewpoint. Always consult your financial advisor before taking any action.

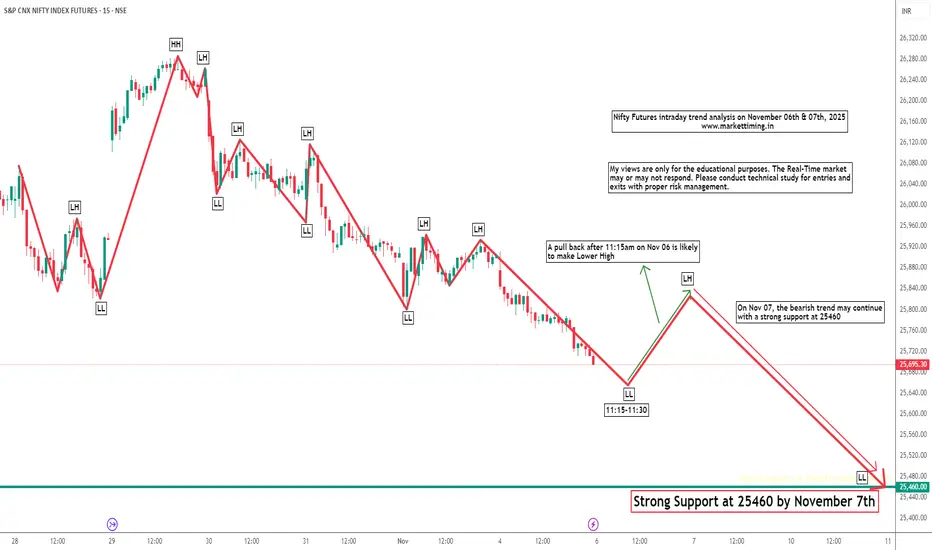
Nifty Futures Intraday Trend Analysis for November 6th and 7thBased on my pattern analysis, I anticipate the bearish momentum to persist until November 7th, potentially testing the support level around 25,460. However, on November 6th, a pullback after 11:15 AM is possible, which could result in a lower high formation.
Please note that this is my personal market outlook, and actual price action may vary due to potential gaps on either side. Traders are advised to perform their own technical analysis for entries and exits, while maintaining proper risk management practices.
Nifty Analysis EOD – November 4, 2025 – Tuesday🟢 Nifty Analysis EOD – November 4, 2025 – Tuesday 🔴
A textbook triple-distribution day where bears dominated the expiry setup.
🗞 Nifty Summary
Nifty started flat to negative and instantly marked the day high at 25,787.40 in the very first minute. A sharp 82-point drop followed, taking the index to the crucial 25,706 zone. From there, Nifty got trapped within a narrow 35-point range (25,720–25,685) before slipping into another similar micro-range (25,685–25,650).
The entire day was a grind dominated by bears while bulls fought to defend supports — often leading to both-side fakeouts that punished intraday traders, particularly option buyers during weekly expiry volatility.
Around 2 PM, a breakdown from the second range breached both the PDL and the 25,635–25,615 support zone with strong momentum and volatility. The index eventually closed at 25,597.65, right at support and near the day’s low — confirming a triple-distribution day structure and a decisive bearish tone.
The engulfing move of yesterday’s bullish candle indicates that bears still have control, and short-term retracement toward 25,400 remains likely.
🛡 5 Min Intraday Chart with Levels
📉 Daily Time Frame Chart with Intraday Levels
🕯 Daily Candle Breakdown
Open: 25,744.75
High: 25,787.40
Low: 25,578.40
Close: 25,597.65
Change: −165.70 (−0.64%)
🏗️ Structure Breakdown
Type: Large bearish candle with a long body and small upper wick.
Range (High–Low): 209 points → high volatility session.
Body: ≈ 147 points → strong bearish control throughout.
Upper Wick: ≈ 42.65 points → rejection from 25,780 resistance.
Lower Wick: ≈ 19.25 points → weak late-session buying attempt.
📚 Interpretation
Nifty opened weak and failed to sustain above 25,780, triggering heavy selling below 25,650. This breakdown invalidated short-term bullish attempts, with bears pressing the index below major supports.
Despite minor pullbacks, the structure clearly confirms downtrend continuation with momentum building toward 25,400.
🕯Candle Type
A strong bearish continuation candle, confirming that yesterday’s spinning-top pattern was merely a pause before another leg lower.
🛡 5 Min Intraday Chart
⚔️ Gladiator Strategy Update
ATR: 202.64
IB Range: 102.30 → Medium
Market Structure: Balanced
Trade Highlights:
10:17 – Short Trade → SL Hit
11:25 – Long Trade → Trailing SL Hit
14:10 – Short Trade → Trailing SL Hit
📌 What’s Next? / Bias Direction
Trend : Bearish Continuation
If this momentum persists, short-term retracement toward 25,400 seems likely. Immediate supports lie at 25,550 and 25,460–25,440 zones.
📌 Support & Resistance Levels
Resistance Zones:
25,715
25,790
25,865 ~ 25,880
Support Zones:
25,585
25,550
25,510
25,460 ~ 25,440
💡 Final Thoughts
A clean triple-distribution expiry session often defines trend continuation phases rather than reversals. As long as Nifty remains below 25,700, sellers will dominate. A break below 25,550 could extend the fall to 25,400 — while any sustained move above 25,715 may only bring temporary relief.
“The market rewards patience when chaos tests conviction.”
✏️ Disclaimer
This is just my personal viewpoint. Always consult your financial advisor before taking any action.

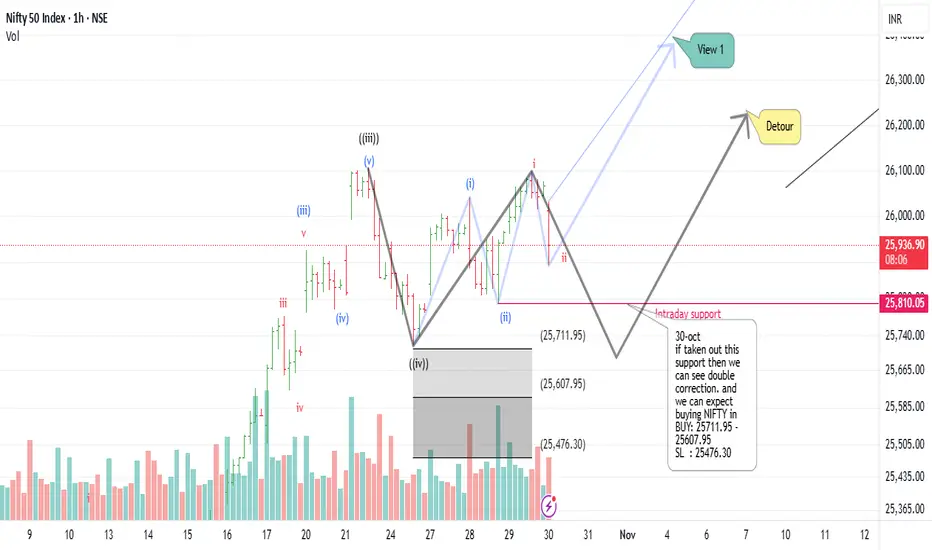
Nifty Intraday DetourIncase Nifty doesn't hold 25810 then will have to tweak the wave count and expect Nifty to correct upto 25712-25476. If that happens then we will plan to buy in Range of 25712-25608 and keep stop loss for 25476
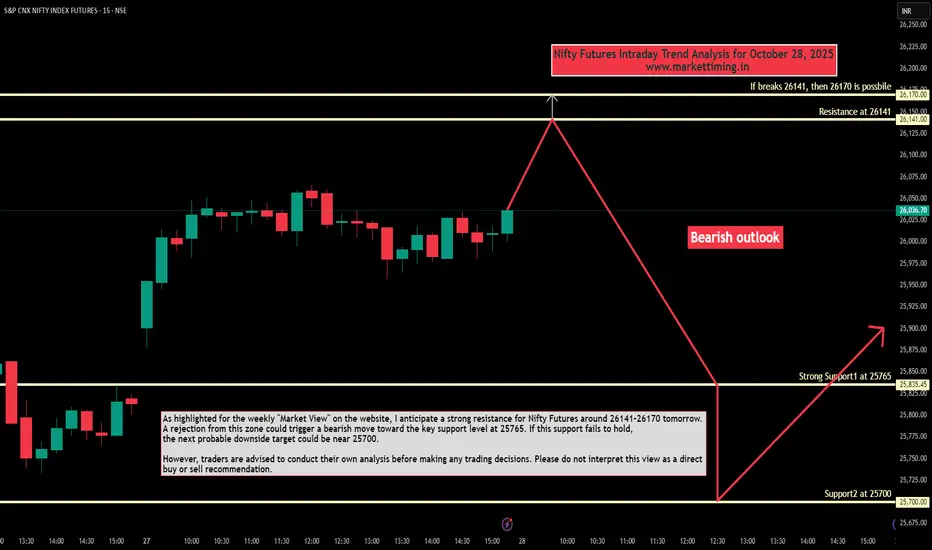
Nifty Futures Intraday Trend Analysis for October 28, 2025As highlighted for weekly "Market View" outlook on the website, I anticipate a strong resistance for Nifty Futures around 26141–26170 tomorrow. A rejection from this zone could trigger a bearish move toward the key support level at 25765. If this support fails to hold, the next probable downside target could be near 25700.
However, traders are advised to conduct their own analysis before making any trading decisions. Please do not interpret this view as a direct buy or sell recommendation.
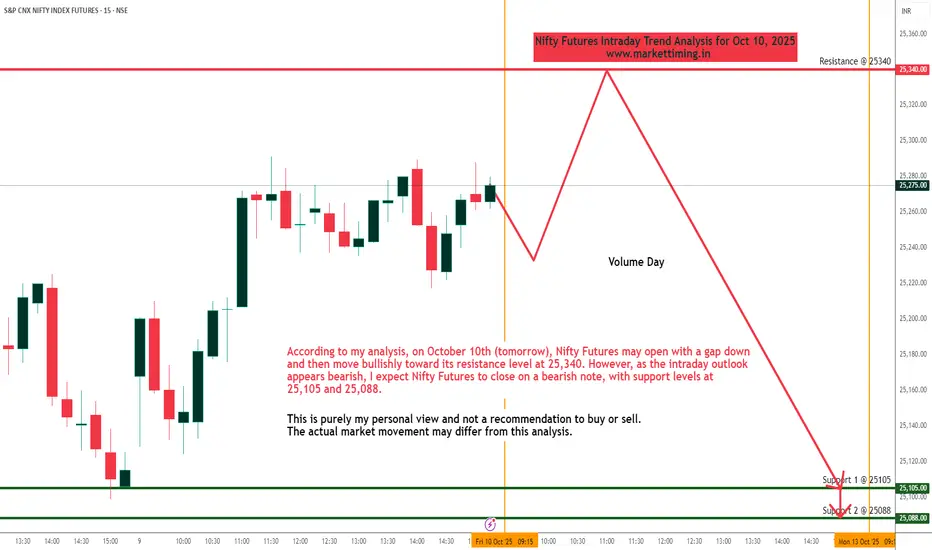
Nifty Futures Intraday Trend Analysis for October 10, 2025According to my analysis, on October 10th (tomorrow), Nifty Futures may open with a gap down and then move bullishly toward its resistance level at 25,340. However, as the intraday outlook appears bearish, I expect Nifty Futures to close on a bearish note, with support levels at 25,105 and 25,088.
This is purely my personal view and not a recommendation to buy or sell. The actual market movement may differ from this analysis.
Nifty Analysis EOD – October 3, 2025 – Thursday🟢 Nifty Analysis EOD – October 3, 2025 – Thursday 🔴
Bulls stamp authority with a strong close near the highs
🗞 Nifty Summary
Nifty opened with a 67-point gap down at 24,785.70, and the first 5-min candle was wild, spanning 97 points. The initial upmove managed to fill the gap but couldn’t sustain above, slipping back quickly.
The IB Range (24,747.55 – 24,855.70) set the tone, and for most of the session (until 2:40 PM), the index swung wildly inside this wide band, offering multiple trade opportunities on both sides.
Around 2:10 PM, a trendline false breakdown (liquidity trap) shook out bears. Soon after, bulls reclaimed control, breaking the trendline, PDC, and PDH, and pushed the index to a new day high of 24,904.80. Nifty closed strong at 24,895, almost at the high, firmly above the previous day’s high.
The session was energetic for traders, packed with volatility and clean structure, and the close reinforced bullish continuation.
🛡 5 Min Intraday Chart with Levels
🛡 Intraday Walk
Gap down open at 24,785.70.
First 5-min candle = 97 points → extreme volatility.
IB Range set between 24,747 – 24,856, market chopped inside until 2:40 PM.
2:10 PM: False breakdown trap → liquidity grab.
Bulls took charge → breakout above IB, PDC, and PDH.
Day high: 24,904.80 → close: 24,895 (near highs).
📉 Daily Time Frame Chart with Intraday Levels
🕯 Daily Candle Breakdown
Open: 24,759.55
High: 24,904.80
Low: 24,747.55
Close: 24,894.25
Change: +57.95 (+0.23%)
🏗️ Structure Breakdown
Solid green body: ~134.7 pts.
Range: ~157.25 pts (moderate).
Very tiny upper/lower wicks.
📚 Interpretation
Flat-to-weak open, dip to 24,747, then steady climb.
Closing almost at the high = strong conviction.
Minimal rejection → clean bullish candle.
🕯Candle Type
Bullish Marubozu (near-perfect) → Buyers in full control.
Confirms continuation of bullish reversal from Oct 1st.
🛡 5 Min Intraday Chart
⚔️ Gladiator Strategy Update
ATR: 179.73
IB Range: 108.15 → Wide
Market Structure: Balanced
Trade Highlights
11:10 Long Trade – Target Achieved (R:R 1:2.08)
14:10 Short Trade – SL Hit
14:35 Long Trade – Target Achieved (R:R 1:3.96)
📌 What’s Next? / Bias Direction
Bias: Bullish continuation.
If bulls clear 25,000 with momentum, the next leg may unfold toward 25,115–25,250. Supports at 24,785–24,830 need to hold for trend continuity.
📌 Support & Resistance Levels
Resistance Zones:
24890 ~ 24915
24990 ~ 25000
25048
25085
25115
Support Zones:
24830
24785
24745
💡 Final Thoughts
“Markets often test patience with traps before rewarding conviction with momentum. Today’s close above PDH is a classic sign of strength.”
✏️ Disclaimer
This is just my personal viewpoint. Always consult your financial advisor before taking any action.

Nifty 50: Genuine Rally or Selloff Setup?The Nifty 50 Index went up, but this upward move was likely just a temporary correction, not the start of a new, long-term rise.
Bottom (Wave W): The index first hit a low around 24,377
Bounce (Wave X): It then went up to a high near 25,448. This rise was a clear, three-part corrective move (like an ABC pattern) that stayed inside a rising channel .
Clue: Because the move from the bottom (W) to the peak (X) was corrective, it suggests the overall trend is still bearish (downward).
Points to look at:
1. Reversal: The index is currently around 24,836 and is starting to turn down from the top of that rising channel. This suggests the temporary rise is over.
2. Projected Drop (Wave Y): The main prediction is a significant drop (Wave Y) that will likely break the previous low of 24,377 .
3. Target: This decline is expected to head toward the lower blue trendline on the chart, completing a larger WXY corrective pattern.
4. Projection: Ending point of wave (Y) can act as the ride for the new impulse cycle.
5. Bearish Stance: Traders should be cautiously bearish (expecting the price to fall).
6. Price action perspective: Previous swing is bearish, better to look at short positions for safe entry.
7. Selling Opportunities: Any small upward movements (retracements) are seen as good selling opportunities (betting on the price going down), as long as the price doesn't break above the recent highs or the channel ceiling.24,300 is indeed a strong demand zone.
Stay tuned!
Money Dictators :)

nifty50 Analysis | be careful from trapMarket Outlook
Support Zone: 24,550 – 24,400
Resistance Levels: 24,750 – 24,790 and 24,960 – 24,990
A falling wedge pattern is currently forming just above the support zone. The key level to watch is 24,590, as a sweep of this low appears likely. However, before a potential breakdown, price may first retest the immediate resistance area and face rejection, leading back toward the support zone.

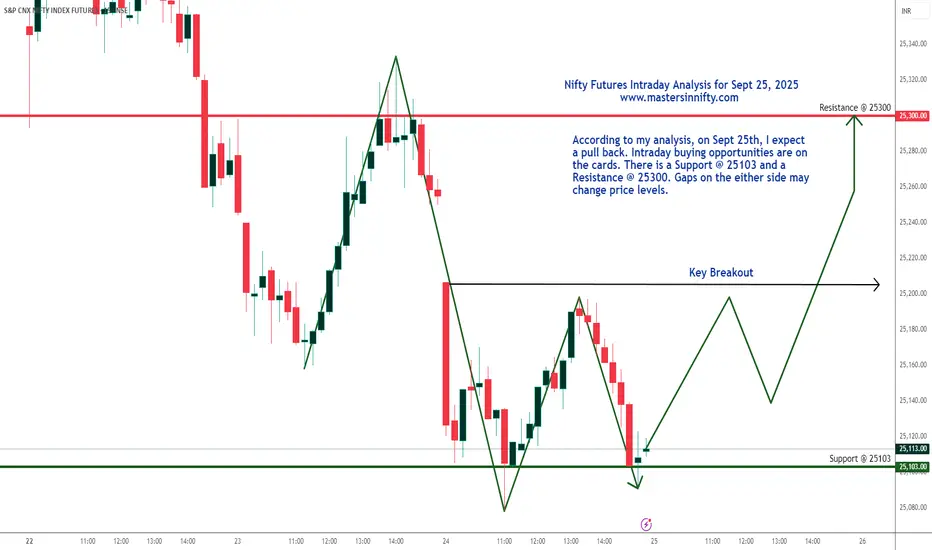
Nifty Intraday Trend Analysis for Sept 25, 2025According to my analysis, on Sept 25th, I expect a pull back. Intraday buying opportunities are on the cards. There is a Support @ 25103 and a Resistance @ 25300. Gaps on the either side may
change price levels.
It's my personal view. Real-Time market may not respond to my analysis due to other factors.
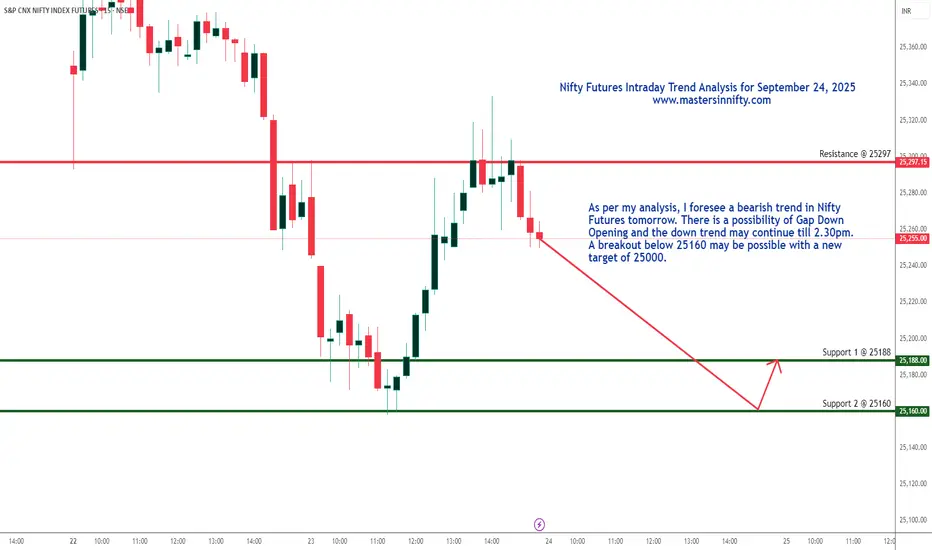
Nifty Futures Intraday Trend Analysis for September 24, 2025According to my analysis, a bearish trend is on the cards with Support levels at 25188 and 25160. Once it breaks 25160, there is a possibility of the next support levels at 25130 or 25000.
There is also a possibility of Gap Down opening tomorrow.
Since it's my personal perspective, traders are suggested to conduct own technical analysis before entering into trades. Trade with proper risk management.
Nifty Analysis EOD – September 23, 2025 – Tuesday🟢 Nifty Analysis EOD – September 23, 2025 – Tuesday 🔴
Expiry Day Drama – Two-Sided Moves, Tug of War Continues
🗞 Nifty Summary
Nifty opened with a 43-point gap up right at the strong resistance of 25,240, but selling pressure quickly kicked in. Within the first 30 minutes, the index fell 140 points from the high to test the crucial support at 25,115.
From there, a descending triangle pattern formed. Breakdown was triggered at 11:00 AM, but the next support at 25,085 came to the rescue. This 25,085–25,115 zone acted as a base, and once 25,115 was reclaimed, Nifty surged 108 points back to PDC. After a brief pause, the rally extended toward the day’s high, but the CPR Zone, CDO, CDH, and strong 25,240 resistance halted the move. Sellers pushed the index back below mean and PDC, closing at 25,169.50.
👉 Overall, expiry day was a roller coaster —
Great for option buyers with two-sided moves, but also tough to handle both sides that saw traps.
Tough for option sellers as both sides move on expiry day, too hot to handle.
Another spinning top–like candle emerged, reflecting the tug of war. With range expansion already visible, the next session may cool down into a narrower range, provided today’s high or low holds.
🛡 5 Min Intraday Chart with Levels
📉 Daily Time Frame Chart with Intraday Levels
🕯 Daily Candle Breakdown
Open: 25,209.00
High: 25,261.90
Low: 25,084.65
Close: 25,169.50
Change: −32.85 (−0.13%)
🏗️ Structure Breakdown
Small red candle (Close < Open).
Body: ~39.5 points → small body, indecision.
Range: ~177.25 points → wide swings.
Upper wick: ~52.90 points → rejection at 25,260.
Lower wick: ~84.85 points → buyers active at 25,085.
Close near lower-mid of the range.
📚 Interpretation
Opened at resistance → sellers took control early.
Buyers held 25,085–25,115, creating a base.
Rally attempts were capped at 25,240 resistance.
Close shows market still in tug of war, with sellers slightly ahead.
🕯Candle Type
Spinning Top → indecision but weak bias.
📉📈 Short-Term View – September 24, 2025
Resistance Zone: 25,250–25,340 → repeated selling here.
Support Zone: 25,085–25,115 → defended again today.
Break below 25,085 → downside to 25,048 / 25,000 / 24,990.
Bullish continuation only above 25,260–25,340.
👉 3-Day Context (19th → 23rd Sept)
19th Sept: Bearish rejection candle from ~25,420.
22nd Sept: Strong rejection near 25,330, weak close at 25,202.
23rd Sept: Spinning Top at 25,170 → hesitation, indecision, tilt bearish.
👉 The sequence shows distribution pressure building.
📌 Conclusion:
Nifty is losing bullish momentum as sellers hold 25,250–25,450 firmly, while bulls are desperately defending 25,080–25,150. Until one side gives way, expect volatile but range-bound trade. The bias leans toward a short-term correction unless bulls reclaim 25,330+ convincingly.
🛡 5 Min Intraday Chart
⚔️ Gladiator Strategy Update
ATR: 162.87
IB Range: 140.8 → Big
Market Structure: Imbalanced
Trade Highlights:
09:20 → Short Trade ✅ Target Achieved (R:R = 1:2)
11:10 → Short Trade ❌ SL Hit
12:25 → Long Trade ✅ Target Achieved (R:R = 1:3.63)
📌 Support & Resistance Levels
Resistance Zones:
25,240
25,290 ~ 25,307
25,340 ~ 25,385
25,425 ~ 25,460
Support Zones:
25,165 ~ 25,140
25,115
25,085
25,045
25,000 ~ 24,990
💡 Final Thoughts
The market played both sides on expiry day, rewarding nimble traders and punishing late movers. Key battle zone remains 25,085–25,150 vs. 25,250–25,340. Whoever wins this zone will dictate the next directional leg.
📖 “A range is the battlefield — breakout is the victory.”
✏️ Disclaimer
This is just my personal viewpoint. Always consult your financial advisor before taking any action.

Nifty Futures Intraday Trend Anaysis for Sept 16, 2025If the 25,154 support level breaks, Nifty Futures may find the next support at 25,126. From there, a potential rebound toward resistance levels at 25,212 or 25,235 could materialize by around 1 PM. Beyond that, the market is likely to trade range-bound with a mildly bearish bias. Overall, I anticipate a strong intraday buying opportunity for tomorrow.
This is just my view. This view may change in the real-time market due to various reasons. Traders are suggested to conduct your own technical studies before entering the trades with proper risk management.

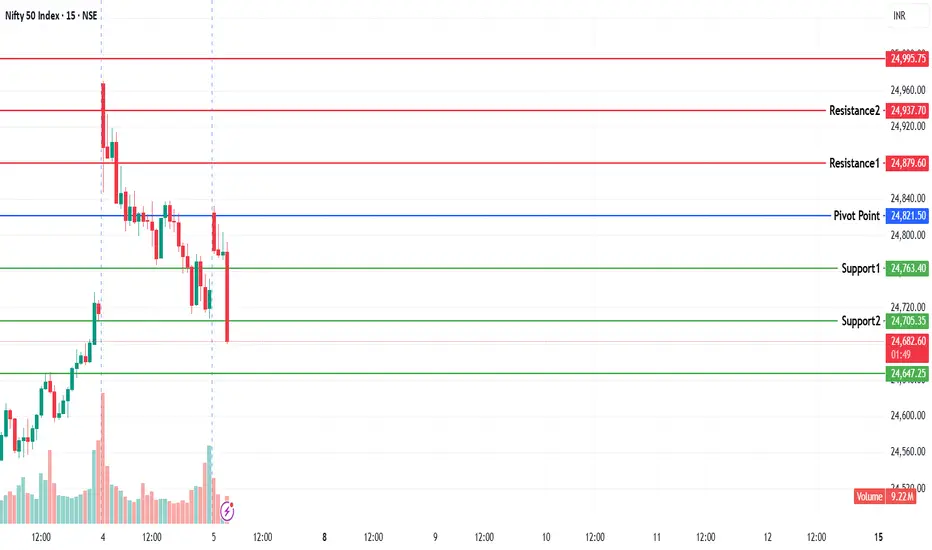
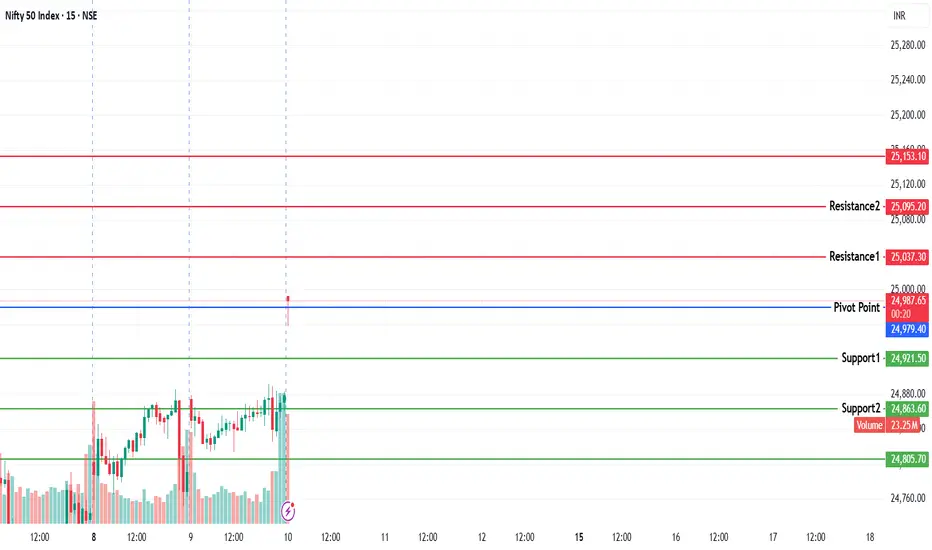
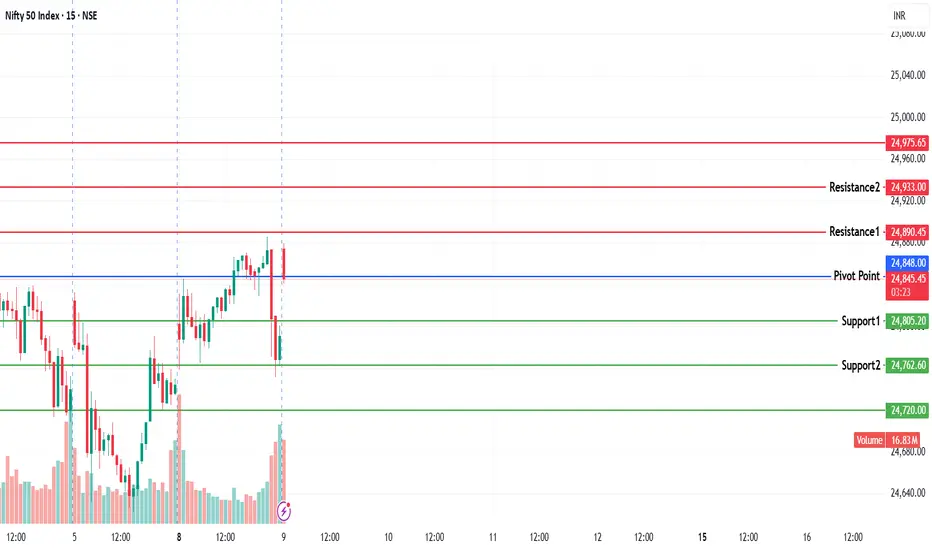
NIFTY KEY LEVELS FOR 10.09.2025NIFTY KEY LEVELS FOR 10.09.2025
RTF: 3 Minutes
If the candle stays above the pivot point, it is considered a bullish bias; if it remains below, it indicates a bearish bias. Price may reverse near Resistance 1 or Support 1. If it moves further, the next potential reversal zone is near Resistance 2 or Support 2. If these levels are also broken, we can expect the trend.
If the range(R2-S2) is narrow, the market may become volatile or trend strongly. If the range is wide, the market is more likely to remain sideways
📢 Disclaimer
I am not a SEBI-registered financial adviser.
The information, views, and ideas shared here are purely for educational and informational purposes only. They are not intended as investment advice or a recommendation to buy, sell, or hold any financial instruments.
Please consult with your SEBI-registered financial advisor before making any trading or investment decisions.
Trading and investing in the stock market involves risk, and you should do your own research and analysis. You are solely responsible for any decisions made based on this research.
NIFTY KEY LEVELS FOR 09.09.2025NIFTY KEY LEVELS FOR 09.09.2025
RTF: 3 Minutes
If the candle stays above the pivot point, it is considered a bullish bias; if it remains below, it indicates a bearish bias. Price may reverse near Resistance 1 or Support 1. If it moves further, the next potential reversal zone is near Resistance 2 or Support 2. If these levels are also broken, we can expect the trend.
If the range(R2-S2) is narrow, the market may become volatile or trend strongly. If the range is wide, the market is more likely to remain sideways
📢 Disclaimer
I am not a SEBI-registered financial adviser.
The information, views, and ideas shared here are purely for educational and informational purposes only. They are not intended as investment advice or a recommendation to buy, sell, or hold any financial instruments.
Please consult with your SEBI-registered financial advisor before making any trading or investment decisions.
Trading and investing in the stock market involves risk, and you should do your own research and analysis. You are solely responsible for any decisions made based on this research.
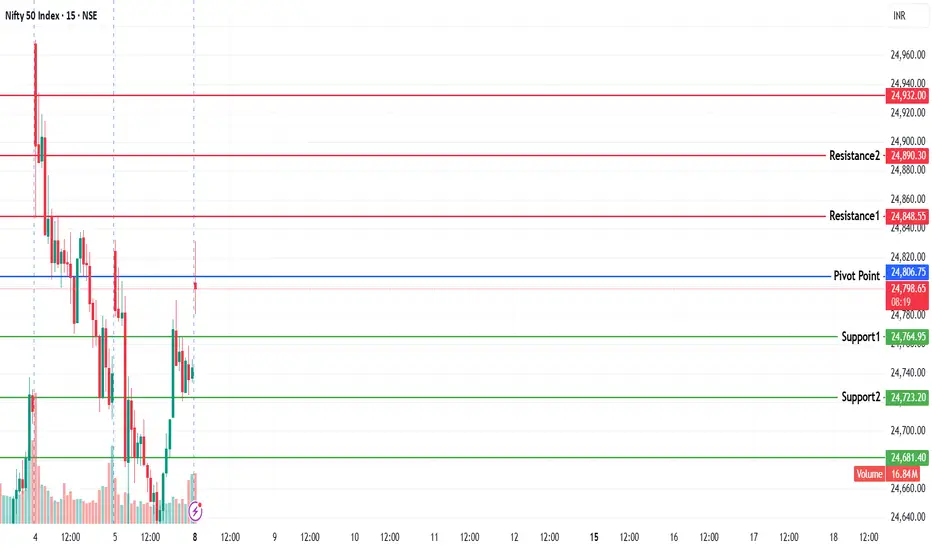
NIFTY KEY LEVELS FOR 08.09.2025NIFTY KEY LEVELS FOR 08.09.2025
RTF: 3 Minutes
If the candle stays above the pivot point, it is considered a bullish bias; if it remains below, it indicates a bearish bias. Price may reverse near Resistance 1 or Support 1. If it moves further, the next potential reversal zone is near Resistance 2 or Support 2. If these levels are also broken, we can expect the trend.
If the range(R2-S2) is narrow, the market may become volatile or trend strongly. If the range is wide, the market is more likely to remain sideways
📢 Disclaimer
I am not a SEBI-registered financial adviser.
The information, views, and ideas shared here are purely for educational and informational purposes only. They are not intended as investment advice or a recommendation to buy, sell, or hold any financial instruments.
Please consult with your SEBI-registered financial advisor before making any trading or investment decisions.
Trading and investing in the stock market involves risk, and you should do your own research and analysis. You are solely responsible for any decisions made based on this research.
NIFTY KEY LEVELS FOR 05.09.2025NIFTY KEY LEVELS FOR 05.09.2025
RTF: 3 Minutes
If the candle stays above the pivot point, it is considered a bullish bias; if it remains below, it indicates a bearish bias. Price may reverse near Resistance 1 or Support 1. If it moves further, the next potential reversal zone is near Resistance 2 or Support 2. If these levels are also broken, we can expect the trend.
If the range(R2-S2) is narrow, the market may become volatile or trend strongly. If the range is wide, the market is more likely to remain sideways
📢 Disclaimer
I am not a SEBI-registered financial adviser.
The information, views, and ideas shared here are purely for educational and informational purposes only. They are not intended as investment advice or a recommendation to buy, sell, or hold any financial instruments.
Please consult with your SEBI-registered financial advisor before making any trading or investment decisions.
Trading and investing in the stock market involves risk, and you should do your own research and analysis. You are solely responsible for any decisions made based on this research.