Nifty Analysis EOD – December 10, 2025 – Wednesday🟢 Nifty Analysis EOD – December 10, 2025 – Wednesday 🔴
25920 Resistance Holds Firm; Bears Secure Yet Another Lower Close at Critical Support.
🗞 Nifty Summary
The Nifty started with a 29-point Gap Up but immediately failed, filling the gap and briefly forming a base at the PDC. Bulls attempted to push north, but the crucial resistance zone of 25920 ~ 25930 and the PDH successfully repelled the advance.
After the failure, the index slipped below the IBL and the Previous Day’s Trendline support, dropping 90 points. Although a recovery was attempted, the market met the same resistance, leading to a deeper plunge that almost reached the PDL.
Once again, the strong support zone of 25715 ~ 25740 provided defense, yet bears managed to secure a close near the day’s low at 25,742.65. The day was a precise test of both PDH and PDL, but the lower close confirms that bears won the territorial fight today.
🛡 5 Min Intraday Chart with Levels
🛡 Intraday Walk
The day tested the range extremes, with the PDC acting as the mean level. The failure of the gap-up and the swift rejection at 25920 confirmed that the polarity flip witnessed yesterday is still valid—this level is now strong overhead supply.
The repeated rejection initiated the sustained downtrend. The close right on the 25715 ~ 25740 support zone means the market is now precariously positioned.
Tomorrow’s action is crucial: if the Nifty breaks the 25700 level and closes below it, a new, deeper downside zone will open for the index.
📉 Daily Time Frame Chart with Intraday Levels
🕯 Daily Candle Breakdown
Open: 25,864.05
High: 25,947.65
Low: 25,734.55
Close: 25,758.00
Change: −81.65 (−0.32%)
🏗️ Structure Breakdown
Type: Bearish candle with a Long Lower Wick, kind of spinning top.
Range (High–Low): ≈ 213.1 points — elevated intraday volatility.
Body: ≈ 106.05 points — moderate bearish body, showing sustained downside pressure.
Upper Wick: ≈ 83.6 points — strong rejection near the day’s high
Lower Wick: ≈ 23.45 points — limited buying attempt from lower levels.
📚 Interpretation
The candle shows a clear bearish tilt with a substantial body, confirming bears maintained control, resulting in a lower close. The size of the upper wick confirms the strong rejection at the 25920 resistance zone. The lower wick is small, indicating limited defense near the 25700 base compared to the previous day, suggesting vulnerability.
🕯 Candle Type
Bearish Candle with Long Upper Wick (Strong Rejection) — Indicates distribution and sustained weakness toward support.
🛡 5 Min Intraday Chart
⚔️ Gladiator Strategy Update
ATR: 206.55
IB Range: 87.55 → Medium
Market Structure: Balanced
Trade Highlights:
11:38 Short Trade - Target Hit (R:R 1:1.83) (Trendline Breakdown, later on PDC + IBL breakdown)
Trade Summary: The strategy successfully captured the directional breakdown below the IB zone, capitalizing on the pressure sustained from the 25920 resistance failure. The profitable short trade aligned with the dominant bearish theme of the day.
🧱 Support & Resistance Levels
Resistance Zones:
25930 ~ 25920 (Immediate Polarity Flip Resistance)
25985
26030
Support Zones:
25740 ~ 25715 (Critical Immediate Base Support)
🧠 Final Thoughts
“The 25700 must hold.”
The close right on the 25740 ~ 25715 support zone makes tomorrow’s session crucial. If the market breaks the 25700 level and closes below it, a new downside zone will open.
Given the multiple downside hurdles (25985 and 25930), I will avoid aggressive short trades, but if quick contra trade opportunities arise, they will be attempted with utmost caution.
Keep in mind the 26220 Level for upside; if it’s breached and sustained, aggressive long positions should be favored.
✏️ Disclaimer
This is just my personal viewpoint. Always consult your financial advisor before taking any action.
Niftylevel

Nifty Analysis EOD – December 5, 2025 – Friday🟢 Nifty Analysis EOD – December 5, 2025 – Friday 🔴
Monetary Policy Boost: Bulls Secure Strong Close Above 26100 Targeted…!
🗞 Nifty Summary
The session began flat to positive, marking the day’s low early at 25,985. In anticipation of news, Nifty stayed range-bound within a tight 40-point range for the first hour. The announcement of the monetary policy rate cut acted as a strong catalyst, immediately triggering high volatility.
The index sharply broke the IBH and PDH, but the next candle was met with a 100-point rejection, trapping early breakout traders. After taking temporary support at the CPR Zone, Nifty resumed its upward conviction, systematically breaching 26132 and testing the Gap Zone.
Following a small consolidation near the Gap Zone (25-30 points), the final surge broke resistance again, taking Nifty to the 26200 level. The day closed at 26,186.45, adding +152.70 points (+0.59%).
This closing is significantly above the 26100 target expected yesterday, confirming powerful bullish control heading into the weekend.
🛡 5 Min Intraday Chart with Levels
🛡 Intraday Walk
The initial fakeout after the news announcement was crucial, shaking out weak hands before the real directional move began.
Once the market absorbed the volatility, the moves were aggressive and targeted. Nifty utilized CPR and 26132 as springboards, confirming that buyers viewed every dip as a buying opportunity in the post-policy environment.
The final close near the day’s high is a definitive technical signal that the strength has returned, and the index is ready to challenge higher structural levels next week.
📉 Daily Time Frame Chart with Intraday Levels
🕯 Daily Candle Breakdown
Open: 25,999.80
High: 26,202.60
Low: 25,985.35
Close: 26,186.45
Change: +152.70 (+0.59%)
🏗️ Structure Breakdown
Type: Strong Bullish candle (Near Marubozu)
Range (High–Low): ≈ 217 points — high volatility and wide trading range.
Body: ≈ 187 points — reflecting dominant upside momentum.
Upper Wick: ≈ 16 points — very limited rejection near highs.
Lower Wick: ≈ 14 points — buyers strongly defended the early weakness.
📚 Interpretation
This candle is a powerful confirmation of bullish conviction, showing decisive absorption of the early selling and continuous buying pressure throughout the session. The wide body and the close near the high signal that buyers are firmly in control. This structure strongly supports trend continuation and suggests that the recent indecision has been resolved in favor of the bulls.
🕯 Candle Type
Strong Bullish Marubozu-Style Candle — Represents decisive buying control and potential momentum continuation.
🛡 5 Min Intraday Chart
⚔️ Gladiator Strategy Update
ATR: 192.7
IB Range: 76.75 → Medium
Market Structure: Balanced
Trade Highlights:
10:16 Long Trade - SL Hit (IBH + PDH Breakout)
10:49 Long Trade - Target Hit (R:R 1:3.34) (IBH + PDH Breakout)
Trade Summary: The volatile, news-driven session initially led to a Stop Loss on the first breakout attempt. However, the strategy quickly adapted, capturing a high R:R profitable long trade on the confirmed directional breakout, successfully aligning with the strong bullish momentum post-monetary policy announcement.
🧱 Support & Resistance Levels
Resistance Zones:
26202 (PDH)
26220 ~ 26235
26277 (ATH)
Support Zones:
26155
26104 (Must Hold)
26070 ~ 26030
🧠 Final Thoughts
“The monetary policy provided the spark needed to re-engage the bull run.”
The successful close above 26132 is a game-changer. The immediate bias for Monday is strongly bullish. We must now watch the critical overhead resistance at 26220 ~ 26235.
A decisive breach here will immediately target the All-Time High at 26277. The 26104 level is the new line in the sand; as long as Nifty holds this support, the bullish momentum remains intact.
✏️ Disclaimer
This is just my personal viewpoint. Always consult your financial advisor before taking any action.

Nifty Analysis EOD – October 3, 2025 – Thursday🟢 Nifty Analysis EOD – October 3, 2025 – Thursday 🔴
Bulls stamp authority with a strong close near the highs
🗞 Nifty Summary
Nifty opened with a 67-point gap down at 24,785.70, and the first 5-min candle was wild, spanning 97 points. The initial upmove managed to fill the gap but couldn’t sustain above, slipping back quickly.
The IB Range (24,747.55 – 24,855.70) set the tone, and for most of the session (until 2:40 PM), the index swung wildly inside this wide band, offering multiple trade opportunities on both sides.
Around 2:10 PM, a trendline false breakdown (liquidity trap) shook out bears. Soon after, bulls reclaimed control, breaking the trendline, PDC, and PDH, and pushed the index to a new day high of 24,904.80. Nifty closed strong at 24,895, almost at the high, firmly above the previous day’s high.
The session was energetic for traders, packed with volatility and clean structure, and the close reinforced bullish continuation.
🛡 5 Min Intraday Chart with Levels
🛡 Intraday Walk
Gap down open at 24,785.70.
First 5-min candle = 97 points → extreme volatility.
IB Range set between 24,747 – 24,856, market chopped inside until 2:40 PM.
2:10 PM: False breakdown trap → liquidity grab.
Bulls took charge → breakout above IB, PDC, and PDH.
Day high: 24,904.80 → close: 24,895 (near highs).
📉 Daily Time Frame Chart with Intraday Levels
🕯 Daily Candle Breakdown
Open: 24,759.55
High: 24,904.80
Low: 24,747.55
Close: 24,894.25
Change: +57.95 (+0.23%)
🏗️ Structure Breakdown
Solid green body: ~134.7 pts.
Range: ~157.25 pts (moderate).
Very tiny upper/lower wicks.
📚 Interpretation
Flat-to-weak open, dip to 24,747, then steady climb.
Closing almost at the high = strong conviction.
Minimal rejection → clean bullish candle.
🕯Candle Type
Bullish Marubozu (near-perfect) → Buyers in full control.
Confirms continuation of bullish reversal from Oct 1st.
🛡 5 Min Intraday Chart
⚔️ Gladiator Strategy Update
ATR: 179.73
IB Range: 108.15 → Wide
Market Structure: Balanced
Trade Highlights
11:10 Long Trade – Target Achieved (R:R 1:2.08)
14:10 Short Trade – SL Hit
14:35 Long Trade – Target Achieved (R:R 1:3.96)
📌 What’s Next? / Bias Direction
Bias: Bullish continuation.
If bulls clear 25,000 with momentum, the next leg may unfold toward 25,115–25,250. Supports at 24,785–24,830 need to hold for trend continuity.
📌 Support & Resistance Levels
Resistance Zones:
24890 ~ 24915
24990 ~ 25000
25048
25085
25115
Support Zones:
24830
24785
24745
💡 Final Thoughts
“Markets often test patience with traps before rewarding conviction with momentum. Today’s close above PDH is a classic sign of strength.”
✏️ Disclaimer
This is just my personal viewpoint. Always consult your financial advisor before taking any action.

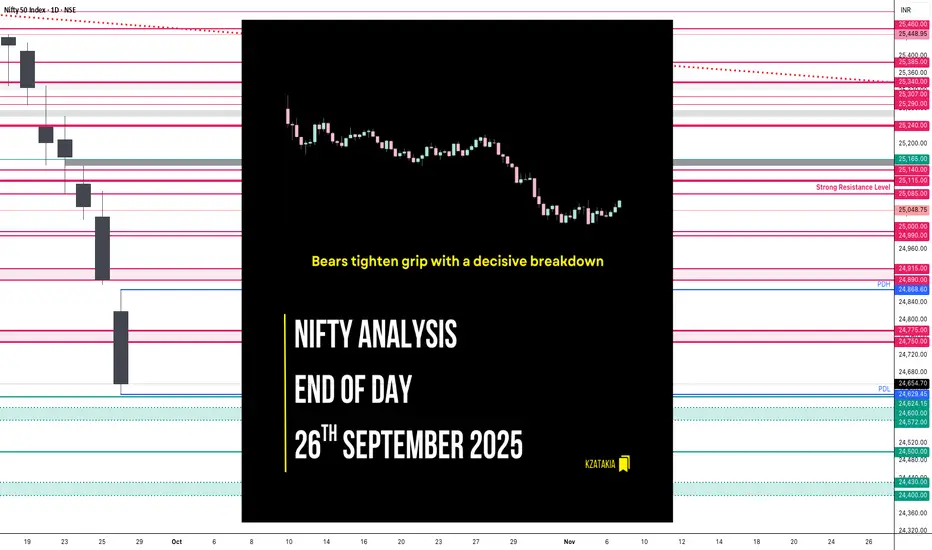
Nifty Analysis EOD – September 26, 2025 – Friday🟢 Nifty Analysis EOD – September 26, 2025 – Friday 🔴
Bears tighten grip with a decisive breakdown
🗞 Nifty Summary
Nifty opened with a Gap Down of 61 points, below the Previous Day Low, and made an initial attempt to recover but stretched only 25 points. From there, a strong selloff dragged it down 109 points from the day high, finding temporary support at the 24,775–24,750 zone.
Multiple attempts to hold this zone failed, and finally around 13:20, the level gave way, triggering a sharp fall of ~125 points to the day’s low at 24,629.50. The index closed weak at 24,673.10, just above the low.
Today’s 239.15-point range was significantly above the Gladiator Avg Range (175.68), highlighting heightened volatility. Importantly, Nifty tested key supports from 5th Sept and 1st Sept closes, while also closing below the 3rd Sept close.
This marks the 7th consecutive red candle session, with none crossing the previous day’s high or close — a clear sign of strong bearish dominance. If Monday breaks 24,430–24,400, the structure shifts from retracement to a new leg of breakdown.
🛡 5 Min Intraday Chart with Levels
🛡 Intraday Walk
Opened Gap Down 61 points below PDL.
Attempted to fill gap, capped at +25 points.
Fell further 109 points from high, tested 24,775–24,750 support zone.
Bears broke this zone at 13:20, sparking a 125-point sharp decline to 24,629.5.
Closed weak at 24,673.10, near the low.
📉 Daily Time Frame Chart with Intraday Levels
🕯 Daily Candle Breakdown
Open: 24,818.55
High: 24,868.60
Low: 24,629.45
Close: 24,654.70
Change: −236.15 (−0.95%)
🏗️ Structure Breakdown
Strong red candle (Close << Open).
Body: ~163.85 points → large bearish body.
Range: ~239.15 points → wide volatility.
Upper wick: ~50 points → firm rejection at 24,860 zone.
Lower wick: ~25 points → minor buying attempt.
Close near lows → clear bear dominance.
📚 Interpretation
Overnight sentiment carried into the gap down.
Bulls tried a mild recovery but failed at 24,868.
Bears controlled the day with a near Marubozu-like structure.
🕯Candle Type
Bearish Marubozu-like candle → decisive bearish continuation with minimal lower shadow.
🛡 5 Min Intraday Chart
⚔️ Gladiator Strategy Update
ATR: 175.68
IB Range: 125.10 → Wide
Market Structure: ImBalanced
Trade Highlights:
09:45 Short Trade – Target Achieved (R:R 1:2.15)
11:50 Long Attempt – SL Hit
13:25 Short Trade – Target Achieved (R:R 1:3.10)
📌 What’s Next? / Bias Direction
Resistance Zones: 24,750–24,775 · 24,868 · 24,890–24,915 · 24,990–25,000 · 25,048
Support Zones: 24,630–24,625 · 24,600–24,572 · 24,500 · 24,430–24,400
Bias stays bearish as long as Nifty trades below 24,860–25,000. A breakdown under 24,430–24,400 can extend the bearish trend toward deeper supports.
📌 Support & Resistance Levels
Resistance Zones:
24750 ~ 24775
24868
24890 ~ 24915
24990 ~ 25000
25048
Support Zones:
24630 ~ 24625
24600 ~ 24572
24500
24430 ~ 24400
💡 Final Thoughts
“Seven red candles in a row — when bears take the fort, the trend is their best ally. Until bulls reclaim higher ground, caution remains the winning trade.”
✏️ Disclaimer
This is just my personal viewpoint. Always consult your financial advisor before taking any action.
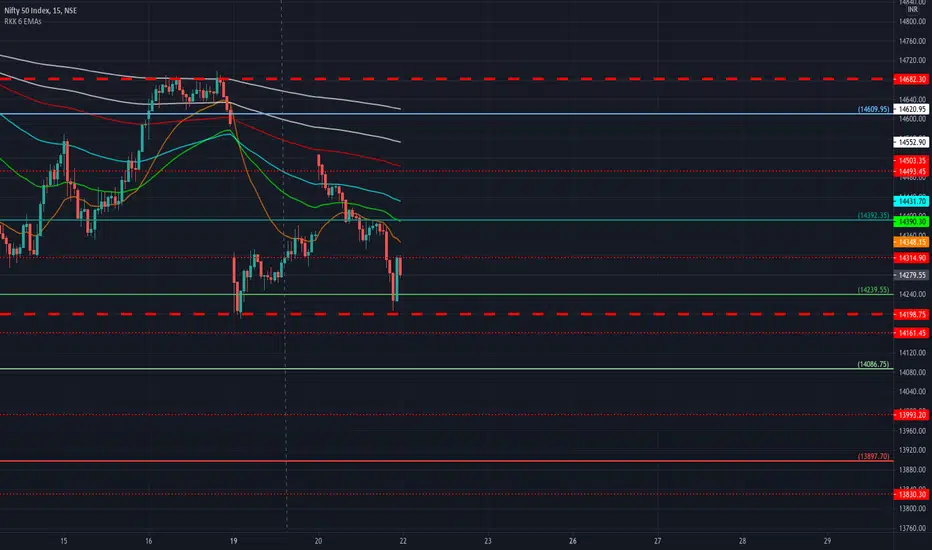
Nifty Analysis EOD – September 22, 2025 – Monday🟢 Nifty Analysis EOD – September 22, 2025 – Monday 🔴
Gap-Down, Whipsaw, and Late-Session Breakdown
🗞 Nifty Summary
Nifty opened with a 93-point gap down at 25,240, right at our support level, but slipped another 48 points to test 25,212, marking the day’s low. A sharp 120-point recovery followed, filling the gap within 35 minutes.
For most of the session, price action stayed muted in a 54-point range (25320–25267) near PDL and S1, reflecting indecision. However, the late second half brought a sharp sell-off as 25,240 broke, sending Nifty to test 25,165 before a minor bounce. The index closed at 25,202.35, just above the day’s low.
👉 Overall, the session was rough:
Morning = Bulls dominated with recovery.
Midday = Both sides in a stalemate.
Late = Bears seized control with a decisive breakdown.
🛡 5 Min Intraday Chart with Levels
📉 Daily Time Frame Chart with Intraday Levels
🕯 Daily Candle Breakdown
Open: 25,238.10
High: 25,331.70
Low: 25,151.05
Close: 25,202.35
Change: −124.70 (−0.49%)
🏗️ Structure Breakdown
Red candle (Close < Open).
Body: ~35.75 points (small vs. range).
Range: ~180.65 points (high intraday volatility).
Upper wick: ~93.60 points (rejection near 25,331).
Lower wick: ~51.30 points (buyers tried to defend near 25,150).
Closed near the day’s low → bears ended in control.
📚 Interpretation
Nifty tested 25,331 early but supply kicked in hard.
Selling dragged price to 25,151 before buyers attempted defense.
Recovery attempts failed near 25,200 → sellers controlled late trade.
🕯Candle Type
Resembles an Inverted Hammer / Shooting Star–like red candle, with strong upper rejection.
📉📈 Short-Term View – September 23, 2025
Resistance Zone: 25,320–25,350 (tested, rejected).
Support Zone: 25,150–25,200 (buyers active intraday, but weak close).
Break below 25,150 → could extend fall toward 25,050–25,000.
Upside strength only if 25,330+ is reclaimed.
📌 Conclusion: Recent sessions are showing distribution signs after a strong rally. Bulls are holding 25,150–25,200, but repeated failures near 25,330–25,450 hint at a short-term pullback unless reclaimed.
🛡 5 Min Intraday Chart
⚔️ Gladiator Strategy Update
ATR: 161.28
IB Range: 120.10 → Medium
Market Structure: Imbalanced
Trade Highlights:
11:15 Short Trade → ❌ SL Hit
13:20 Short Trade → ✅ Target Achieved (R:R = 1:2)
📌 Support & Resistance Levels
Resistance Zones:
25,240
25,290 ~ 25,307
25,340 ~ 25,385
25,425 ~ 25,460
Support Zones:
25,165 ~ 25,140
25,115
25,085
25,045
25,000 ~ 24,990
💡 Final Thoughts
The index danced in all directions today but closed with bears firmly ahead. Buyers are still defending 25,150–25,200, but cracks are visible.
👉 Watch 25,150 carefully — losing this could open the gates toward 25,000.
📖 “Markets don’t move in straight lines — they trap, test, and only then trend.”
✏️ Disclaimer
This is just my personal viewpoint. Always consult your financial advisor before taking any action.

Nifty Analysis EOD – September 19, 2025 – Friday🟢 Nifty Analysis EOD – September 19, 2025 – Friday 🔴
Flat Open, Sharp Fall, and a Range-Bound Trap
🗞 Nifty Summary
Gift Nifty hinted at a 50-point gap down, but Nifty opened nearly flat at 25,410. However, the bulls couldn’t hold, and within the first 45 minutes, the index slipped 132 points, breaking S1 and PDL to mark the day’s low at 25,297.
The rest of the day was stuck in a narrow 50-point band, with both sides witnessing fakeouts. The index finally closed exactly at S1 (25,352.5), about 66 points above the low.
The total range for the day stood at 142 points, and closing below previous day low showing weakness after yesterday’s sharp recovery attempt.
Yesterday’s note highlighted:
“The 100-point recovery was unexpected.”
— Today, that very recovery got completely wiped out in the early part of the session.
🗞 Last 3 Sessions breakdown
17th Sep 2025 → Open: 25,276.60 | Close: 25,330.25 | Change: +91.15 (+0.36%) → Bullish, small green candle
18th Sep 2025 → Open: 25,441.05 | Close: 25,423.60 | Change: +93.35 (+0.37%) → Bullish continuation, narrow range
19th Sep 2025 → Open: 25,410.20 | Close: 25,327.05 | Change: −96.55 (−0.38%) → Bearish, closes near 17th close
📌 Pattern Check:
The 3-session structure shows some similarity (~65%) with an Evening Star, but not a textbook one:
1st candle = Bullish
2nd candle = Strong bullish continuation (not a small-bodied star)
3rd candle = Bearish close near/below 17th session’s midpoint
👉 Interpretation:
This looks like a weak Evening Star variation, hinting at possible reversal.
For trading perspective, it’s more of a caution signal than a short trigger — confirmation from the next session’s candle is essential.
🛡 5 Min Intraday Chart with Levels
📉 Daily Time Frame Chart with Intraday Levels
🕯 Daily Candle Breakdown
Open: 25,410.20
High: 25,428.75
Low: 25,286.30
Close: 25,327.05
Change: −96.55 (−0.38%)
🏗️ Structure Breakdown
Red candle (Close < Open).
Body: ~83.15 points (moderate).
Upper wick: ~18.55 points.
Lower wick: ~40.75 points.
Closed closer to the low → Selling pressure throughout the session.
📚 Interpretation
Market opened flat but faced resistance near 25,428 (close to yesterday’s high).
Selling dragged it to 25,286, with only a mild recovery into the close.
Indicates a supply zone around 25,420–25,450.
🕯Candle Type
Bearish candle with a small lower wick.
Not a reversal by itself, but signals loss of momentum after prior strength.
📉📈 Short-Term View – September 22, 2025
Resistance: 25,420–25,450 remains strong.
Support: 25,285–25,300 (today’s low).
Breakdown below 25,240 → Downside may stretch to 25,200–25,140.
Bulls need to reclaim 25,400+ quickly to keep the uptrend alive.
🛡 5 Min Intraday Chart
⚔️ Gladiator Strategy Update
ATR: 159.12
IB Range: 114.45 → Wide
Market Structure: balanced
Trade Highlights:
11:45 Short Trade → SL Hit
📌 Support & Resistance Levels
Resistance Zones:
25,340 ~ 25,385
25,425 ~ 25,460
25,500 (Psychological Level)
25,535
Support Zones:
25,307
25,290
25,275 ~ 25,260
25,240
💡 Final Thoughts
The market delivered a sharp fall early, followed by a dull range-bound trap. The weak Evening Star variation hints that momentum is fading.
👉 Bulls must reclaim 25,400+, else a drift toward 25,200 cannot be ruled out.
📖 “Markets often whisper before they shout — today was one such whisper of caution.”
✏️ Disclaimer
This is just my personal viewpoint. Always consult your financial advisor before taking any action.

Nifty Analysis EOD – September 5, 2025 – Friday🟢 Nifty Analysis EOD – September 5, 2025 – Friday 🔴
Double Bottom at the Lows—Hope for Bulls or Just Another Trap?
🗞 Nifty Summary
Nifty opened with a 98-point gap-up at 24,825 but showed hesitation, spending the first 45 minutes stuck in the CPR zone within a narrow 60-point band. By 10 AM, the index slipped sharply—breaking both IB Low and BC level, and within minutes also pierced PDL, tumbling nearly 143 points. Support emerged at S1 (24,635), where the fall finally halted.
The index then spent over two hours base-building between PDL and S1, forming a double bottom (Adam–Eve) pattern. Once this base broke out above PDL, the index rallied quickly, meeting its upside target.
Structurally, the session shaped into a triple distribution day:
Early selling phase,
Midday consolidation,
Late recovery rally.
Intraday option traders found strong opportunities with fast 2x expansion off a small IB, but swing traders likely struggled with whipsaws.
Closing nearly flat at 24,741 (+6.7 pts) keeps the directional dilemma alive. Yesterday’s rejection repeated today—but the 125-point recovery off lows and close above PDL gives bulls a glimmer of hope.
🛡 5 Min Intraday Chart with Levels
📉 Daily Time Frame Chart with Intraday Levels
🕯 Daily Candle Breakdown
Open: 24,818.85
High: 24,832.35
Low: 24,621.60
Close: 24,741.00
Change: +6.70 (+0.03%)
🏗️ Structure Breakdown
Red candle (Close < Open), but still slightly positive vs. previous day.
Body: 77.85 pts → small bearish body.
Upper wick: 13.50 pts → negligible.
Lower wick: 119.40 pts → long tail.
🕯Candle Type
Hammer / Pin Bar → indicates potential reversal with bullish undertone.
📚 Interpretation
Market slipped nearly 200 pts intraday but bounced back strongly.
Long downside tail reflects demand defense at 24,620–24,635 zone.
Despite red body, price action leans neutral-to-bullish.
🔍 Short-Term View – September 8, 2025
Support: 24,620 (defended low).
Resistance: 24,830–24,980 (recent rejection zone).
👉 Bias Direction:
> If 24,620 breaks, weakness could extend to 24,450.
> If 24,830 sustains, bulls may regain the upper hand.
🛡 5 Min Intraday Chart
⚔️ Gladiator Strategy Update
ATR: 211.61
IB Range: 59.7 → Small
Market Structure: Balanced
Trade Highlights:
1) 10:00 AM – Short Trigger → Target Hit (R:R = 1:3.64)
📌 Support & Resistance Levels
Resistance Zones:
24,785
24,835 ~ 24,845
24,895 ~ 24,910
24,975 ~ 25,004
Support Zones:
24,685
24,657
24,630 ~ 24,620
24,540 ~ 24,525
💡 Final Thoughts
Today’s Hammer at the lows signals that buyers are quietly absorbing supply. But conviction remains missing—two back-to-back sessions show indecision at higher levels. Until either 24,620 breaks or 24,830 is sustained, expect choppy action favoring intraday trades over positional setups.
📖 “Reversals don’t start with noise—they begin with defense at key levels.”
✏️ Disclaimer
This is just my personal viewpoint. Always consult your financial advisor before taking any action.

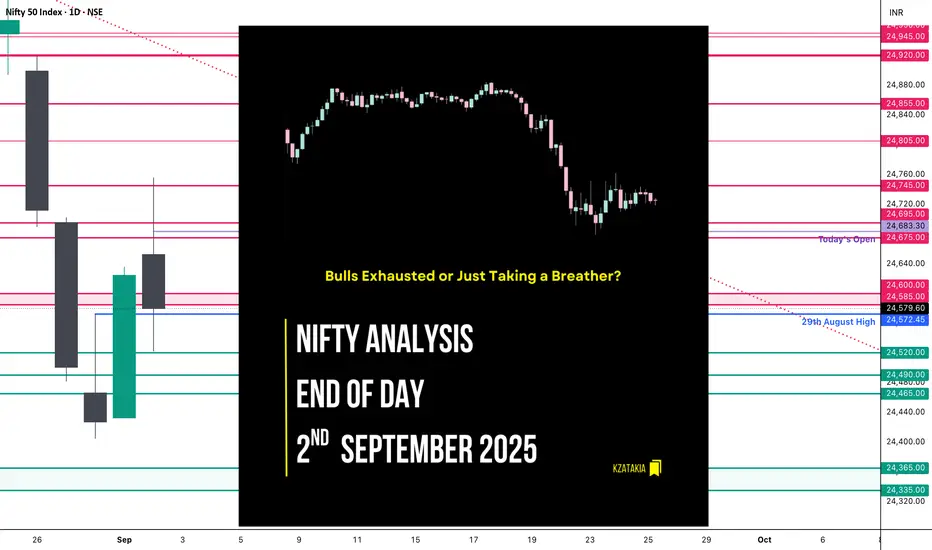
Nifty Analysis EOD – September 2, 2025 – Tuesday🟢 Nifty Analysis EOD – September 2, 2025 – Tuesday 🔴
Bulls Exhausted or Just Taking a Breather?
🗞 Nifty Summary
Nifty opened with a 62-point gap-up above the previous day’s high, but the excitement didn’t last long. The index quickly rushed to fill the gap, pulled back, and initially tried to extend the bullish sentiment from yesterday. However, the 24,750 hurdle proved too strong.
After multiple failed attempts to break above it, Nifty slipped below key supports — mean, CDL, PDH, PDC, and the 24,600–24,585 support zone — finally taking a pause around 24,520.
The big question: Was this just a weekly expiry adjustment or early signs of bullish momentum exhaustion?
For the upcoming sessions, the critical range is 24,750 ~ 24,500.
🛡 5 Min Intraday Chart with Levels
📉 Daily Time Frame Chart with Intraday Levels
🕯️ Daily Candle Breakdown
Open: 24,653.00
High: 24,756.10
Low: 24,522.35
Close: 24,579.60
Change: −45.45 (−0.18%)
🏗️ Structure Breakdown
Red candle (Close < Open).
Body: 73.40 points → moderate.
Upper wick: 103.10 points (strong rejection near high).
Lower wick: 57.25 points (buyers attempted defense).
This created a long upper wick → intraday bullish attempt got rejected.
🕯Candle Type
Shooting Star–like red candle → reflects bullish exhaustion and supply pressure.
📚 Interpretation
Gap-up open above previous close (24,625 → 24,653).
Bulls attempted to break 24,750, but failed multiple times.
Sellers dominated late, dragging the index red.
Strong rejection shows supply pressure near 24,750.
📉 Short-Term View
Resistance: 24,750 (rejection zone).
Support: 24,520 (today’s low).
Context: Yesterday’s bullish Marubozu was negated by today’s failure.
👉 If bulls reclaim 24,750+, momentum revives.
👉 If 24,520 breaks, sellers may gain the upper hand.
In short: Market is in a tug-of-war zone between 24,750 and 24,520.
🛡 5 Min Intraday Chart
⚔️ Gladiator Strategy Update
ATR: 205.07
IB Range: 98.85 → Medium
Market Structure: Balanced
Trade Highlight:
13:50 Short Trigger → Target Hit (R:R = 1:1.5)
📌 Support & Resistance Levels
Resistance Zones:
24,675 ~ 24,695
24,745
24,805
24,855
Support Zones:
24,575
24,520
24,490 ~ 24,465
💭 Final Thoughts
The index showed signs of exhaustion near 24,750. Whether this is just expiry-related or a genuine pause in momentum, tomorrow’s action will confirm.
"Markets don’t lie, they whisper. Today’s rejection was one such whisper — respect it."
✏️ Disclaimer
This is just my personal viewpoint. Always consult your financial advisor before taking any action.
Nifty Analysis EOD – August 28, 2025 – Thursday🟢 Nifty Analysis EOD – August 28, 2025 – Thursday 🔴
Bulls Tried, But Bears Closed the Table
🗞 Nifty Summary 🗞
Nifty started almost flat but below the prior low, and selling pressure hit from the first tick — falling 195 points in just 10 minutes to mark the day low at 24,507. Support came in, leading to a 170-point recovery, almost touching the day high near 24,675–24,695, but the support zone flipped into resistance. A sharp rejection dragged the index back to the lows, even breaching them to mark a new day low at 24,481.60.
By the close, a mild 50-point recovery couldn’t change the tone, with Nifty finishing at 24,533.10, down −211.15 points (−0.85%).
Over the last 5 sessions, Nifty has lost 672 points, slipping below the Fib 0.786 retracement of the recent swing high-low range.
🛡 5 Min Intraday Chart with Levels
📊 Intraday Walk
Gap-down, immediate 195-point fall to 24,507.
Bulls attempt recovery, index climbs 170 points.
Faces rejection at 24,675–24,695, prior support turned resistance.
Sellers regain control, Nifty revisits lows.
Breach of earlier low, new low at 24,481.60.
Small 50-point bounce, closes weak at 24,533.10.
📉 Daily Time Frame Chart with Intraday Levels
🕯 Daily Candle Breakdown
Open: 24,695.80
High: 24,702.65
Low: 24,481.60
Close: 24,500.90
Change: −211.15 (−0.85%)
🏗️ Structure Breakdown
Candle: Red (Close < Open)
Body: 194.90 points (large bearish body)
Upper wick: ~7 points → no strength above open
Lower wick: ~19 points → weak recovery attempt
📚 Interpretation
Gap-down open, below PDL.
Buyers failed to sustain upside; day’s high just 7 points above open.
Persistent selling throughout, only a minor bounce at close.
Another strong bearish candle, very similar to yesterday’s.
🕯Candle Type
Bearish Marubozu–style (big red body, tiny wicks).
Signifies trend-confirming, decisive selling pressure.
🔎 Short-Term View
Support: 24,480–24,450 (tested today). Break → 24,365–24,335.
Resistance: 24,695–24,720 (gap-down + rejection zone).
📌 The market is clearly moving in phases:
21st → Pause and alert
22nd → trend reversal confirmation
25th → pullback rejection
26th → confirmation
28th → bearish extension
Bulls must defend 24,350 to prevent a deeper correction.
🛡 5 Min Intraday Chart
⚔️ Gladiator Strategy Update
ATR: 204.83
IB Range: 195.45 → Medium
Market Structure: ImBalanced
Trade Highlights
9:45 AM – Long Trigger → Target achieved (R:R 1:1.5)
12:55 PM – Short Trigger → Target achieved (R:R 1:1.5)
📌 Support & Resistance Levels
Resistance Zones:
24,585 ~ 24,600
24,675 ~ 24,695
24,745
Support Zones:
24,665 ~ 24,650
24,365 ~ 24,335
🏹 Final Thoughts
“Markets don’t lie. When a support flips to resistance, the message is loud and clear — respect the structure.”
✏️ Disclaimer ✏️
This is just my personal viewpoint. Always consult your financial advisor before taking any action.

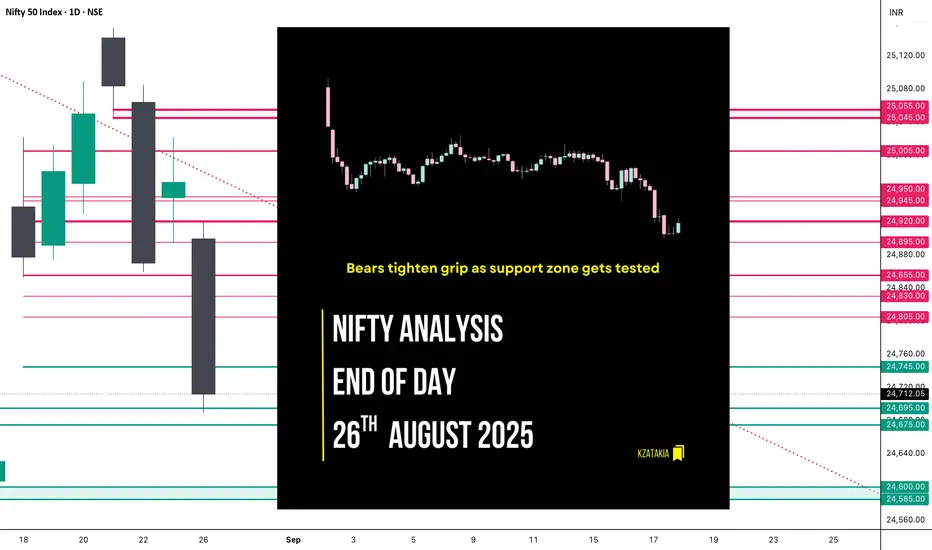
Nifty Analysis EOD – August 26, 2025 – Tuesday🟢 Nifty Analysis EOD – August 26, 2025 – Tuesday 🔴
Bears tighten grip as support zone gets tested
📰 Nifty Summary
Nifty opened with a 72-point gap-down and extended the fall by more than 150 points, finding support at 24,755.
Despite a few recovery attempts, the index mostly hovered around VWAP. Around 3 PM, Nifty broke the day’s low to hit 24,689.60 before a minor 21-point bounce, finally closing at 24,710.70.
Monday’s upmove proved to be just a dead-cat bounce of Friday’s fall. After forming an Inside Bar on the daily chart, today’s breakdown extended the weakness. Now, holding the 24,585–24,600 zone will be crucial for any base-building attempts.
🛡 5 Min Intraday Chart with Levels
📊 Intraday Walk
Opened with a 72-point gap-down.
Sharp selling → tested 24,755 support.
Multiple recovery attempts, stuck around VWAP.
3 PM breakdown → new day low at 24,689.60.
Closed weak at 24,710.70, right at support.
📉 Daily Time Frame Chart with Intraday Levels
🕯 Daily Candle Breakdown
Open: 24,899.50
High: 24,919.65
Low: 24,689.60
Close: 24,712.05
Change: −255.70 (−1.02%)
🏗️ Structure Breakdown
Strong red candle (Close < Open).
Body: 187.45 points → decisive selling.
Upper wick: 20 points → no buying strength.
Lower wick: 22 points → negligible bounce.
📚 Interpretation
Market opened lower, weak recovery above 24,919.
Continuous selling dragged it near the day’s low.
Confirms bearish follow-through after rejection at 25,000 on Aug 22.
Candle type:
Bearish Marubozu-like, signaling bear dominance.
🛡 5 Min Intraday Chart
⚔️ Gladiator Strategy Update
ATR: 201.98
IB Range: 164.05 → Medium
Market Structure: ImBalanced
Trade Highlights: No trade triggered by the system
today.
📌 Support & Resistance Levels
Resistance Zones:
24,805 ~ 24,830
24,855
24,895
24,920
24,945 ~ 24,950
Support Zones:
24,695 ~ 24,675
24,600 ~ 24,585
🔮 What’s Next?
Short-term resistance now sits at 24,920, acting as a ceiling.
Support lies at 24,695–24,675, already tested today.
If broken, the next key zone is 24,585–24,600, crucial for base-building.
Trend clearly shifted from buying fatigue → decisive selling.
💭 Final Thoughts
“Markets don’t reverse on hope, they reverse on structure.”
With today’s close hugging the support zone, the next few sessions will decide if Nifty can stabilize—or if bears extend their grip further.
✏️ Disclaimer
This is just my personal viewpoint. Always consult your financial advisor before taking any action.
Nifty Analysis EOD – August 22, 2025 – Friday🟢 Nifty Analysis EOD – August 22, 2025 – Friday 🔴
Bears finally break the wall — wiping out 4 sessions’ gains
🗞 Nifty Summary
Yesterday, we noted:
“Though the close is higher by +33 points vs the previous day, it left behind a red daily candle (close < open). This indicates fading bullish momentum, even though HH-HL structure is still intact. The range was narrow (≈98 points), categorising the day as range-bound, not sideways. The previous weekly expiry was also narrow yet sideways.”
That caution proved valid today. Right from the opening candle, Nifty broke the PDL + S1 zone, invalidating the HH-HL structure and giving bears a clean entry. The past two sessions’ range contraction added fuel to the breakdown, resulting in a 225-point fall.
The attempted defense at 24,995, 24,955, 24,920, and 24,890 provided only temporary halts, but the downside momentum was too strong. The day ended at 24,869.45, erasing gains of the last 4 sessions.
On the weekly chart, the index now resembles a bearish pin bar / inverted hammer, a sign of exhaustion at the top.
📌 For Monday:
If Nifty fails to hold 24,850–24,820, then 24,745 and 24,650 come into play.
Bulls must reclaim and close above 24,955 to hold their fort.
🛡 5 Min Intraday Chart with Levels
📌 Intraday Walk
Opened at 25,064.15 with mild optimism.
First 1-min candle → broke PDL + S1 decisively → bears in control.
Gradual fall → temporary fights at 24,995 → 24,955 → 24,920 → 24,890, but all failed.
Closing print at 24,870.10, almost at the day’s low.
📉 Daily Time Frame Chart with Intraday Levels
🕯 Daily Candle Breakdown
Open: 25,064.15
High: 25,084.85
Low: 24,859.15
Close: 24,870.10
Change: −213.65 (−0.85%)
🏗️ Structure Breakdown
Strong red candle (Close < Open)
Body: 194.05 points
Upper wick: 20.70 points
Lower wick: 10.95 points
Full-body bearish bar → strong downside momentum
📚 Interpretation
Sellers seized control after three days of stalling at 25,150–25,180.
Break below 25,000 confirms supply dominance.
Closing near day’s low = no recovery attempt → decisive distribution.
🕯️Candle Type
Bearish Marubozu-style → clear trend shift to sellers.
🛡 5 Min Intraday Chart
⚔️ Gladiator Strategy Update
ATR: 198.19
IB Range: 134.25 → Medium
Market Structure: ImBalanced
Trade Highlight:
9:20 → Short Trigger → Target Achieved (R:R = 1:2).
🕵️Range & Bias
Support zone: 24,850–24,820
Resistance zone: 25,000–25,080
Bias: Bearish momentum → “Sell on rise” until 25k is reclaimed.
📌 Support & Resistance Levels
🎚️ Resistance Zones
24,920
24,955
24,995 ~ 25,005
25,080 ~ 25,090
🎚️ Support Zones
24,850 ~ 24,820
24,770
24,745
24,695 ~ 24,675
💡 Final Thoughts
The market has shifted gears from cautious bullish to outright bearish, with 25,000 now acting as a supply zone. Unless bulls reclaim lost ground above 24,955–25,000, the slide toward 24,745–24,650 seems inevitable.
“Markets climb the stairs but take the elevator down — today, the elevator arrived.”
✏️ Disclaimer
This is my personal analysis — not investment advice. Please consult your financial advisor before trading.

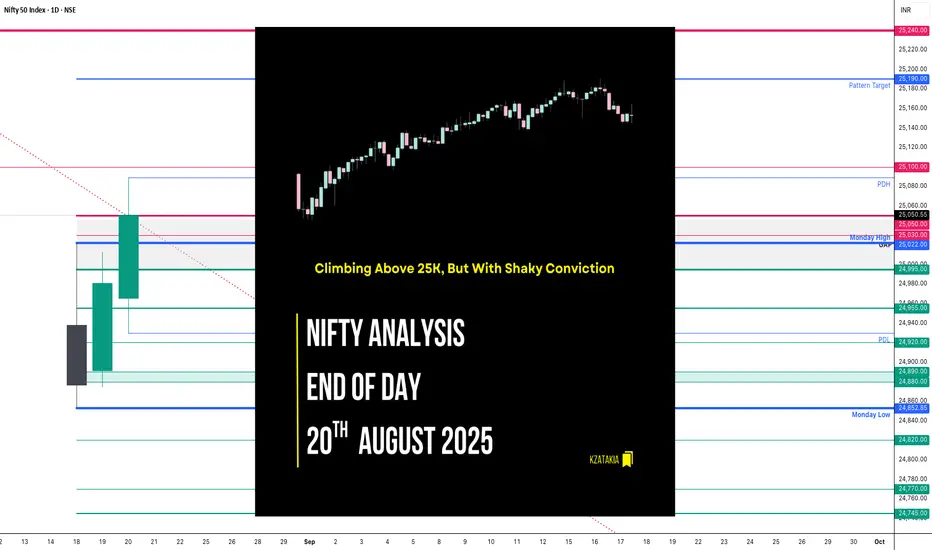
Nifty Analysis EOD – August 20, 2025 – Wednesday🟢 Nifty Analysis EOD – August 20, 2025 – Wednesday 🔴
Climbing Above 25K, But With Shaky Conviction
🗞 Nifty Summary
Nifty opened flat but slipped 50+ points in the opening minutes, sliding below the CPR zone to mark the day’s low at 24,929.70.
A sharp recovery followed — breaking the day’s high and reaching PDC (Previous Day Close) — only to get rejected and pulled back toward the CPR BC.
This 60-point rollercoaster played out within just 30 minutes, setting a volatile tone.
Later, after crossing 24,995, the index faced resistance at 25,020–25,030. Gradual progress pushed Nifty to 25,063, where it hit a trendline hurdle. Despite multiple attempts, it couldn’t hold convincingly above it, and the day ended at 25,050.55 — marginally positive (+ 70 points), but with effort showing fatigue.
👉 Intraday action tells the story: every breakout lacked conviction, with sharp throwbacks. While Nifty somehow managed to hold above 25k, Bank Nifty stayed weak, stuck near VWAP and below CPR (negative bias).
With weekly expiry tomorrow, sustainability above 24,990–25,030 and breakout PDH in the first half could trigger a short-covering rally targeting 25,190–25,240.
🛡 5 Min Intraday Chart with Levels
📊 Intraday Walk
🔻 Early dip → Below CPR, day low at 24,929.70.
🔼 Quick rebound → Tested PDC, rejection pulled back to CPR BC.
⚔️ 60-point whipsaws within first 30 mins = High volatility.
🔼 Crossed 24,995 → Resistance at 25,020–25,030 zone.
🚧 Stalled at 25,063 → Trendline resistance.
📉 Multiple failed breakouts, sharp pullbacks.
✅ Closed 25,050.55, above 25k but not convincing.
📉 Daily Time Frame Chart with Intraday Levels
🕯 Daily Candle Breakdown
Open: 24,965.80
High: 25,088.70
Low: 24,929.70
Close: 25,050.55
Change: +69.90 (+0.28%)
🏗️ Structure Breakdown
Green Candle (Close > Open).
Body: 84.75 points
Upper Wick: 38.15 points
Lower Wick: 36.10 points
Balanced wicks → Intraday tug-of-war.
📚 Interpretation
Buyers managed another close above 25,000.
Supply zone still active near 25,080–25,100 → sellers capping the rally.
Despite intraday volatility, close above open = continuation of bullish structure.
Candle suggests testing phase at 25k, not yet a clean breakout.
🕯️ Candle Type
A Spinning Top (bullish tilt) → indecision with buyers slightly ahead.
🛡 5 Min Intraday Chart
⚔️ Gladiator Strategy Update
ATR: 205.36
IB Range: 61.95 → Small
Market Structure: Balanced
Trade Highlight:
⏰ 10:10 AM → Long Trigger → Target Hit (R:R = 1:2)
🕵️ Range & Bias
Support Zone: 24,920 – 24,890
Resistance Zone: 25,090 – 25,100
Bias: Cautiously Bullish → Above 25k, but conviction lacking.
📌 Support & Resistance Levels
🎚️ Resistance Zones
25,030 – 25,050
25,100
25,190
25,240
🎚️ Support Zones
24,995
24,955
24,920
24,890 – 24,880
💡 Final Thoughts
Nifty is grinding higher, but intraday volatility and failed follow-throughs highlight lack of conviction. For expiry, the 25,100 ceiling is crucial. A sustained move above could trigger short-covering firepower, while below 24,930, the downside gap-filling risk reopens.
"Levels hold the key — conviction comes only when price sustains beyond them."
✏️ Disclaimer
This is my personal analysis — not investment advice. Please consult your financial advisor before trading.
#NIFTY Intraday Support and Resistance Levels -22/03/2024Nifty will be gap up opening in today's session. After opening nifty sustain above 22030 level and then possible upside rally up to 22150 level in today's session. in case nifty trades below 21990 level then the downside target can go up to the 21870 level.

#NIFTY Intraday Support and Resistance Levels -20/02/2024Nifty will be gap down opening in today's session. After opening nifty start trading below 22090 level and then possible downside rally up to 21970 in today's session. in case nifty trades above 22130 level then the upside target can go up to the 22250 level.

NIFTY Intraday Levels 30 June 2023HI,
Here is intraday support resistance levels of NSE:NIFTY for 30th June 2023. You can plan your trade according to breakdown or breakout. Thanks.

NIFTY |BANKNIFTY|NIFTYANALYSIS | BANKNIFTYANALYSIS FOR WEDNESDAYNIFTY |BANKNIFTY|NIFTYANALYSIS | BANKNIFTYANALYSIS FOR WEDNESDAY
| nifty analysis for tomorrow | #niftypredictions | nifty live trading |Nifty50
BANKNIFTY:-
If Banknifty sustain the level of 44400 and spend time and break 44500, then 44550-44600-44650
If Banknifty break down 44400 spend time below it and break 44300 then 44200-44100-44000
NIFTY:-
If Nifty sustain the level of 18600 and spend time and break 18625, then 18650-18675-18700
If Nifty break down of 18600 spend time and break down 18575, then Nifty 18550-18525.
This video is for educational purpose and my personal view . We are NOT SEBI registered Advisor, we only give the level on our practical trading experience. Kindly take the trade according to your risk and reward position and consulting your advisor.
#stockmarkets
#nifty
#MondayMarketPrediction
#nifty50
#nfityoutlookfornextweek
#bankniftyoutlookfornext week
#niftyoutlookformonday
#bankniftyoutlookformonday
#niftyforecast
#bankniftyforecast
#niftyshareprice
#bankniftyshareprice
#tommorrowniftyprediction
#tommorrobankniftypredicton
#niftytargettommrrow
#bankniftytargettommrrow
#31may nifty
#31may banknifty
#31may marketanalysis
#bankniftylive
#banknifty
#bankniftyoptions
#bankniftystrategies
#bankniftyfuture
#bankniftyoptionstrategy
#bankniftycalls
#bankniftyintraday
#bankniftylivetrading
#bankniftyweeklyexpiry
#bankniftycrash
#bankniftytomorrow
#bankniftypredictions
#bankniftychart
#bankniftytips
#bankniftypremium
#bankniftyoptions
#bankniftyfuture
#bankniftytomorrowprediction
#bankniftyoption

Nifty Level 15 Feb 2022 Nifty Level -------------------------------------------------------------------------------------- NSE:NIFTY

Bank Nifty Level 15 fEB 2022 Bank Nifty Level ------------------------------------------------------------------------------------------- NSE:BANKNIFTY

Nifty Futures Key Trading levels for 11th Oct 2021
Nifty Futures Key Trading levels for 11th Oct 2021
Disclaimer: These levels are purely based on Price action/demand and supply zones & and consumed only for educational purpose & should not be taken as buy/sell recommendation. I will not be responsible for any loss/profit incurred if anyone takes trades based on my views. Please consult your Financial Advisor before making any trading decision.
Leave a comment that is helpful or encouraging. Let's master the markets together.

Nifty Buy Sell Zones for AugustNifty Buy Sell Zones for August 2021. Enter on own risk. Let 15 Min candles close, enter only when the high of that candle is broken.