Nifty levels - Jan 22, 2026Nifty support and resistance levels are valuable tools for making informed trading decisions, specifically when combined with the analysis of 5-minute timeframe candlesticks and VWAP. By closely monitoring these levels and observing the price movements within this timeframe, traders can enhance the accuracy of their entry and exit points. It is important to bear in mind that support and resistance levels are not fixed, and they can change over time as market conditions evolve.
The dashed lines on the chart indicate the reaction levels, serving as additional points of significance to consider. Furthermore, take note of the response at the levels of the High, Low, and Close values from the day prior.
We hope you find this information beneficial in your trading endeavors.
* If you found the idea appealing, kindly tap the Boost icon located below the chart. We encourage you to share your thoughts and comments regarding it.
Wishing you success in your trading activities!
Niftylevels

Nifty Analysis EOD – January 20, 2026 – Tuesday🟢 Nifty Analysis EOD – January 20, 2026 – Tuesday 🔴
100-Day Low Breach: Nifty Panics as 25,500 Support Crumbles.
🗞 Nifty Summary
The Nifty opened with a misleading 30-point Gap Up, but the bullish sentiment was vaporized within the first minute.
Mirroring yesterday’s bearish intent, the index slipped 150 points from the first tick. While bulls attempted to form a base around 25,435, the 25,500 level acted as a massive supply barrier, repelling every recovery attempt.
The subsequent breach of the November 7, 2025, swing low triggered a wave of panic selling that no support level could arrest. Nifty plummeted to test 25,180, marking a deep low of 25,171.35. Closing at 25,232.50, the index has recorded its lowest close in the last 100 days, losing -353.00 points (-1.38%).
The primary catalyst for this carnage was a classic structural failure; once key supports were breached, the vacuum created led to a complete “washout” of long positions.
🛡 5 Min Intraday Chart with Levels
🛡 Intraday Walk
The day was a masterclass in “Momentum Expansion.” The initial gap-up was a clear trap, and the 150-point slide set a grim tone for the session.
The mid-day attempt to hold 25,435 was crushed by the overhead supply at 25,500. As soon as the “Line in the Sand” from November ‘25 was crossed, the algorithmic selling took over.
The index is now trading at the bottom band of the channel on the Daily Time Frame. After such a massive 414-point range expansion, the market is severely stretched, suggesting that while the bias is bearish, a “dead cat bounce” or a narrow consolidation phase is likely in the upcoming session.
📉 Daily Time Frame Chart with Intraday Levels
🕯 Daily Candle Breakdown
Open: 25,580.30
High: 25,585.00
Low: 25,171.35
Close: 25,232.50
Change: −353.00 (−1.38%)
🏗️ Structure Breakdown
Type: Strong Bearish Momentum candle.
Range: ≈ 414 points — Very high volatility; major range expansion.
Body: ≈ 348 points — Aggressive selling with almost no intraday recovery.
Upper Wick: ≈ 5 points — Total lack of buying interest at the open.
Lower Wick: ≈ 61 points — Late short-covering from the extreme lows.
📚 Interpretation
The candle structure represents a complete breakdown of market confidence. Opening at the high and closing near the low (despite a minor bounce) confirms that the bears are in absolute control. The breach of the 100-day closing low and the November swing low confirms that the medium-term structure has turned bearish. Distribution is at its peak.
🕯 Candle Type
Strong Bearish Momentum Candle — Indicates decisive selling dominance. This is a “breakout” candle from a larger structural range; typically leads to further downside unless a sharp reversal occurs.
🛡 5 Min Intraday Chart
⚔️ Gladiator Strategy Update
ATR: 230.62
IB Range: 150.40 → Big
Market Structure: ImBalanced
Trade Highlights:
12:41 Short Trade: Target Hit (R:R 1:6.76)
Trade Summary: The setup was a textbook “Narrow CPR” play. Despite the Big IB, the combination of an Important Level Breakout and extreme bearish sentiment supported a high-conviction trade. The sustained fall allowed the strategy to capture a massive 1:6.76 R:R, effectively leveraging the panic selling.
🧱 Support & Resistance Levels
Resistance Zones:
25380
25430
25480 ~ 25495
25550
25605
Support Zones:
25270
25180 ~ 25145
25060
25000 ~ 24970
🧠 Final Thoughts
“Panic is the harvest of broken levels.”
The Nifty has reached the bottom of its daily channel, and the RSI is likely approaching oversold territory.
For tomorrow, expect a decrease in volatility with a smaller range movement. We might see 25,060 act as a temporary floor, or potentially triggering a “dead cat bounce” back toward the 25,380 resistance.
Regardless of the bias, we will wait for the Initial Balance (IB) to form before committing to any intraday actions. The strategy is to respect the trend but be wary of a sharp, low-volume bounce from the channel extremes.
✏️ Disclaimer
This is just my personal viewpoint. Always consult your financial advisor before taking any action.

Happy Diwali 2026! Nifty @ 28000Nifty is Currently at 25232 as on today ie 29th Jan 2026
I see Nifty to go further low till 24500 - 24800 and find it support there before Budget
after Budget it should start a new journey and if it this time breaks the resistance of 26250 - 26500 then it should be near 28000 on around 6th Nov 2026 which is Diwali 2026!
How can i see this?
1. Before Budget IV is to go up and the best way for IV to increase is Market to fall which is happening
2. FII are net sellers since last 1 year now, They have invested heavily in Gold, Silver, Dolor, US, China ect ect.
3. its time for FII honeymoon to get over with silver and gold so they should start coming back
4. Budget is going to be good as planning is for exception of income tax from 12Lac - 17lac and if it is closed @ 15 lac it also should be a good factor
5. if we see technically, we can find the monthly EMA 20 @ 24500 and also there is a monthly demand zone there. If we can see a Parallel upward channel it also indicate for nifty to reach 28000 and then 30000
6. on monthly time frame there is a very nice breakout expected @ 26250 - 26500 which is in formation since sept 2024 its like a cup and handle pattern.
so, I am going to wait and let Nifty take a Support @ 24500 - 24800 and then once i get a buliish signal on 75min time frame I will go long with nifty till 28000 with Hedges on and off
Happy Diwali 2026! (Nifty @ 28000_

Nifty levels - Jan 21, 2026Nifty support and resistance levels are valuable tools for making informed trading decisions, specifically when combined with the analysis of 5-minute timeframe candlesticks and VWAP. By closely monitoring these levels and observing the price movements within this timeframe, traders can enhance the accuracy of their entry and exit points. It is important to bear in mind that support and resistance levels are not fixed, and they can change over time as market conditions evolve.
The dashed lines on the chart indicate the reaction levels, serving as additional points of significance to consider. Furthermore, take note of the response at the levels of the High, Low, and Close values from the day prior.
We hope you find this information beneficial in your trading endeavors.
* If you found the idea appealing, kindly tap the Boost icon located below the chart. We encourage you to share your thoughts and comments regarding it.
Wishing you success in your trading activities!

BTR LIVE TRADE SETUP | BSE LTD | 20 JAN 2026📈 BTR LIVE TRADE SETUP | BSE LTD | 20 JAN 2026
BTR Price Action Indicator triggered a clean BUY signal on BSE LTD 🔥
This is a live market setup, not a post-market update.
🔹 Buy Entry: 2705
🎯 Target 1 (Intraday): 2743
🎯 Target 2 (Swing): 2794
⏰ Intraday Exit Time: 3:20 PM (if targets not achieved)
📌 Intraday traders: Book profits at T1 or time-based exit
📌 Swing traders: Hold for Target 2 with BTR discipline
No prediction.
No emotion.
Just pure price action + BTR structure.
If you are confused → don’t trade.
If you trust rules → follow BTR.
📊 Instrument: BSE LTD
🧠 Indicator Used: BTR Price Action
⚡ Mode: Live Trading Setup
NSE:BSE

Nifty Analysis EOD – January 20, 2026 – Tuesday🟢 Nifty Analysis EOD – January 20, 2026 – Tuesday 🔴
25K Revival: Nifty’s Epic 380-Point V-Shape Recovery!
🗞 Nifty Summary
The Nifty delivered a session of extreme theater, starting with an 80-point Gap Down at the 25145 support. After a failed 5-minute attempt to reclaim 25270, the index collapsed, slicing through the PDL and the 25060 support.
Panic intensified as the psychological 25,000 mark was breached, leading to a deep low of 24,919.80. However, the bottom band of the daily channel acted as a trampoline, triggering a spectacular 380-point V-shaped recovery back to the day’s highs.
The 25270 level proved to be a stubborn ceiling once more, pushing the index back down by 180 points.
Nifty eventually closed at 25,157.50, essentially flat relative to the open, but having survived a near-catastrophic breakdown.
🛡 5 Min Intraday Chart with Levels
🛡 Intraday Walk
The day was a masterclass in volatility. The morning breakdown below 25,060 was a high-conviction bearish move that targeted the 24970 zone.
Once the “final flush” hit 24920, the vacuum created by exhausted sellers allowed for an aggressive short-covering rally.
This 380-point bounce was one of the sharpest in recent history, though the secondary rejection at 25270 confirms that supply remains heavy on every significant rise.
The market is now in a state of high-tension equilibrium at the channel’s edge.
📉 Daily Time Frame Chart with Intraday Levels
🕯 Daily Candle Breakdown
Open: 25,141.00
High: 25,300.95
Low: 24,919.80
Close: 25,157.50
Change: −75.00 (−0.30%)
🏗️ Structure Breakdown
Type: Long-Legged Doji.
Range: ≈ 381 points — Extreme intraday volatility.
Body: ≈ 17 points — Negligible real body, signaling total indecision.
Upper Wick: ≈ 143 points — Massive rejection from the 25,300 supply zone.
Lower Wick: ≈ 221 points — Aggressive, institutional-grade defense of the channel bottom.
📚 Interpretation
A Long-Legged Doji forming at the bottom band of a channel is a textbook reversal signal. It indicates that while bears had the power to break 25,000, they lacked the conviction to stay there.
However, the equal power of the rejection from the top suggests that the bulls are not out of the woods yet. This structure marks a transition from a trending environment to a high-volatility “battle zone.”
🕯 Candle Type
High-Volatility Indecision (Long-Legged Doji) — Indicates a potential pivot point; validation of today’s low is the only thing keeping the current channel structure alive.
🛡 5 Min Intraday Chart
⚔️ Gladiator Strategy Update
ATR: 245.67
IB Range: 147.60 → Medium
Market Structure: ImBalanced
Trade Highlights:
10:22 Short Trade: Target Hit (R:R 1:4.1) (IBL Breakout)
Trade Summary: The strategy successfully identified the morning’s bearish imbalance. The IBL breakout provided a high-probability entry that captured the slide through the 25,000 psychological level, yielding a massive 1:4.1 R:R before the V-shaped recovery commenced.
Personal Note: The system also alerted for a reversal long trade, but I avoided it due to fear and a technically far Stop-Loss (SL).
🧱 Support & Resistance Levels
Resistance Zones:
25180
25270 ~ 25300 (Crucial)
25380
25430
Support Zones:
25060
25009 ~ 24970
24920 (Line in the Sand)
🧠 Final Thoughts
“The channel bottom has been tested—and it held.”
Today was a survival test for the bulls. The Long-Legged Doji at these levels suggests that a bottom might be in, but turning bullish won’t be easy.
For the upcoming session, if Nifty respects the 24,920 low, the channel remains valid. However, if that low is breached, the structure is discarded, and we enter a new bearish phase. Expect extreme choppiness as both sides fight for control over the next directional move.
✏️ Disclaimer
This is just my personal viewpoint. Always consult your financial advisor before taking any action.

BTR LIVE TRADE SETUP | BSE LTD | 21 JAN 2026📈 Live Trade Setup – 21 Jan 2026
Stock: BSE LTD
Indicator: BTR Price Action Indicator
Timeframe: Intraday / Swing
🔵 BTR Buy Signal Generated
Entry (Buy): ₹2655
Stop Loss: As per BTR Swing Low
Targets:
🎯 Target 1: ₹2675
🎯 Target 2: ₹2720
🕒 Intraday Traders:
Book profits and exit by 3:20 PM
📆 Swing Traders:
Can hold position for higher targets as per BTR Fib expansion rules
📊 Logic Behind the Trade:
Trend reversal confirmed by BTR
Price action aligned with momentum
Targets derived using Fib 1.618 expansion from Entry → Swing Low
⚠️ Trade with proper risk management. Follow SL strictly.

Nifty Analysis EOD – January 19, 2026 – Monday🟢 Nifty Analysis EOD – January 19, 2026 – Monday 🔴
Open = High: Bears Punch First, Bulls Hold the 25,500 Line!
🗞 Nifty Summary
Nifty started the week with a cold shoulder, opening with a 45-point Gap Down and immediately printing an Open = High (OH) formation.
The bears wasted no time, sliding the index another 145 points to test the psychological floor at 25,500. After hitting a low of 25,494.35, the market entered a 3-hour “snooze fest” within a tight 50-point range.
A breakout attempt at 1:45 PM reached 25,630, but the recovery lacked legs, resulting in an 88-point pullback to close the day at 25,585.50 (-0.42%).
🛡 5 Min Intraday Chart with Levels
🛡 Intraday Walk
The “Open = High” structure was a clear warning from the first tick—bears were in the driving seat. The 3-hour consolidation mid-day was like a movie interval that lasted too long, providing zero directional clues until the late-session spike.
However, that spike at 1:45 PM was quickly sold into, proving that sellers are still lurking at the 25,630 ~ 25,650 resistance zone. Despite the red close, the 91-point lower wick shows that the 25,500 fort is being guarded closely.
📉 Daily Time Frame Chart with Intraday Levels
🕯 Daily Candle Breakdown
Open: 25,653.10
High: 25,653.30
Low: 25,494.35
Close: 25,585.50
Change: −108.85 (−0.42%)
🏗️ Structure Breakdown
Type: Bearish candle with a strong lower wick.
Range: ≈ 159 points — moderate volatility.
Body: ≈ 68 points — controlled selling pressure.
Upper Wick: ≈ 0.2 points — Total Bearish Dominance at the open.
Lower Wick: ≈ 91 points — Significant buyer defense at the 25,500 level.
📚 Interpretation
The OH formation is a “no-nonsense” bearish signal. By closing near the mid-point of the day’s range, the market has left the door open for both sides. The long lower wick prevents a breakdown for now, but the lack of an upper wick confirms that bulls are struggling to even initiate a recovery at the open.
🕯 Candle Type
Bearish Candle with Lower-Wick Support — Bears have the edge, but buyers are active at the 25,500 discount zone.
🛡 5 Min Intraday Chart
⚔️ Gladiator Strategy Update
ATR: 210.22
IB Range: 125 → Big
Market Structure: ImBalanced
Trade Highlights:
No Trade
Trade Summary: The strategy strictly forbade an IB breakout or contra trade today. With a Big IB + Imbalanced structure, the risk of being “chopped” or caught in a fakeout was too high. Sitting on hands was the most profitable trade today.
🧱 Support & Resistance Levels
Resistance Zones:
25650 (Immediate)
25690
25750 ~ 25780
Support Zones:
25550
25495 ~ 25475
25440
25375 ~ 25365
🧠 Final Thoughts
“Discipline is the bridge between goals and accomplishment.”
Tomorrow’s session looks dicey with the expiry looming. Will it be a “V-shape” recovery, more manipulation, or a bearish continuation? No one knows, and frankly, we don’t need to. We just need to stick to the strategy and follow the structure. If the IB is big again, I’m happy to stay a spectator. Better to miss a move than to lose capital on a “maybe.”
✏️ Disclaimer
This is just my personal viewpoint. Always consult your financial advisor before taking any action.

Nifty bounced from a support but still looking neutral to weak.Nifty today tried to bounce from the support zone existing between 25482 to 25494 region to close just under 25600 at 25585. Although it was a good bounce but still the formation on charts look weak.
If support of 25482 is broken we can see it fall further towards 25325 or even 25232 region. If the support of 25494 or 25482 is not broken and we can clear the resistnaces near 25599 and 25648 we can see Nifty march towards 25748 or 25913 range. Bulls can come back to business only after we get a closing above 25913 or 26003.
So there are lot of hurdles to clear before we Nifty Bulls can be back in business. Shadow of the cnadle right now is neutral.
Disclaimer: The above information is provided for educational purpose, analysis and paper trading only. Please don't treat this as a buy or sell recommendation for the stock or index. The Techno-Funda analysis is based on data that is more than 3 months old. Supports and Resistances are determined by historic past peaks and Valley in the chart. Many other indicators and patterns like EMA, RSI, MACD, Volumes, Fibonacci, parallel channel etc. use historic data which is 3 months or older cyclical points. There is no guarantee they will work in future as markets are highly volatile and swings in prices are also due to macro and micro factors based on actions taken by the company as well as region and global events. Equity investment is subject to risks. I or my clients or family members might have positions in the stocks that we mention in our educational posts. We are not a SEBI registered Research analyst. We will not be responsible for any Profit or loss that may occur due to any financial decision taken based on any data provided in this message. Do consult your investment advisor before taking any financial decisions. Stop losses should be an important part of any investment in equity.

Nifty levels - Jan 20, 2026Nifty support and resistance levels are valuable tools for making informed trading decisions, specifically when combined with the analysis of 5-minute timeframe candlesticks and VWAP. By closely monitoring these levels and observing the price movements within this timeframe, traders can enhance the accuracy of their entry and exit points. It is important to bear in mind that support and resistance levels are not fixed, and they can change over time as market conditions evolve.
The dashed lines on the chart indicate the reaction levels, serving as additional points of significance to consider. Furthermore, take note of the response at the levels of the High, Low, and Close values from the day prior.
We hope you find this information beneficial in your trading endeavors.
* If you found the idea appealing, kindly tap the Boost icon located below the chart. We encourage you to share your thoughts and comments regarding it.
Wishing you success in your trading activities!

Daily Analysis: Nifty 19/01/2026In the chaos of volatility, the immediate trading setup and the projections for nifty50 is shared in this video.

Nifty Short & Medium Term Support&Resistance_19-Jan-26 to 23-JanNifty 25694 (last week 25683 )(Last week 26328)
Nifty dipped upto 25473 last week (near to major support mentioned 25420 mentioned in last week report) due to global tension related to US- Greenland, Iran internal riots, US-Iran & China- Taiwan issue continuing for last two weeks.
Nifty touched 25623 and bounced back to 25694 ( Closed above 2nd Short term Support 25670 provided for last few weeks). Market expected to go sideways consoldiation or dip furthermore till the major support provided( 25300-25420) in the coming week but there is good short term support are there for indian market as mentioned below. Hence the broad movement will be between 25300-26000. It will be good opportunity for bottom fish the stocks and to buy mutual funds if it dips.
As far as India is concerned, economy is moderate, Q3 results are slowly coming out. public sector banks like union bank, punjab sind, Federal & IOB posted good results. Reliance moderate 1% up, hdfc bank posted 12% up, ICICI bank -3%, IDBI Bank is flat, Yes Bank is up but sales and EBIT are negative, South indian bank 9%, Infosys 11%, wipro -7% and Tech Mah 33%, Polycab 36%, HDB Fin Services 36% , HDFC Life -1% and ICICI Pru Life 12% and ICICI AMC 45% up and budget for 2026-27 to be proposed on Ist Feb 2026. So far Q3 results are Mixed.
Other Q3 Results and 1St Feb Budget will take the market to next level.
Since it is a Volatile situation SIP route or buy in multiple parcel route (On Dips) with a goal of 3-5 years ( Medium to Long term) will workout.
Considering the global situation, diversify the portfolio with Debt and liquid fund ( approx 20-30% portfolio) and 10-20% in Gold & Silver for Year 2026, this funds ( especially liquid funds will create funds availability for further buying opportunity incase of market dips like a Systematic transfer plan.
Some of the stocks to watchout given last week are HDFC AMC, NMDC, Apar, Sharda Crop, VRL Logistics, krishna Phos chem, Cipla, Dr Reddy, Natco pharma, Apl Apollo Tubes, Muthoot Finance ( On Dips) , tata Steel ( Contra Stock due to Business Cycle), Bank of Mah, BPCL, CG Power, hero motor, shriram finance and NRB bearings. Shared for Analysis purpose only. Dr Reddy, shriram fin, natco pharma, Hero moto corp,Muthoot Finance have already given more than 10% return in this 1 month,HPCL, BPCL, IOCL, Carysil, MAS Financial Services and BSE . Waaree Energies had an IT raid in its premises in Mid of Nov 2025. Outcome will take the stock forward.
New stocks proposed for watchout for 29-Dec-25 to 02-Jan-26 is Indian Bank and NBCC, buy on dip as market in volatile situation. Both stocks reduced further and in buyable range.
New Stocks ( to watchout For Jan Ist Week 2026) are ITC & Lupin.
For 18-Jan-26, after Q3 Results HDFC AMC ( already provided in the call above), Poly cab, union bank, Tech Mah, Infosys are some of the picks for Watchlist.
All the above stocks can be considered slowly ( as multiple parcels) in case of stock price has fallen.
RSI, MACD, Stochastic all indicators are in oversold situation and caution to be emphasized till each indicators move past its respective signal.
Nifty Short Term Supports (Multiple Supports are there between 25000-25500):
25670 (Jun 2025 High)
25360-25420 ( Sep high and trendline support as shown in chart)
25300-25350 (Two Fibonacci resistance shown ) - Major Support
Hence 25300- 25420 acts as major short term support.
25500 ( 25441 Sep 18th 2025 High )
25450 ( 25442 is the Aug 2025 high)
25200 ( 25154 Aug 2025 high)
25000 ( Milestone)
Short Term Resistance
1.26329 ( All time High)
2. 26500
3. 26700 ( Finonacci 1.618 as shown in graph)
Medium Term Support:
1.24700 (Trend Line as shown)
2. 24000-24170 (Fibonacci Retracements Supports- Two Supports in this zone 24116 & 24171 as shown)
3. 23500-23700 (Fibonacci Retracements Supports- Two Supports in this zone 23608 & 23707 as shown)
2. 23000
Medium Term Resistance:
1.27000 ( Need to decisively break 26269 all time high) This resistance is based on Fibonacci resistance at 27034
Long term resistance:
1.28000 ( Need to decisively break and move up 27000)This resistance is based on Fibonacci resistance at 28106
Long Term Support
1.22700-23000 ( Trend line and Mar 2024 High)
2.Big support at 20000 (Sep 2023 high)

nifty for 19.02.2026nifty showed an attempt by buyers to take control in the last session, but the move failed and sellers turned active, though without strong momentum. with the budget and major company results expected this week, buyers may step in again. until then, the market is likely to remain range-bound between 25800 and 25600.
a gap up opening and break out above 25750 could trigger a bullish move, while a gradual breakdown below 25600 may lead to a bearish trend but overall, selling pressure still appears weak.

Breakout Trade
National Securities Depository Ltd (NSDL) provides electronic infrastructure for dematerialization of securities and facilitates electronic settlement of trades in Indian Securities Market.
NSDL forms a triple bottom breakout chart pattern on daily time frame at around 1040 price acting as strong support and is all set to give breakout at 1086 price.
Near term possible targets will be 1200 and 1400.

NIFTY 50 | 1H | BTR Price Action –LONG TRADE ACTIVE📊 NIFTY 50 | 1H | BTR Price Action – TRADE ACTIVE
BTR Price Action Indicator has generated a LONG signal on NIFTY 50 (1-Hour timeframe) after a strong bearish move and momentum shift.
🔹 Market Context
Strong downside move followed by price stabilization
Bullish reaction from demand zone
Momentum candle confirms short-term trend shift
🔹 Trade Plan (As marked on chart)
Entry: On BTR Buy Signal
Stop Loss: Below recent swing low
Target 1: Near previous resistance zone
Target 2: Higher resistance / supply area
🔹 Execution Logic
This setup is based purely on price action + structure, with risk clearly defined. Partial profit booking near Target-1 is preferred, and trade management is key if volatility increases.
⚠️ This is a live market view, not a prediction.
⚠️ Always follow proper risk management.
NSE:NIFTY

Nifty levels - Jan 19, 2026Nifty support and resistance levels are valuable tools for making informed trading decisions, specifically when combined with the analysis of 5-minute timeframe candlesticks and VWAP. By closely monitoring these levels and observing the price movements within this timeframe, traders can enhance the accuracy of their entry and exit points. It is important to bear in mind that support and resistance levels are not fixed, and they can change over time as market conditions evolve.
The dashed lines on the chart indicate the reaction levels, serving as additional points of significance to consider. Furthermore, take note of the response at the levels of the High, Low, and Close values from the day prior.
We hope you find this information beneficial in your trading endeavors.
* If you found the idea appealing, kindly tap the Boost icon located below the chart. We encourage you to share your thoughts and comments regarding it.
Wishing you success in your trading activities!

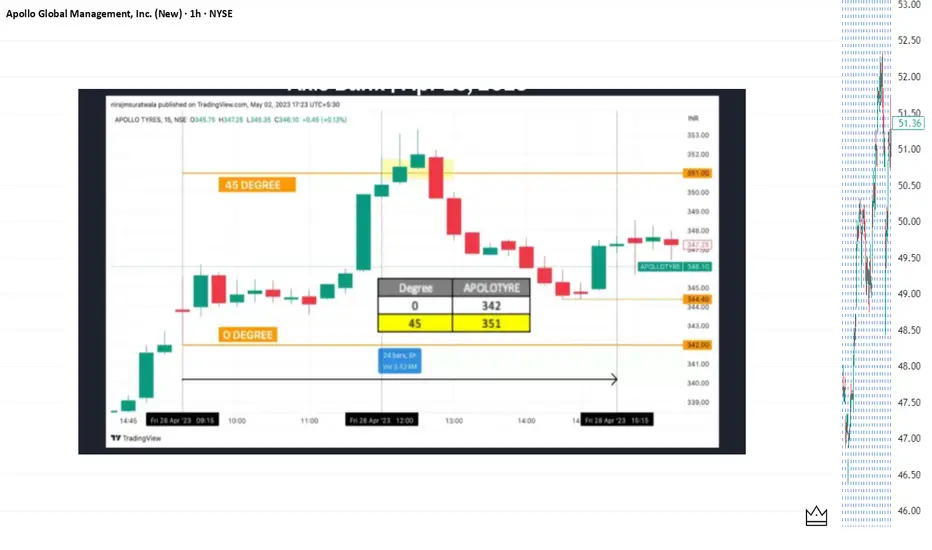
Apollo Tyres | Gann Square of 9 Intraday Case Study | 28 Apr 202This chart demonstrates a classic Gann Square of 9 intraday application, where price reached its normal capacity early in time, leading to a logical reversal.
On 28 April 2023, Apollo Tyres opened with strong upward momentum.
The low of the first 15-minute candle (₹342) was selected as the 0-degree (0°) reference point, following standard WD Gann methodology.
Using the Gann Square of 9, the stock’s normal intraday upside capacity was projected at:
45° → ₹351
Price reached the 45-degree level around 12:00 PM, which is well before the ideal Gann timing window near 2:30 PM.
According to Gann’s time–price relationship, early completion of a degree level increases the probability of exhaustion.
The market reacted immediately from this zone and moved lower, offering clear and logical intraday selling opportunities.
This example highlights how price geometry combined with time analysis helps traders identify high-probability reaction zones, rather than relying on guesswork.
📌 Key Gann Levels
0° → 342
45° → 351
🔍 Key Takeaways
Square of 9 defines price capacity
Time defines when that capacity matters
Early degree completion often signals exhaustion
Geometry + time = structured intraday decisions
Disclaimer:
This idea is shared strictly for educational and analytical purposes. It does not constitute investment or trading advice.
Nifty levels - Jan 16, 2026Nifty support and resistance levels are valuable tools for making informed trading decisions, specifically when combined with the analysis of 5-minute timeframe candlesticks and VWAP. By closely monitoring these levels and observing the price movements within this timeframe, traders can enhance the accuracy of their entry and exit points. It is important to bear in mind that support and resistance levels are not fixed, and they can change over time as market conditions evolve.
The dashed lines on the chart indicate the reaction levels, serving as additional points of significance to consider. Furthermore, take note of the response at the levels of the High, Low, and Close values from the day prior.
We hope you find this information beneficial in your trading endeavors.
* If you found the idea appealing, kindly tap the Boost icon located below the chart. We encourage you to share your thoughts and comments regarding it.
Wishing you success in your trading activities!

nifty 14.01.2026nifty price action is extremely volatile in this expiry week. ahead of tomorrows sensex expiry expiry, nifty has formed a wide 250-points range. upside resistance is placed around 25800-25830, while downside support lies near 25550-25580. a strong directional move is expected only after a clear breakout from this range.

Nifty Analysis EOD – January 13, 2026 – Tuesday 🟢 Nifty Analysis EOD – January 13, 2026 – Tuesday 🔴
Fib 0.618 Defense: Expiry Day Rollercoaster Ends in 296-Point Volatility!
🗞 Nifty Summary
The Nifty started the session with a promising 90-point Gap Up, seemingly continuing yesterday’s bullish momentum. However, the optimism evaporated instantly as the index dived 195 points from the first tick, hitting the 25,700 mark.
After forming a temporary base and recovering 120 points to 25,820, Nifty encountered a textbook Double Top pattern, which triggered a second collapse back to the day’s low. A period of consolidation followed before a final flush-out broke the IBL, dragging the index to a day low of 25,603.30.
Interestingly, this low coincided exactly with the Fib 0.618 level, sparking a violent 150-point recovery to close at 25,714.20 (-0.22%).
While heavyweights like Reliance, LT, and Trent acted as major anchors, the intraday swings provided a paradise for agile traders.
🛡 5 Min Intraday Chart with Levels
🛡 Intraday Walk
The day was a masterclass in “stop-hunting” and liquidating over-leveraged positions on both sides. The initial “Open = High” (almost) structure led to a vertical drop that trapped morning bulls.
The recovery to 25,820 was promising until the Double Top confirmed that the bears weren’t finished. The breakdown to 25,603 was the ultimate “capitulation” move. The subsequent sharp recovery suggests that the 0.618 Fibonacci level is being defended as a major structural floor.
Despite the bearish close, the massive 129-point lower wick indicates that demand remains potent at the extreme discount zone.
📉 Daily Time Frame Chart with Intraday Levels
🕯 Daily Candle Breakdown
Open: 25,897.35
High: 25,899.80
Low: 25,603.30
Close: 25,732.30
Change: −57.95 (−0.22%)
🏗️ Structure Breakdown
Type: Bearish candle with a long lower wick.
Range (High–Low): ≈ 296 points — exceptionally high intraday volatility.
Body: ≈ 165 points — reflects firm selling pressure from the opening gap.
Upper Wick: ≈ 2 points — zero buying strength observed near the highs.
Lower Wick: ≈ 129 points — strong, aggressive buying rejection from the Fibonacci base.
📚 Interpretation
The candle is a portrait of a market in flux. Opening at the top and closing significantly lower confirms that the morning gap was used as a massive distribution window.
However, the recovery of nearly 130 points from the lows (the lower wick) confirms that the 25,600 zone is a high-demand territory. The market is oscillating violently, looking for a stable equilibrium after the recent “Phoenix” recovery.
🕯 Candle Type
Bearish Candle with Strong Lower-Wick Rejection — Signals heavy overhead supply but strong underlying support at the 0.618 Fibonacci level.
🛡 5 Min Intraday Chart
⚔️ Gladiator Strategy Update
ATR: 214.01
IB Range: 198.95 → Medium
Market Structure: Balanced
Trade Highlights:
10:04 Long Trade: Target Hit (R:R 1:1.08) (Trendline Breakout)
12:41 Short Trade: Target Hit (R:R 1:1.95) (IBL Breakout)
Trade Summary: Despite the chaotic expiry day swings, the strategy remained disciplined. The morning long capture was a quick scalp before the Double Top formed. The afternoon Short trade on the IBL breakdown was the high-conviction move of the day, capturing the slide toward the Fib 0.618 target.
🧱 Support & Resistance Levels
Resistance Zones:
25820
25855 ~ 25880
25940 (Crucial)
Support Zones:
25600
25550
25475
🧠 Final Thoughts
“The Fibonacci levels don’t lie, even on expiry day!”
Today’s price action proves that 25,600 is the line in the sand for the bulls.
If we gap down below this tomorrow, things could get ugly. But if we sustain above it, the “reversal” story is still on the table.
I’ll let President Trump decide if he wants to tweet the Nifty back to 26,000 or if he’s too busy “hiring and firing” to worry about our 0.618 levels! Let’s see what the opening tick brings on Wednesday.
✏️ Disclaimer
This is just my personal viewpoint. Always consult your financial advisor before taking any action.

Nifty levels - Jan 14, 2026Nifty support and resistance levels are valuable tools for making informed trading decisions, specifically when combined with the analysis of 5-minute timeframe candlesticks and VWAP. By closely monitoring these levels and observing the price movements within this timeframe, traders can enhance the accuracy of their entry and exit points. It is important to bear in mind that support and resistance levels are not fixed, and they can change over time as market conditions evolve.
The dashed lines on the chart indicate the reaction levels, serving as additional points of significance to consider. Furthermore, take note of the response at the levels of the High, Low, and Close values from the day prior.
We hope you find this information beneficial in your trading endeavors.
* If you found the idea appealing, kindly tap the Boost icon located below the chart. We encourage you to share your thoughts and comments regarding it.
Wishing you success in your trading activities!

Nifty Analysis EOD – January 12, 2026 – Monday🟢 Nifty Analysis EOD – January 12, 2026 – Monday 🔴
The Phoenix Recovery: Bulls Resurrect Nifty with 340-Point V-Shape Swing!
🗞 Nifty Summary
After hitting multi-month lows, the Nifty performed a spectacular “Phoenix Recovery.”
The session started flat but quickly turned into a bloodbath as the index plunged 172 points to find initial support at 25,530. A symmetrical triangle formed near the lows, eventually breaking down to test the 25,473 level.
However, as noted in previous sessions, the market was deeply oversold. Fueled by short covering and potential positive news, Nifty executed a vertical reversal, reclaiming the 25,750 ~ 25,780 resistance zone with ease.
The index closed at 25,790.25 (with intraday highs hitting 25,806.10), effectively wiping out the morning panic and signaling a powerful structural reversal.
🛡 5 Min Intraday Chart with Levels
🛡 Intraday Walk
The day was a tale of two halves. The morning belonged to the bears, who exploited the initial flat open to drive a high-velocity sell-off toward the 25,470 zone.
The symmetrical triangle breakdown looked like a final flush-out of weak hands. The afternoon, however, saw one of the sharpest recoveries in recent history.
The vertical ascent crossed the 25,750 barrier without any significant pullback, leaving late-entry bears trapped at the bottom.
The close near the day’s high confirms that the “oversold” spring has finally uncoiled.
📉 Daily Time Frame Chart with Intraday Levels
🕯 Daily Candle Breakdown
Open: 25,669.05
High: 25,813.15
Low: 25,473.40
Close: 25,790.25
Change: +106.95 (+0.42%)
🏗️ Structure Breakdown
Type: Bullish Rejection Candle.
Range (High–Low): ≈ 340 points — extreme intraday volatility.
Body: ≈ 121 points — reflecting strong bullish participation in the second half.
Upper Wick: ≈ 196 points — massive rejection of lower prices, signaling a potential bottom.
Lower Wick: ≈ 23 points — minimal resistance at the close.
📚 Interpretation
The massive lower wick (nearly 200 points) is a classic “Hammer” signal appearing after a prolonged downtrend. It indicates that supply has been exhausted and demand has aggressively returned. The close above the opening price, despite the deep early plunge, is a high-conviction signal that the short-term sentiment has flipped from “Sell on Rise” to “Buy on Dip.”
🕯 Candle Type
Bullish Rejection / Hammer-Like Recovery Candle — Traditionally marks the end of a bearish sequence; follow-through above 25,820 is now critical.
🛡 5 Min Intraday Chart
⚔️ Gladiator Strategy Update
ATR: 204.84
IB Range: 171.90 → Medium
Market Structure: ImBalanced
Trade Highlights:
10:58 Short Trade: Target Hit (R:R 1:1.71) (Symmetrical Triangle Breakout)
12:04 Long Trade: Target Hit (R:R 1:6.34) (Trendline Breakout)
Trade Summary: A legendary day for the Gladiator Strategy. While the morning short trade captured the final flush-out, the 12:04 PM Long signal on the trendline breakout was the star performer. It captured the entire V-shape reversal, delivering a massive 1:6.34 R:R as Nifty relentlessly marched toward the day’s high
🧱 Support & Resistance Levels
Resistance Zones:
25820
25855 ~ 25880
25940 (Crucial)
Support Zones:
25600
25550
25475
🧠 Final Thoughts
“The bulls have found their spine.”
Technically, this is a perfect reversal setup, but caution is still the word of the day.
I am staying neutral-to-bullish but will remain cautious until we get a decisive daily close above 25,940. As for the weekend “Trump Fate,” it seems the market decided not to wait for a tweet to start the recovery! Let’s see if he provides the “HUGE” momentum needed to cross the 26K hurdle again, or if this was just a short-covering bounce. For now, let’s watch the opening tick tomorrow with a smile.
✏️ Disclaimer
This is just my personal viewpoint. Always consult your financial advisor before taking any action.

nifty 13.01.2026nifty showed a strong uptrend today, but it appears to be a liquidity grab on the upside as geopolitical concerns still persist. additionally, post market close, inflation data came in higher than expected. considering these factors, I'm expecting a gap down opening tomorrow, with a possible continuation of the decline towards the 25350 level.
