Nifty Weekly Outlook (22–28 August 2025)Nifty Weekly Outlook (22–28 August 2025)
Above pivot = bullish bias.
Below pivot = bearish bias.
Watch for reversals near R1/S1, then R2/S2, and finally R3/S3 if levels break.
📢 Disclaimer
I am not a SEBI-registered financial adviser.
The information, views, and ideas shared here are purely for educational and informational purposes only. They are not intended as investment advice or a recommendation to buy, sell, or hold any financial instruments.
Please consult with your SEBI-registered financial advisor before making any trading or investment decisions.
Trading and investing in the stock market involves risk, and you should do your own research and analysis. You are solely responsible for any decisions made based on this research.
Niftylevels

Nifty Analysis EOD – August 21, 2025 – Thursday🟢 Nifty Analysis EOD – August 21, 2025 – Thursday 🔴
Bulls holding the line, but fading strength visible near 25,150
🗞 Nifty Summary
Nifty opened with a gap-up of 98 points at 25,144.85, continuing its bullish tone above the previous day’s high. But from the very first tick, it slipped lower to fill the gap and found support at 25,055, where it formed the IB range. A sharp recovery took it back toward the open, but multiple attempts failed to cross Day Open / Day High / IB High.
Around 2:15 pm, another breakout attempt was strongly rejected, pushing the index below the PDH, and Nifty finally closed at 25,076.95.
Though the close is higher by +33 points vs the previous day, it left behind a red daily candle (close < open). This indicates fading bullish momentum, even though HH-HL structure is still intact.
The range was narrow (≈98 points), categorising the day as range-bound, not sideways. The previous weekly expiry was also narrow yet sideways.
🛡 5 Min Intraday Chart with Levels
🛡 Intraday Walk
Gap-up opening at 25,144.85, above PDH → bullish continuation vibe.
Early dip → support at 25,055 → IB formed.
Recovery attempt back to day’s open, but rejection at 25,150 zone.
Second breakout attempt at 2:15 pm → harder rejection.
Index slipped below PDH → closed at 25,076.95, above support.
📉 Daily Time Frame Chart with Intraday Levels
🕯 Daily Candle Breakdown
Open: 25,142.00
High: 25,153.65
Low: 25,054.90
Close: 25,083.75
Change: +33.20 (+0.13%)
🏗️ Structure Breakdown
Red candle (Close < Open)
Body: 58.25 points
Upper wick: 11.65 points
Lower wick: 28.85 points
📚 Interpretation
Sellers defended 25,150 again.
Close still above 25,050 → buyers alive.
Lower wick shows dip-buying at 25,055.
Net effect: Mild profit booking, not a reversal.
🕯️ Candle Type
Small bearish body with lower tail → selling pressure at top, hidden demand at support.
🛡 5 Min Intraday Chart
🛡 Gladiator Strategy Update
ATR: 195.14
IB Range: 89.95 → Medium
Market Structure: ImBalanced
Trade Highlight: No trade trigger today.
🕵️ Range & Bias
Support Zone: 24,955 – 24,920
Resistance Zone: 25,100 – 25,140
Bias: Cautiously Bullish → above 25k, but conviction is weak.
📌 Support & Resistance Levels
🎚️ Resistance Zones
25,100
25,155
25,190 (pattern target)
25,240
🎚️ Support Zones
25,050 ~ 25,030
24,995
24,955
24,920
24,890 – 24,880
💡 Final Thoughts
The market is respecting 25,050 as demand and 25,150 as supply, leaving price action compressed in a tight zone. Bulls are still holding ground, but repeated failures near resistance hint at fading strength.
📌 “Markets often whisper before they roar — repeated rejections are the whisper, the breakout will be the roar.”
✏️ Disclaimer
This is my personal analysis — not investment advice. Please consult your financial advisor before trading.

Nifty levels - Aug 22, 2025Nifty support and resistance levels are valuable tools for making informed trading decisions, specifically when combined with the analysis of 5-minute timeframe candlesticks and VWAP. By closely monitoring these levels and observing the price movements within this timeframe, traders can enhance the accuracy of their entry and exit points. It is important to bear in mind that support and resistance levels are not fixed, and they can change over time as market conditions evolve.
The dashed lines on the chart indicate the reaction levels, serving as additional points of significance to consider. Furthermore, take note of the response at the levels of the High, Low, and Close values from the day prior.
We hope you find this information beneficial in your trading endeavors.
* If you found the idea appealing, kindly tap the Boost icon located below the chart. We encourage you to share your thoughts and comments regarding it.
Wishing you success in your trading activities!

NIFTY KEY LEVELS FOR 21.08.2025NIFTY KEY LEVELS FOR 21.08.2025
If the candle stays above the pivot point, it is considered a bullish bias; if it remains below, it indicates a bearish bias. Price may reverse near Resistance 1 or Support 1. If it moves further, the next potential reversal zone is near Resistance 2 or Support 2. If these levels are also broken, we can expect the trend.
If the range(R2-S2) is narrow, the market may become volatile or trend strongly. If the range is wide, the market is more likely to remain sideways
📢 Disclaimer
I am not a SEBI-registered financial adviser.
The information, views, and ideas shared here are purely for educational and informational purposes only. They are not intended as investment advice or a recommendation to buy, sell, or hold any financial instruments.
Please consult with your SEBI-registered financial advisor before making any trading or investment decisions.
Trading and investing in the stock market involves risk, and you should do your own research and analysis. You are solely responsible for any decisions made based on this research.

Nifty levels - Aug 21, 2025Nifty support and resistance levels are valuable tools for making informed trading decisions, specifically when combined with the analysis of 5-minute timeframe candlesticks and VWAP. By closely monitoring these levels and observing the price movements within this timeframe, traders can enhance the accuracy of their entry and exit points. It is important to bear in mind that support and resistance levels are not fixed, and they can change over time as market conditions evolve.
The dashed lines on the chart indicate the reaction levels, serving as additional points of significance to consider. Furthermore, take note of the response at the levels of the High, Low, and Close values from the day prior.
We hope you find this information beneficial in your trading endeavors.
* If you found the idea appealing, kindly tap the Boost icon located below the chart. We encourage you to share your thoughts and comments regarding it.
Wishing you success in your trading activities!

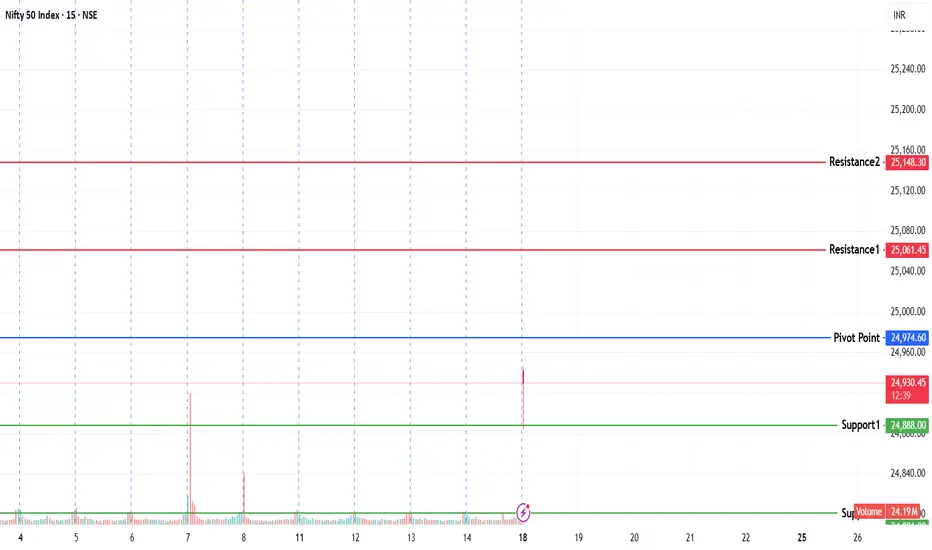
NIFTY KEY LEVELS FOR 20.08.2025NIFTY KEY LEVELS FOR 20.08.2025
Sorry for the delayed post..
If the candle stays above the pivot point, it is considered a bullish bias; if it remains below, it indicates a bearish bias. Price may reverse near Resistance 1 or Support 1. If it moves further, the next potential reversal zone is near Resistance 2 or Support 2. If these levels are also broken, we can expect the trend.
If the range(R2-S2) is narrow, the market may become volatile or trend strongly. If the range is wide, the market is more likely to remain sideways
📢 Disclaimer
I am not a SEBI-registered financial adviser.
The information, views, and ideas shared here are purely for educational and informational purposes only. They are not intended as investment advice or a recommendation to buy, sell, or hold any financial instruments.
Please consult with your SEBI-registered financial advisor before making any trading or investment decisions.
Trading and investing in the stock market involves risk, and you should do your own research and analysis. You are solely responsible for any decisions made based on this research.
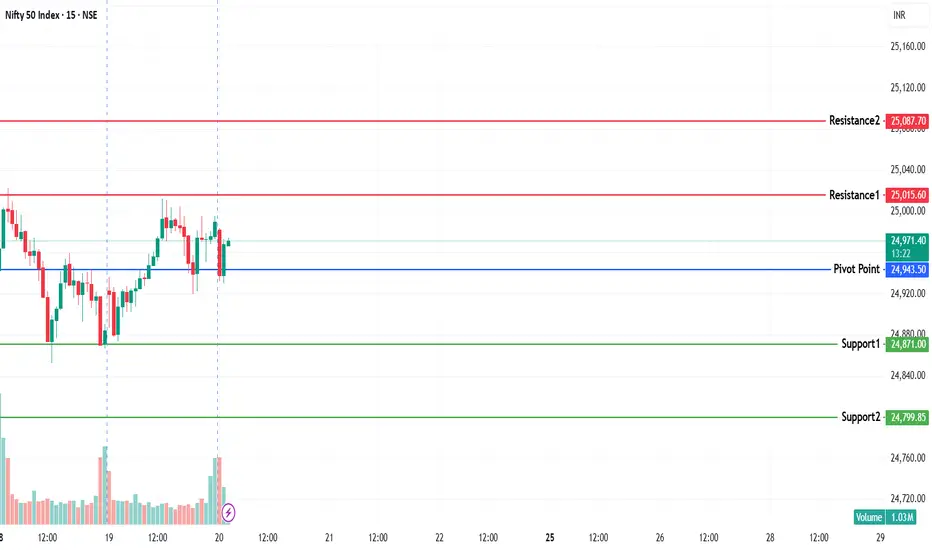
Nifty showing strength but nearing key resistances now.Nifty had a good closing today up 103.7 points closing just below 25K at 24980.65. Things have taken a positive turn after the GST relief related announcement from GOI. Today Reliance did heavy lifting as it was up 2.84%.
Now the Nifty is entering a zone where there are few important hurdles. Once they are crossed there is a fair Chance of proper Bull run. The resistance in front of Nifty now are at 24992, 25042, 25133 and most importantly the zone between 25245 to 25328. Above 25328 there is strong Bullish territory.
The supports for Nifty remain at 24866, 24820 (Father Line support), 24742 (Mother line support). Below 24742 there can be further bearish weakness which can pull Nifty down towards 24573 or even 24341. (But that can happen only if we get a closing below 24742.
Right now the Nifty seems to be in Bullish mode with few resistances approaching.
Disclaimer: The above information is provided for educational purpose, analysis and paper trading only. Please don't treat this as a buy or sell recommendation for the stock or index. The Techno-Funda analysis is based on data that is more than 3 months old. Supports and Resistances are determined by historic past peaks and Valley in the chart. Many other indicators and patterns like EMA, RSI, MACD, Volumes, Fibonacci, parallel channel etc. use historic data which is 3 months or older cyclical points. There is no guarantee they will work in future as markets are highly volatile and swings in prices are also due to macro and micro factors based on actions taken by the company as well as region and global events. Equity investment is subject to risks. I or my clients or family members might have positions in the stocks that we mention in our educational posts. We will not be responsible for any Profit or loss that may occur due to any financial decision taken based on any data provided in this message. Do consult your investment advisor before taking any financial decisions. Stop losses should be an important part of any investment in equity.

Nifty levels - Aug 20, 2025Nifty support and resistance levels are valuable tools for making informed trading decisions, specifically when combined with the analysis of 5-minute timeframe candlesticks and VWAP. By closely monitoring these levels and observing the price movements within this timeframe, traders can enhance the accuracy of their entry and exit points. It is important to bear in mind that support and resistance levels are not fixed, and they can change over time as market conditions evolve.
The dashed lines on the chart indicate the reaction levels, serving as additional points of significance to consider. Furthermore, take note of the response at the levels of the High, Low, and Close values from the day prior.
We hope you find this information beneficial in your trading endeavors.
* If you found the idea appealing, kindly tap the Boost icon located below the chart. We encourage you to share your thoughts and comments regarding it.
Wishing you success in your trading activities!

NIFTY KEY LEVELS FOR 19.08.2025NIFTY KEY LEVELS FOR 19.08.2025
Sorry for the delayed post..
If the candle stays above the pivot point, it is considered a bullish bias; if it remains below, it indicates a bearish bias. Price may reverse near Resistance 1 or Support 1. If it moves further, the next potential reversal zone is near Resistance 2 or Support 2. If these levels are also broken, we can expect the trend.
If the range(R2-S2) is narrow, the market may become volatile or trend strongly. If the range is wide, the market is more likely to remain sideways
📢 Disclaimer
I am not a SEBI-registered financial adviser.
The information, views, and ideas shared here are purely for educational and informational purposes only. They are not intended as investment advice or a recommendation to buy, sell, or hold any financial instruments.
Please consult with your SEBI-registered financial advisor before making any trading or investment decisions.
Trading and investing in the stock market involves risk, and you should do your own research and analysis. You are solely responsible for any decisions made based on this research.

Nifty Analysis EOD – August 18, 2025 – Monday🟢 Nifty Analysis EOD – August 18, 2025 – Monday 🔴
Gap-Up Glory Meets 25K Roadblock
🗞 Nifty Summary
Nifty opened with a massive 300+ point gap-up, but early profit booking dragged it down by 58 points. A sharp rebound from the day’s low in the first 5 min carried it to a new high of 25,022, just testing the psychological 25K level.
However, that zone acted as a ceiling; profit booking and fresh selling kicked in, pulling Nifty not only below the high or mean but also beneath the opening print and morning day low. After a brief 100-point bounce from a fresh day low, rejection from the VWAP kept the index suppressed.
By the close, Nifty settled near the day’s bottom at 24,876.95, still up +245.65 points (+1.00%) but printing a red candle due to closing below the open.
👉 A textbook gap-up exhaustion session: bullish sentiment upfront, intraday dominated by selling pressure.
📊 Intraday Walk
🚀 Gap-Up Start: Open at 24,938.20 (up >300 points).
📉 Early Booking: Dragged down ~58 points.
🔄 Quick Rebound: Buyers drove Nifty to the day high at 25,022.
⛔ 25K Blocked: Profit booking intensified, breaking below opening levels.
⚡ Second Bounce: +100 points recovery attempt from new day low.
📉 VWAP Rejection: Sellers regained control; close near the bottom at 24,876.95.
🛡 5 Min Intraday Chart with Levels
📉 Daily Time Frame Chart with Intraday Levels
🕯 Daily Candle Breakdown
Open: 24,938.20
High: 25,022.00
Low: 24,852.85
Close: 24,876.95
Change: +245.65 (+1.00%)
Candle Structure
Type: Red candle (close < open) despite a strong % gain.
Body: 61.25 pts
Upper Wick: 83.80 pts
Lower Wick: 24.10 pts
Interpretation
Market opened strong but gave back intraday gains.
Candle resembles an Inverted Hammer / Shooting Star in a gap-up.
Signals loss of bullish momentum, but needs next session confirmation.
🛡 5 Min Intraday Chart
⚔️ Gladiator Strategy Update
ATR: 218.49
IB Range: 137.7 → Medium
Market Structure: imBalanced
Trade Highlight: No trade triggered
📌 Support & Resistance Levels
Resistance Zones
24,955
24,995
25,030 – 25,050
25,100
25,240
Support Zones
24,850 – 24,820
24,770 – 24,745
24,695 – 24,675
24,600 – 24,585
🎯 What’s Next?
If 24820 ~ 24,850 holds, buyers may regroup and reattempt a breakout above 25,000.
If broken, expect deeper profit booking toward 24,745 – 24,675.
Psychological pressure at 25K remains the key battle zone.
💡 Final Thoughts
Today was a classic gap-up exhaustion day — the market showed enthusiasm, but sellers ruled intraday.
“Markets love to test conviction. What looks like strength at open can often be weakness by close.”
✏️ Disclaimer
This is just my personal viewpoint. Always consult your financial advisor before taking any action.

Nifty levels - Aug 19, 2025Nifty support and resistance levels are valuable tools for making informed trading decisions, specifically when combined with the analysis of 5-minute timeframe candlesticks and VWAP. By closely monitoring these levels and observing the price movements within this timeframe, traders can enhance the accuracy of their entry and exit points. It is important to bear in mind that support and resistance levels are not fixed, and they can change over time as market conditions evolve.
The dashed lines on the chart indicate the reaction levels, serving as additional points of significance to consider. Furthermore, take note of the response at the levels of the High, Low, and Close values from the day prior.
We hope you find this information beneficial in your trading endeavors.
* If you found the idea appealing, kindly tap the Boost icon located below the chart. We encourage you to share your thoughts and comments regarding it.
Wishing you success in your trading activities!

NIFTY KEY LEVELS FOR 18.08.2025NIFTY KEY LEVELS FOR 18.08.2025
If the candle stays above the pivot point, it is considered a bullish bias; if it remains below, it indicates a bearish bias. Price may reverse near Resistance 1 or Support 1. If it moves further, the next potential reversal zone is near Resistance 2 or Support 2. If these levels are also broken, we can expect the trend.
If the range(R2-S2) is narrow, the market may become volatile or trend strongly. If the range is wide, the market is more likely to remain sideways
📢 Disclaimer
I am not a SEBI-registered financial adviser.
The information, views, and ideas shared here are purely for educational and informational purposes only. They are not intended as investment advice or a recommendation to buy, sell, or hold any financial instruments.
Please consult with your SEBI-registered financial advisor before making any trading or investment decisions.
Trading and investing in the stock market involves risk, and you should do your own research and analysis. You are solely responsible for any decisions made based on this research.
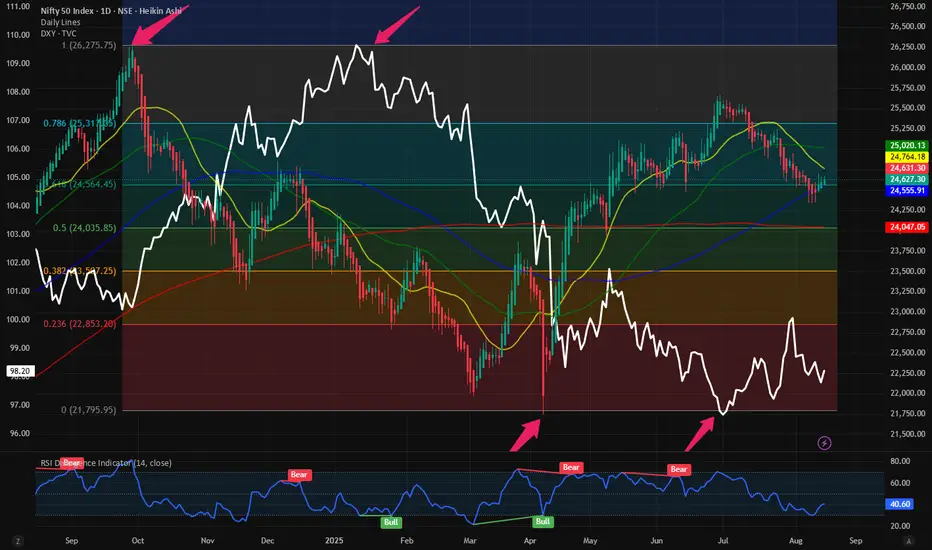
$NIFTY: Failed breakout, no bullish pattern visible Indian equity markets were the investors favorite for many years, and it did perform very well for the last 10 years. At its peak the index has generated 150% return for its investors in the last 5 years beating the S&P500 and even the tech heavy NASDAQ100. But since peaking in Sept 2024 the index has been lower to sideways for almost 12 months.
The recent poor price action in NSE:NIFTY has resulted in the index down more than 10% from its highs. With SP:SPX and PEPPERSTONE:NAS100 at or new their ATH and TVC:DXY below 100 the index is unable to break out of this poor price action. On July 27 we discussed this and concluded that the medium-term target of 2600 on NSE:NIFTY and 96 on TVC:DXY remains intact. Since then, we are more of less unchanged on both the indices. Now let’s look into the Fib retracement levels on the Daily chart of $NIFTY. The Tops and the bottom on the NSE:NIFTY correspond perfectly with that of $DXY.
We need a revision in our short to medium term expectation in bot the indices. Now I expect much poor price action within NSE:NIFTY as it has very little momentum left to show for. We should be happy if we can touch the 0.786 Fib levels which is @ 25300 which indicates a meagre 3% upside from here.
Verdict: Underperform. NSE:NIFTY minimum upside potential in the index. Rather go long other risky assets to outperform the markets.
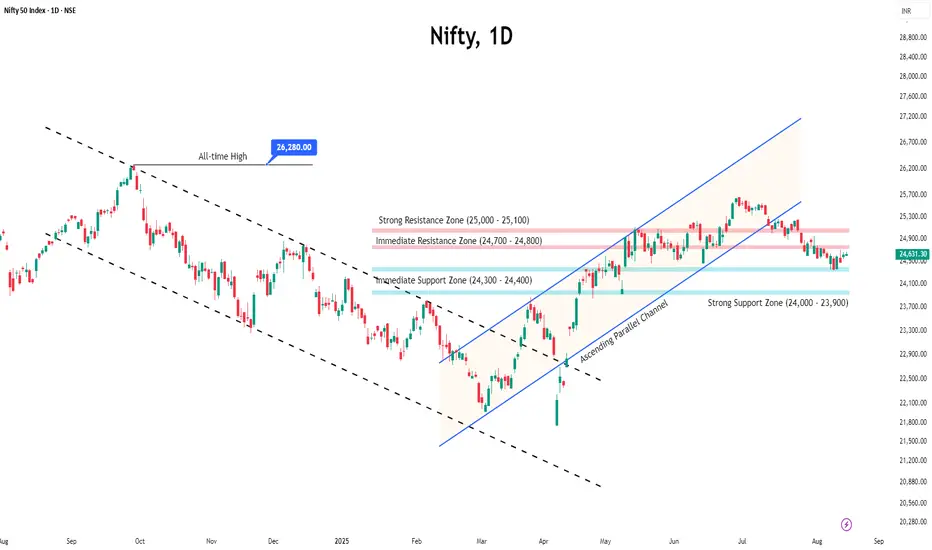
Nifty Rebounds After Six-Week Fall, Consolidation Continues● Nifty finally ended its six-week losing run, closing the week with a 1.10% gain despite trading in a narrow range.
● Volatility inched higher, with India VIX rising 2.68% to 12.35, reflecting a slightly elevated risk perception, though it remains comfortably low.
● On the technical front, the 24,300–24,400 zone is likely to act as immediate support, while resistance is seen at 24,700–24,800.
● Heading into nest expiry, the index is expected to remain in a neutral phase as it continues to consolidate below key resistance levels. Without a decisive breakout, aggressive buying should be avoided.
● Traders are advised to closely monitor price action around these key levels and manage risk carefully while planning trades.
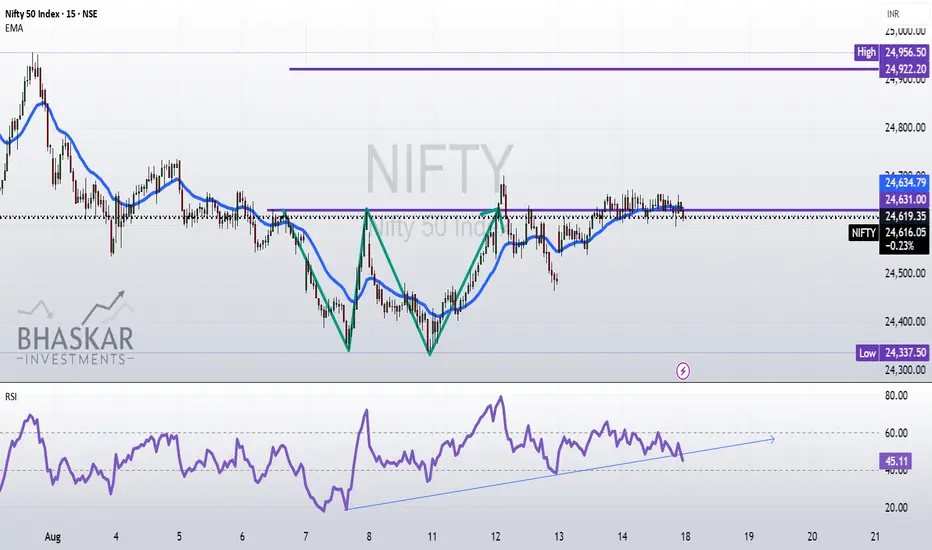
Explaining concept of RSI with respect EMA.The NIFTY50 is currently displaying a bullish setup, characterized by the formation of a ‘W’ pattern on the chart. This structure is further supported by a strengthening Relative Strength Index (RSI), which indicates improving momentum. Additionally, the price action is aligning positively with the EMA20 , reinforcing the potential for an upward move. Together, these technical signals suggest that NIFTY50 may experience bullish momentum in the near future.
Disclaimer:
I am NOT a SEBI registered advisor nor a financial advisor.
Any investments or trades I discuss on my blog are intended solely for educational purposes and do not represent specific financial, trading, or investment advice.
Disclosure:
I, the author of this report, and my immediate family members do not have any financial interest or beneficial ownership in the securities mentioned herein at the time of publication.
Nifty Analysis EOD – August 14, 2025 – Thursday 🟢 Nifty Analysis EOD – August 14, 2025 – Thursday 🔴
Quiet Expiry Day on the Surface, Wild Moves Beneath
🗞 Nifty Summary
Nifty opened neutral, and within the first 1 minute carved a 60-point range — a range that turned out to be almost the entire day’s action. For the rest of the session, the index stayed locked inside this band, repeatedly attempting to break above the PDH + R1 zone, but each time failing to sustain. Similarly, the lower boundary provided reliable support, keeping Nifty trapped.
While the overall weekly expiry felt silent in terms of range, the price action inside the band was anything but quiet — wild intraday swings offered ample opportunities for scalpers and quick traders. Structurally, today’s range stayed inside the previous day’s range, aside from a few points of false breakout shadows.
The game plan for the next session remains the same as discussed yesterday — we’re still waiting for a decisive breakout from this coiling structure.
Refere the game plan here:
🛡 5 Min Intraday Chart with Levels
📉 Daily Time Frame Chart with Intraday Levels
🕯 Daily Candle Breakdown
Candle Data:
Open: 24,607.25
High: 24,673.65
Low: 24,596.90
Close: 24,631.30
Change: +11.95 (+0.05%)
Structure Breakdown:
Green candle (Close > Open)
Body size: 24.05 points → very small → low momentum
Upper wick: 42.35 points
Lower wick: 10.35 points
Interpretation:
Market opened near yesterday’s close, tried pushing higher but failed to hold gains.
Small green body signals sideways indecision; buyers still defended the 24,600 zone.
Longer upper wick vs lower wick → selling pressure near highs.
Candle Type:
Small-bodied Spinning Top / Doji-like candle → indecision, no clear trend control.
📊 Short-Term View
Consolidation persists in 24,600–24,650 zone.
Break above 24,675 = bullish strength.
Break below 24,595 = bearish momentum toward 24,535–24,460.
Range & Bias:
Support: 24,595 – 24,535
Resistance: 24,675 – 24,700
Bias: Neutral-to-mildly bullish above 24,600
🛡 5 Min Intraday Chart
⚔ Gladiator Strategy Update
ATR: 199.36
IB Range: 68.25 → Medium
Market Structure: Balanced
Trade Highlight: No Trade Triggered
📌 Support & Resistance Levels
Resistance Zones:
24,660
24,690 ~ 24,700
24,735
24,780
Support Zones:
24,585
24,560
24,525 ~ 24,515
24,500
24,475
💡 Final Thoughts
"The tighter the coil, the sharper the breakout."
Nifty is compressing hard — a breakout is inevitable, and expiry’s quietness might just be the calm before a directional move.
✏️ Disclaimer
This is a personal market observation, not financial advice.

Nifty levels - Aug 18, 2025Nifty support and resistance levels are valuable tools for making informed trading decisions, specifically when combined with the analysis of 5-minute timeframe candlesticks and VWAP. By closely monitoring these levels and observing the price movements within this timeframe, traders can enhance the accuracy of their entry and exit points. It is important to bear in mind that support and resistance levels are not fixed, and they can change over time as market conditions evolve.
The dashed lines on the chart indicate the reaction levels, serving as additional points of significance to consider. Furthermore, take note of the response at the levels of the High, Low, and Close values from the day prior.
We hope you find this information beneficial in your trading endeavors.
* If you found the idea appealing, kindly tap the Boost icon located below the chart. We encourage you to share your thoughts and comments regarding it.
Wishing you success in your trading activities!

NIFTY KEY LEVELS FOR 14.08.2025NIFTY KEY LEVELS FOR 14.08.2025
If the candle stays above the pivot point, it is considered a bullish bias; if it remains below, it indicates a bearish bias. Price may reverse near Resistance 1 or Support 1. If it moves further, the next potential reversal zone is near Resistance 2 or Support 2. If these levels are also broken, we can expect the trend.
If the range(R2-S2) is narrow, the market may become volatile or trend strongly. If the range is wide, the market is more likely to remain sideways
📢 Disclaimer
I am not a SEBI-registered financial adviser.
The information, views, and ideas shared here are purely for educational and informational purposes only. They are not intended as investment advice or a recommendation to buy, sell, or hold any financial instruments.
Please consult with your SEBI-registered financial advisor before making any trading or investment decisions.
Trading and investing in the stock market involves risk, and you should do your own research and analysis. You are solely responsible for any decisions made based on this research.
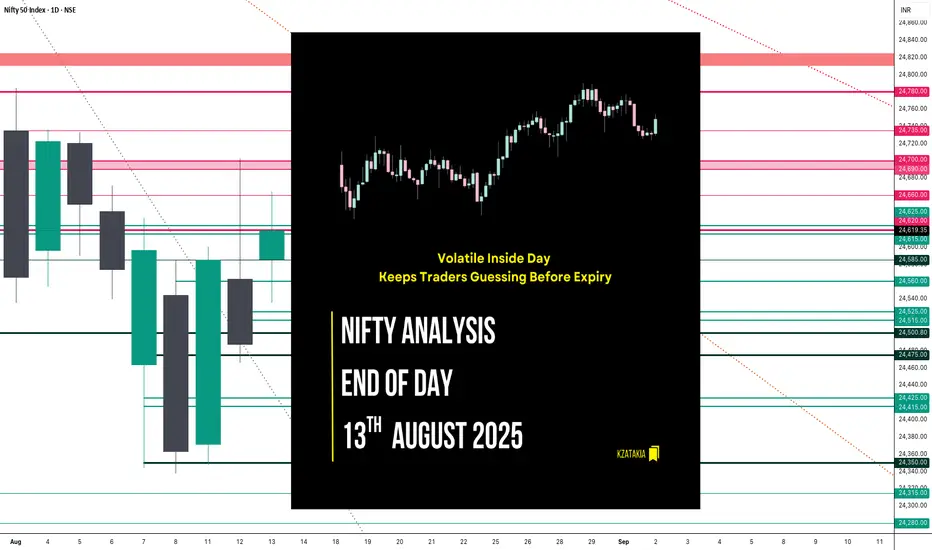
Nifty Analysis EOD – August 13, 2025 – Wednesday🟢 Nifty Analysis EOD – August 13, 2025 – Wednesday 🔴
Volatile Inside Day Keeps Traders Guessing Before Expiry
🗞 Nifty Summary
Nifty opened with a 102-point gap-up, driven by early bullish sentiment. However, the 24,600 zone acted as resistance right from the start, pushing prices down by 64 points to mark the day’s low at 24,535.25. Support emerged from the CPR zone, fueling a rebound that broke through 24,600 and set a new day high at 24,614.20, completing the Initial Balance (IB).
Once again, Nifty failed to sustain above 24,600, drifting between the IB range and VWAP. Around 12:40 PM, IB high was breached, but the index had to fight hard to stay above it. After an extended struggle to reach the previous day’s high, the index finally topped at 24,664.55, then retreated back toward the IB high before closing at 24,630.40.
Price action was highly volatile with no clear directional conviction, reflected in the long wicks on 5-minute candles. Structurally, the day remained balanced and inside the previous day’s range, forming an Inside Bar pattern on the daily chart — a setup known for potential breakout opportunities.
🛡 5 Min Intraday Chart with Levels
🎯 Tomorrow’s Game Plan
Tomorrow is weekly expiry, and my bias starts bullish:
💡 Bullish Plan:
If the market opens inside today’s range, I’ll wait for a breach and hold above 24,660 for long opportunities.
First hurdle: 24,700
Targets: 24,780 → 24,825 → 24,890
💡 Bearish Plan:
Not my primary view, but I’ll consider shorts if 24,525 ~ 24,515 breaks and sustains below.
First hurdle: 24,475 ~ 24,465
Targets: 24,425 → 24,350 → trail for deeper dips
📉 Daily Time Frame Chart with Intraday Levels
🕯 Daily Candle Breakdown
OHLC: Open 24,586.20 | High 24,664.55 | Low 24,535.25 | Close 24,619.35
Change: +131.95 (+0.54%)
Body: 33.15 points (small)
Upper Wick: 45.20 points
Lower Wick: 50.95 points
📌 Interpretation:
Small-bodied green Spinning Top → market hesitation despite a positive close.
Close above the midpoint hints at a mild recovery attempt.
Buyers need follow-through above 24,665 to build momentum; losing 24,535 could shift bias bearish.
📊 Short-Term View
Bias: Mildly bullish above 24,585
Support: 24,500 – 24,475
Resistance: 24,660 – 24,700
🛡 5 Min Intraday Chart
⚔ Gladiator Strategy Update
ATR: 212.98
IB Range: 78.95 → Medium
Market Structure: Balanced
Trade Highlight:
12:40 PM – Long Entry → SL Hit
📌 Support & Resistance Levels
📌 Resistance Zones:
24,660
24,690 ~ 24,700
24,735
24,780
📌 Support Zones:
24,585
24,560
24,525 ~ 24,515
24,500
24,475
💡 Final Thoughts
"Inside Bars before expiry can be like coiled springs — they can snap in either direction, and fast."
Patience in the morning and disciplined level play will be key tomorrow.
✏️ Disclaimer
This is my personal market view for educational purposes — not financial advice.
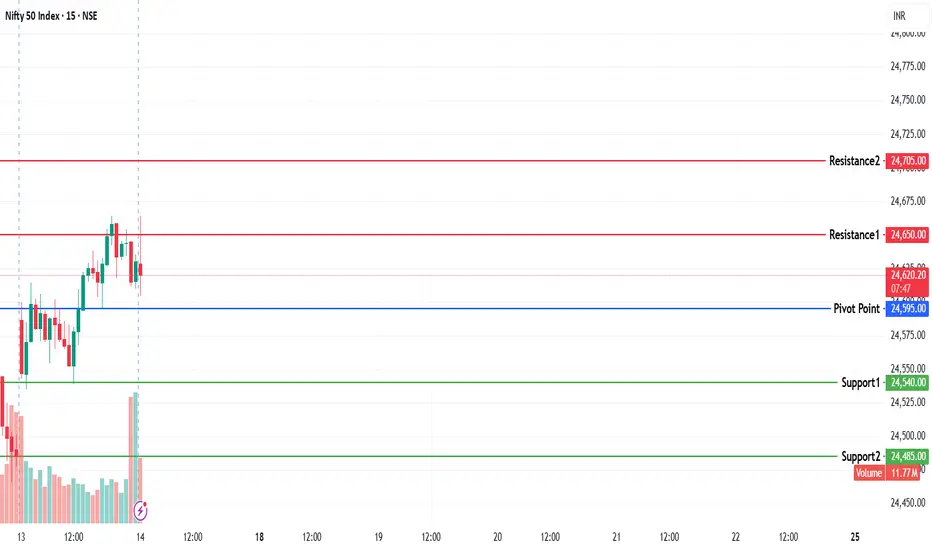
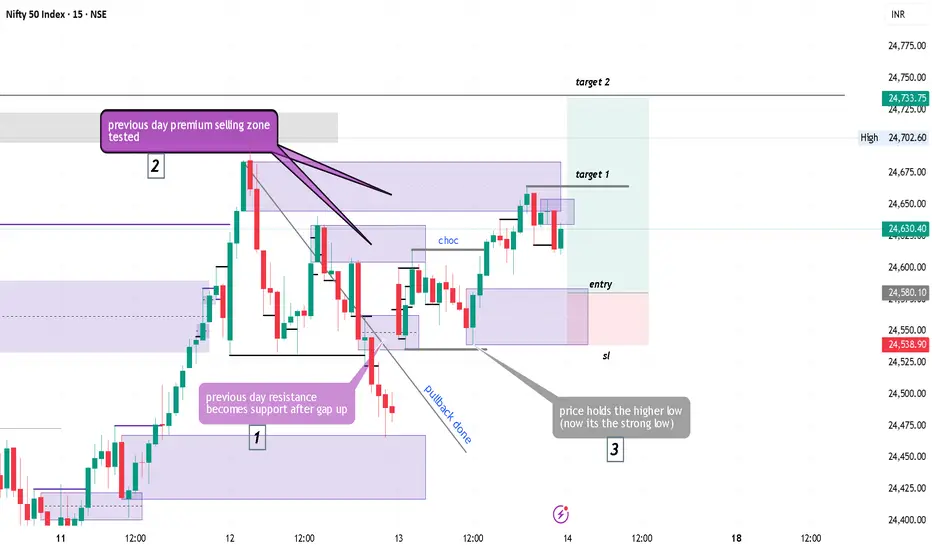
Nifty50 trade Technical Analysis for tomorrow (14 aug)As the market opened on 13 August, it gapped up above Resistance #1, directly entering the premium zone. The resistance, marked as (1), has now turned into support.
Following this, point (2) shows that the remaining supply zones were tested. However, the price did not break the day’s low of 24,538 and instead formed a swing structure favoring the long side. Based on this, our bias for tomorrow remains bullish.
Towards the close, the price tested the top supply zone on the 15-minute chart and showed signs of a pullback. This suggests that the price is likely to retrace into the new demand zone, which lies around the 24,583–24,538 area.
The strong low formed on 13 August is expected to hold. However, since the market is dynamic, it is best to wait for the price to enter the zone and reject bearish pressure before making any moves.
Nifty levels - Aug 14, 2025Nifty support and resistance levels are valuable tools for making informed trading decisions, specifically when combined with the analysis of 5-minute timeframe candlesticks and VWAP. By closely monitoring these levels and observing the price movements within this timeframe, traders can enhance the accuracy of their entry and exit points. It is important to bear in mind that support and resistance levels are not fixed, and they can change over time as market conditions evolve.
The dashed lines on the chart indicate the reaction levels, serving as additional points of significance to consider. Furthermore, take note of the response at the levels of the High, Low, and Close values from the day prior.
We hope you find this information beneficial in your trading endeavors.
* If you found the idea appealing, kindly tap the Boost icon located below the chart. We encourage you to share your thoughts and comments regarding it.
Wishing you success in your trading activities!

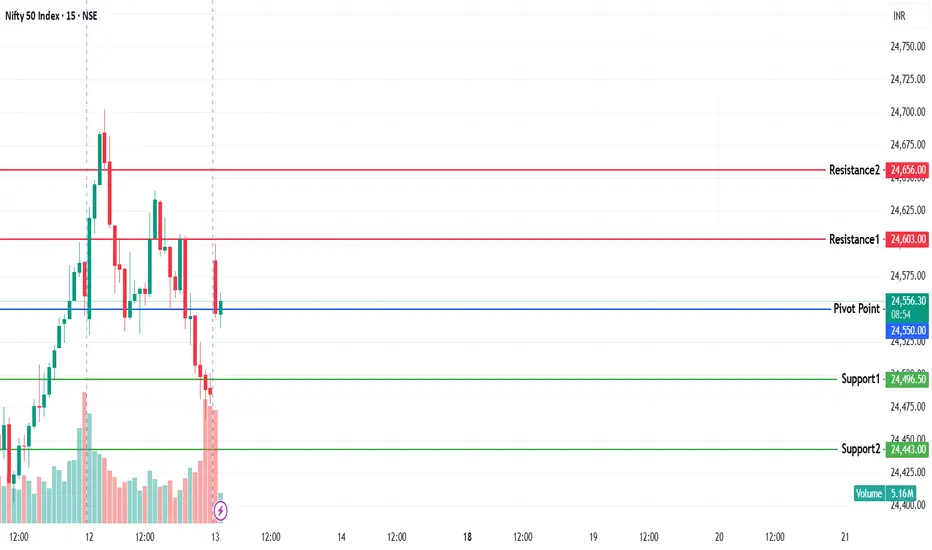
NIFTY KEY LEVELS FOR 13.08.2025NIFTY KEY LEVELS FOR 13.08.2025
If the candle stays above the pivot point, it is considered a bullish bias; if it remains below, it indicates a bearish bias. Price may reverse near Resistance 1 or Support 1. If it moves further, the next potential reversal zone is near Resistance 2 or Support 2. If these levels are also broken, we can expect the trend.
If the range(R2-S2) is narrow, the market may become volatile or trend strongly. If the range is wide, the market is more likely to remain sideways
📢 Disclaimer
I am not a SEBI-registered financial adviser.
The information, views, and ideas shared here are purely for educational and informational purposes only. They are not intended as investment advice or a recommendation to buy, sell, or hold any financial instruments.
Please consult with your SEBI-registered financial advisor before making any trading or investment decisions.
Trading and investing in the stock market involves risk, and you should do your own research and analysis. You are solely responsible for any decisions made based on this research.
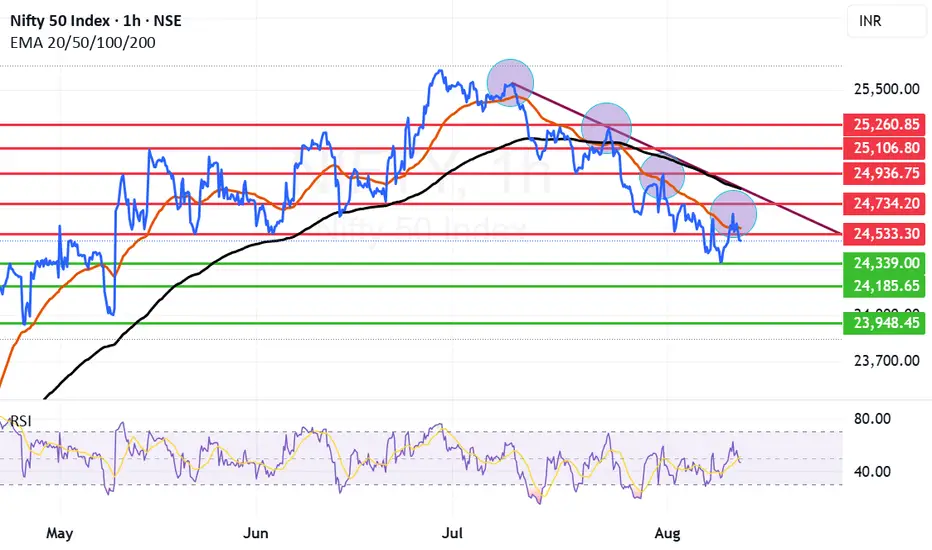
Lower High Lower Low forming in Nifty showing overall weakness. Today market showed some positive intent by reaching 24702 but could not sustain the levels and fell flat to close at 24487 giving up 215 points from the top. This proves that Nifty is continuously failing to sustain the momentum and after making a high seems to be plunging further and further. It seems to have become sell on bounce market. Every bounce is used by investors to exit theri positions. This is leads us into he current formation of lower highs and lower lows.
A change in pattern and formation is required for the market to go back to bullishness. The market seems to be waiting for some good news on Tariff front to spur the interest of retail investors. For this to happen a closing above the trend line is required. Right now market remains in a bear grip. Long term investors and dividend investors have an extended time to buy some stocks available at good value focus should be on the stocks that can maximize returns when the Bull rally begins. Buy in parts do not go all in at once as this market can present buying opportunities time and again.
Supports for Nifty remain at: 24339, 24185 and 23948. (Market may fall into total Bear grip if we get a closing below 23948.)
Resistances for Nifty remain at: 24566 (Mother line resistance of an hourly chart), 24734, 24829 (Father line resistance). 24936, 25106 and finally 25260. (Bulls will control the market after we get a weekly closing above 25260).
Disclaimer: The above information is provided for educational purpose, analysis and paper trading only. Please don't treat this as a buy or sell recommendation for the stock or index. The Techno-Funda analysis is based on data that is more than 3 months old. Supports and Resistances are determined by historic past peaks and Valley in the chart. Many other indicators and patterns like EMA, RSI, MACD, Volumes, Fibonacci, parallel channel etc. use historic data which is 3 months or older cyclical points. There is no guarantee they will work in future as markets are highly volatile and swings in prices are also due to macro and micro factors based on actions taken by the company as well as region and global events. Equity investment is subject to risks. I or my clients or family members might have positions in the stocks that we mention in our educational posts. We will not be responsible for any Profit or loss that may occur due to any financial decision taken based on any data provided in this message. Do consult your investment advisor before taking any financial decisions. Stop losses should be an important part of any investment in equity.