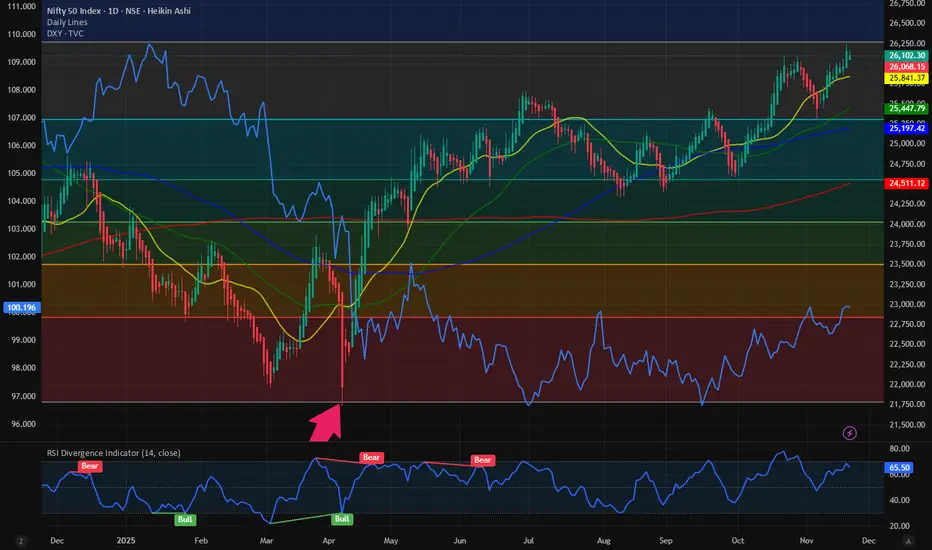
$NIFTY Breakout in progress. Relative strength with $DXY @ 100.NSE:NIFTY has been in an uptrend after a considerable period of time spend between the 100-Day and 200-Day SMA. IN my last blog on 17th Aug, I predicted that we have no bullish pattern on the chart and we should be first targeting the near term goal of 25300 in $NIFTY.
NSE:NIFTY : Failed breakout, no bullish pattern visible for NSE:NIFTY by RabishankarBiswal — TradingView
At that point of time, I was bearishly optimistic. But the index has paid its penalty and after spending a considerable amount of time from Aug to Oct between the 100-Day and 200-Day SMY the index has gained momentum. And to my surprise this has happened when TVC:DXY is touching a new near term high of 100. This shows that there might be more upside to the index provided the TVC:DXY stabilizes and underperforms from here. TVC:DXY might find it very difficult to cross above 102 and stay above the psychological level of 100 in the medium term. In that universe we can easily see NSE:NIFTY reclaiming the old highs of 26300 and probably marching ahead to 30000.
Trade Set Up: NSE:NIFTY breakout confirmed. NSE:NIFTY to cross above 26300 by year end and march higher into 2026. Watch TVC:DXY for more positive momentum.
Niftylevels
Nifty levels - Nov 24, 2025Nifty support and resistance levels are valuable tools for making informed trading decisions, specifically when combined with the analysis of 5-minute timeframe candlesticks and VWAP. By closely monitoring these levels and observing the price movements within this timeframe, traders can enhance the accuracy of their entry and exit points. It is important to bear in mind that support and resistance levels are not fixed, and they can change over time as market conditions evolve.
The dashed lines on the chart indicate the reaction levels, serving as additional points of significance to consider. Furthermore, take note of the response at the levels of the High, Low, and Close values from the day prior.
We hope you find this information beneficial in your trading endeavors.
* If you found the idea appealing, kindly tap the Boost icon located below the chart. We encourage you to share your thoughts and comments regarding it.
Wishing you success in your trading activities!

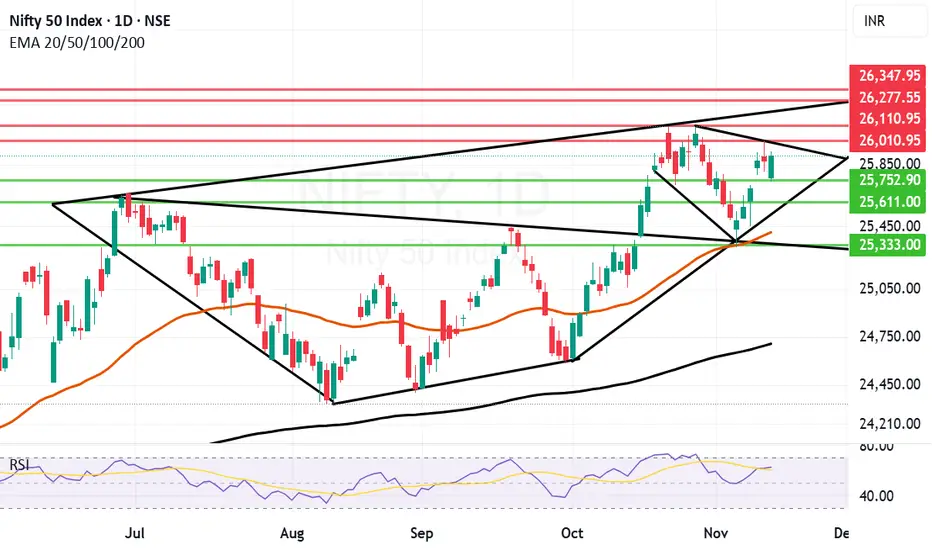
Good for a long haul but can important resistances be crossed? Nifty is good for Long haul and going towards new highs but there are few important resistances to be crossed before that can be achieved. The important resistances up and ahead are at 26010, 26110, 26277 and finally trend top above the previous ATH at 26347. The support for Nifty are at 25752, 25611, 25412 (Mother line support) and finally 25333. 25333 is an important turnaround point a closing below this will bring Nifty into bear grip. Things look ominous for an upsurge but as mentioned and seen in the chart there are few important resistances to be crossed.
To know more about Mother and Father line supports, Mother, Father and Small child theory, Trend lines, supports and resistances you can read my book THE HAPPY CANDLES WAY TO WEALTH CREATION. The book is currently rated 4.8/5 on Amazon. It is reasonably priced and it can work as a handbook to wealth creation through equity. It is a value for money book, do read it.
Disclaimer: The above information is provided for educational purpose, analysis and paper trading only. Please don't treat this as a buy or sell recommendation for the stock or index. The Techno-Funda analysis is based on data that is more than 3 months old. Supports and Resistances are determined by historic past peaks and Valley in the chart. Many other indicators and patterns like EMA, RSI, MACD, Volumes, Fibonacci, parallel channel etc. use historic data which is 3 months or older cyclical points. There is no guarantee they will work in future as markets are highly volatile and swings in prices are also due to macro and micro factors based on actions taken by the company as well as region and global events. Equity investment is subject to risks. I or my clients or family members might have positions in the stocks that we mention in our educational posts. We will not be responsible for any Profit or loss that may occur due to any financial decision taken based on any data provided in this message. Do consult your investment advisor before taking any financial decisions. Stop losses should be an important part of any investment in equity.
Nifty Analysis EOD – November 20, 2025 – Thursday🟢 Nifty Analysis EOD – November 20, 2025 – Thursday 🔴
Bullish Extension Continues, Nifty Just 29 Points Away from All-Time High!
🗞 Nifty Summary
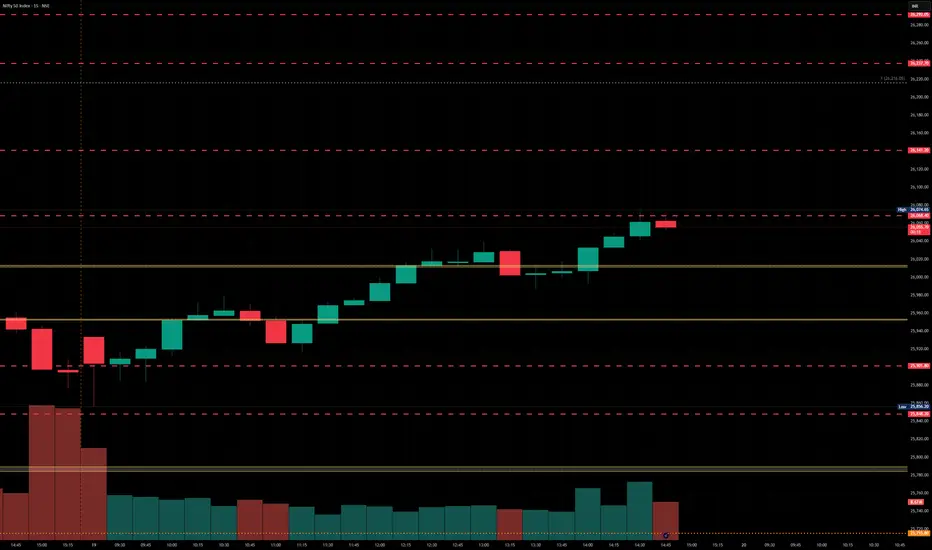
The Nifty opened with an 83-point Gap Up, confidently trading above the Previous Day’s High (PDH). The initial few minutes saw the gap fill, finding solid support exactly at the PDH level.
The index then consolidated for about 90 minutes near the CDH + IBH, forming a narrow 20-25 point range. Following this pause, Nifty resumed its upward march with steady “baby steps,” successfully breaching the crucial 26220 resistance level and marking the day’s high at 26,246.65. Although unable to sustain above 26220, leading to a sharp, volatile slip back, the index closed strongly at 26,192.15, adding +139.50 points (+0.54%) from the previous day’s close.
This was a clear bullish extension day, achieving the targets aimed for yesterday, though the lack of participation from small-cap and mid-cap segments remains a point of caution. We are now merely 29 points away from marking a new All-Time High (ATH).
🛡 5 Min Intraday Chart with Levels
🛡 Intraday Walk
The session was defined by an initial deep gap-up, followed by the gap-fill and strong defense of the PDH, confirming the bullish bias.
The mid-session consolidation was a low-volume affair, acting as a spring for the second leg of the upward rally.
The move through 26220 was aggressive, but the quick rejection from the high indicated strong supply at the historical peak levels.
The final closing level, however, remains robust, signaling that overall control is with the buyers, and the primary objective is the ATH.
📉 Daily Time Frame Chart with Intraday Levels
🕯 Daily Candle Breakdown
Open: 26,132.10
High: 26,246.65
Low: 26,063.20
Close: 26,192.15
Change: +139.50 (+0.54%)
🏗️ Structure Breakdown
Type: Bullish candle.
Range (High–Low): ≈ 183 points — healthy, broad intraday movement.
Body: ≈ 60 points — showing controlled but steady bullish strength.
Upper Wick: ≈ 54 points — indicating profit-booking or resistance near the 26220 high.
Lower Wick: ≈ 69 points — strong buying from lower levels, confirming demand on dips.
📚 Interpretation
The strong opening and consistent follow-through buying throughout the day confirm the prevailing bullish trend. Although the upper wick is substantial, reflecting the failure to sustain the breakout above 26220, the close is well above the open and previous major resistance levels. This indicates that while bears defended the immediate high, they were unable to shift the overall market structure.
🕯 Candle Type
Bullish Candle with Both-Side Wicks (Buyers Dominant) — This is a strong continuation signal, confirming the control of the bulls despite minor overhead resistance.
🛡 5 Min Intraday Chart
⚔️ Gladiator Strategy Update
ATR: 196.67
IB Range: 72.8 → Medium
Market Structure: ImBalanced
Trade Highlights:
10:05 Long Trade - Target Hit (R:R 1:3.13)
12:24 Long Trade - Target Hit (R:R 1:3.96)
Trade Summary: The strategy performed exceptionally well today, capitalising on the clear directional moves after the initial range-bound phase. The two high R:R long trades captured the core bullish extension of the day.
🧱 Support & Resistance Levels
Resistance Zones:
26220 (Immediate Resistance)
26277 (All-Time High)
Support Zones:
26135 (Gap Fill Zone)
26104 ~ 26075 (Critical Intraday Support)
26063 ~ 26040
26000 (Psychological Support)
25950 ~ 25940
🧠 Final Thoughts
“The final frontier is 26,277.”
The market is in clear bullish territory, with all major resistance levels below 26220 successfully converted into support. The primary focus for the next session is the All-Time High at 26,277.
A decisive breach and close above this level will trigger strong momentum. If the market fails to breach the ATH, we may see a slight correction toward the 26135 support zone before the next attempt.
Traders must remain mindful that non-participation from the broader market (mid/small-caps) could eventually lead to market breadth deterioration.
✏️ Disclaimer
This is just my personal viewpoint. Always consult your financial advisor before taking any action.

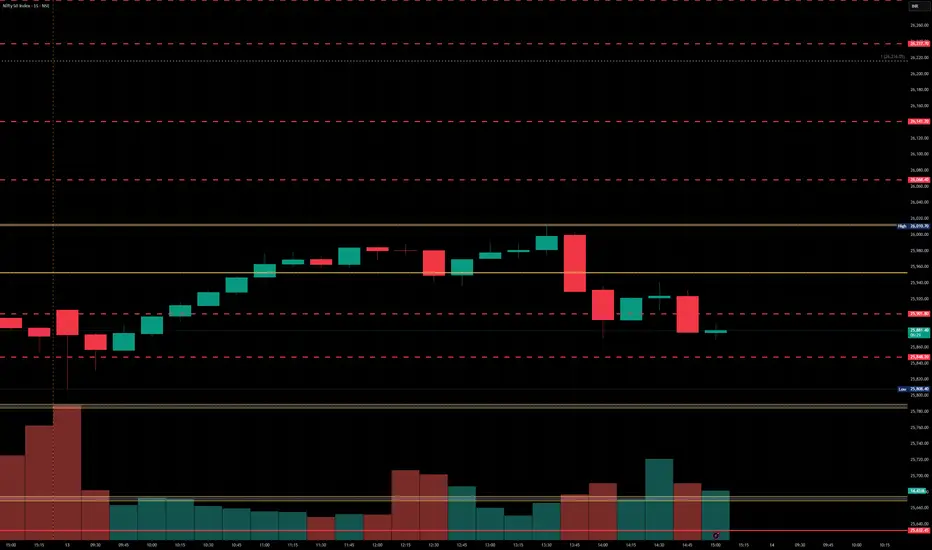
Nifty levels - Nov 21, 2025Nifty support and resistance levels are valuable tools for making informed trading decisions, specifically when combined with the analysis of 5-minute timeframe candlesticks and VWAP. By closely monitoring these levels and observing the price movements within this timeframe, traders can enhance the accuracy of their entry and exit points. It is important to bear in mind that support and resistance levels are not fixed, and they can change over time as market conditions evolve.
The dashed lines on the chart indicate the reaction levels, serving as additional points of significance to consider. Furthermore, take note of the response at the levels of the High, Low, and Close values from the day prior.
We hope you find this information beneficial in your trading endeavors.
* If you found the idea appealing, kindly tap the Boost icon located below the chart. We encourage you to share your thoughts and comments regarding it.
Wishing you success in your trading activities!

NIFTY Short SetupNIFTY is likely in distribution phase
Structure is getting weak, so we may see some selling in Large caps by end of November or by end of December.
Overall setup is valid only if the recent high is protected!
Have a profitable day and succesful trades!

Nifty Analysis EOD – November 19, 2025 – Wednesday 🟢 Nifty Analysis EOD – November 19, 2025 – Wednesday 🔴
Bulls Reclaim Dominance, Securing a Strong Close Above 26,000
🗞 Nifty Summary
The Nifty opened with a 39-point Gap Up, immediately dipping to find strong support at 25,857.50, which marked the day’s low. From this base, the index began a steady climb, reaching the 25977 resistance without significant hindrance.
After a brief retrace to 25920, the main buying pressure pushed the index into the contentious 26010 ~ 26030 zone. Here, bulls and bears engaged in a strong fight for dominance. Ultimately, the bulls won, successfully breaching 26,040 and marking the day’s high at 26,074.65.
The Nifty closed firmly at 26,052.65, adding +142.60 points (+0.55%) and closing higher than the previous session’s high. This move is a strong indicator of bullish control, completely engulfing the negative candle from the prior day.
For tomorrow, the 25920 ~ 25944 range is critical support, setting the stage for a potential move toward 26104 and higher.
🛡 5 Min Intraday Chart with Levels
🛡 Intraday Walk
The session featured an excellent demonstration of buy-on-dip sentiment. After the initial dip, the price movement was characterized by strong, gradual ascent, indicating institutional participation.
The most challenging part of the day was the consolidation around the 26,000 psychological mark, where high volatility was observed. Although the intraday price action around 26K was tough, the decisive final close near the high confirms that the sellers ran out of steam, and bulls secured dominance.
The daily chart forming an Engulfing Candle is a classic pattern indicating a potential trend continuation with renewed momentum.
📉 Daily Time Frame Chart with Intraday Levels
🕯 Daily Candle Breakdown
Open: 25,918.10
High: 26,074.65
Low: 25,856.20
Close: 26,052.65
Change: +142.60 (+0.55%)
🏗️ Structure Breakdown
Type: Bullish candle, engulfing the previous day’s bearish body.
Range (High–Low): ≈ 218 points — a wide range showing strong intraday activity.
Body: ≈ 134 points — confirming buyers were firmly in control throughout the session.
Upper Wick: ≈ 22 points — mild rejection near the highs, but overall insignificant.
Lower Wick: ≈ 62 points — the early dip was aggressively bought, confirming demand at lower levels.
📚 Interpretation
The strong close near the day’s high indicates solid bullish conviction, completely negating the bearish price action from the previous session. The close above the previous day’s high is a key technical signal. While the move above 26,000 was contested, the resulting Bullish Engulfing Candle on the daily time frame strongly suggests that the bullish momentum is back and possibly accelerating.
🕯 Candle Type
Strong Bullish Candle with Lower-Wick Buying Support — A powerful continuation signal.
🛡 5 Min Intraday Chart
⚔️ Gladiator Strategy Update
ATR: 196.97
IB Range: 77.45 → Medium
Market Structure: ImBalanced
Trade Highlights:
9:32 Long Trade - SL Hit
9:55 Long Trade - Target Hit (R:R 1:1.8)
11:25 Long Trade - Target Hit (R:R 1:3.46)
13:26 Short Trade - Trailing SL Hit
Trade Summary: The volatile nature of the range-bound morning led to an initial loss, but the strategy successfully captured two high R:R long trades during the main directional move upwards. The day’s action provided good two-sided opportunities, but the final outcome confirmed the long side as dominant.
🧱 Support & Resistance Levels
Resistance Zones:
26075 (Day’s High)
26104
26220
Support Zones:
26010 (Psychological Support)
25977
25944 ~ 25920 (Critical Intraday Support)
🧠 Final Thoughts
“The bulls have responded with force. The range battle is over.”
The decisive close above 26,000 has shifted the bias back to the upside. For the continuation, Nifty must clear and hold above 26075. A clean break of 26104 would likely open the path toward 26220. The key level to watch for short-term support is the 25920 ~ 25944 band; as long as Nifty holds here, the path is upward.
✏️ Disclaimer
This is just my personal viewpoint. Always consult your financial advisor before taking any action.

Nifty levels - Nov 20, 2025Nifty support and resistance levels are valuable tools for making informed trading decisions, specifically when combined with the analysis of 5-minute timeframe candlesticks and VWAP. By closely monitoring these levels and observing the price movements within this timeframe, traders can enhance the accuracy of their entry and exit points. It is important to bear in mind that support and resistance levels are not fixed, and they can change over time as market conditions evolve.
The dashed lines on the chart indicate the reaction levels, serving as additional points of significance to consider. Furthermore, take note of the response at the levels of the High, Low, and Close values from the day prior.
We hope you find this information beneficial in your trading endeavors.
* If you found the idea appealing, kindly tap the Boost icon located below the chart. We encourage you to share your thoughts and comments regarding it.
Wishing you success in your trading activities!
Nifty Analysis EOD – November 18, 2025 – Tuesday 🟢 Nifty Analysis EOD – November 18, 2025 – Tuesday 🔴
26K Rejection: Bears Take Control, Wiping Out Previous Day’s Gain!
🗞 Nifty Summary
Despite lingering negative global sentiment, the Nifty opened with a modest 13-point Gap Up, but the bullishness quickly vanished. The index dipped 97 points in the first minute and eventually found a base near the critical 25880 support, marking the day’s low at 25,882. After a gradual recovery to test the previous resistance levels of 25944 and 25977, the index met the same fight near the 25980 ~ 26000 zone.
The rejection from the psychological 26K mark proved decisive, pushing Nifty sharply back down toward the day’s lows. The day closed at 25,910.05, resulting in a loss of 103.40 points (or -0.40%).
This move erased all of the previous day’s gains and confirmed a clear sign of rejection at the upper levels. The move was tricky, briefly breaching the PDL and hinting at manipulation ahead of the upcoming expiry. The trend confirmation remains pending, and caution is advised.
🛡 5 Min Intraday Chart with Levels
🛡 Intraday Walk
The session was dominated by bears, right from the opening bell, despite the initial small gap-up. The sharp morning decline established the day’s direction. The mid-session saw bulls attempt to reclaim ground, but the recovery was consistently capped by strong supply near 26,000. The failure to hold this key level resulted in the late-day sell-off, closing the index back near the bottom of its trading range.
This volatile price action, marked by the day’s range engulfing the previous day’s range, strongly suggests an upcoming period of higher volatility or a potential change in the short-term trend bias.
📉 Daily Time Frame Chart with Intraday Levels
🕯 Daily Candle Breakdown
Open: 26,021.80
High: 26,029.85
Low: 25,876.50
Close: 25,910.05
Change: −103.40 (−0.40%)
🏗️ Structure Breakdown
Type: Bearish candle
Range (High–Low): ≈ 153 points — indicating higher volatility for the session.
Body: ≈ 65.25 points — clear bullish dominance for the day.
Upper Wick: ≈ ~8 points — confirming immediate rejection and almost no strength from buyers near the open.
Lower Wick: ≈ ~34 points — buyers did attempt to defend the 25880 support, but the recovery was limited.
📚 Interpretation
The strong bearish body and the close well below the open are clear indicators that the upward momentum has stalled, and selling pressure is currently dominant. The small upper wick confirms that the bearish sentiment was present from the very beginning. This candle’s large range, encompassing the previous day’s action, is often a warning sign of a shift in market sentiment.
🕯 Candle Type
Bearish Candle with Lower-Wick Support — A strong bearish signal, moderated slightly by limited buying interest near the day’s lows.
🛡 5 Min Intraday Chart
⚔️ Gladiator Strategy Update
ATR: 194.58
IB Range: 134.05 → Medium
Market Structure: Balanced
Trade Highlights:
10:47 Long Trade - Target Hit (R:R 1:4.57)
12:54 Long Trade - Target Hit (R:R 1:3.28)
14:03 Long Trade - SL Hit
Trade Summary: Despite the overall bearish market structure, the Gladiator Strategy successfully capitalized on the strong counter-trend buying attempts in the mid-session, yielding two high R:R profitable long trades. The final short trade was stopped out due to the sharp reversal back to the lows.
🧱 Support & Resistance Levels
Resistance Zones:
25944
25977
26010 ~ 26040 (Crucial Rejection Zone)
Support Zones:
25880 ~ 25865 (Current Base)
25790
25740 ~ 25715 (Ultimate Support)
🧠 Final Thoughts
“Caution is the watchword until the range is broken.”
The market has now established a high-volatility range between 26,040 (Resistance) and 25,865 (Support). I will maintain a cautious bullish sentiment only until a decisive breach and close below the lower level of 25700 occurs, or until bulls achieve a solid close above 26100. The upcoming sessions are likely to remain choppy as this indecision plays out.
✏️ Disclaimer
This is just my personal viewpoint. Always consult your financial advisor before taking any action.

Nifty levele - Nov 19, 2025Nifty support and resistance levels are valuable tools for making informed trading decisions, specifically when combined with the analysis of 5-minute timeframe candlesticks and VWAP. By closely monitoring these levels and observing the price movements within this timeframe, traders can enhance the accuracy of their entry and exit points. It is important to bear in mind that support and resistance levels are not fixed, and they can change over time as market conditions evolve.
The dashed lines on the chart indicate the reaction levels, serving as additional points of significance to consider. Furthermore, take note of the response at the levels of the High, Low, and Close values from the day prior.
We hope you find this information beneficial in your trading endeavors.
* If you found the idea appealing, kindly tap the Boost icon located below the chart. We encourage you to share your thoughts and comments regarding it.
Wishing you success in your trading activities!

NiftyBreakout retest looking strong — If price holding above 26,020-26100 zone.
If momentum sustains, next targets on radar: 26,836 → 26,926 🚀
Trendline resistance flipped to support. Bulls still in control.

Nifty levels - Nov 18, 2025Nifty support and resistance levels are valuable tools for making informed trading decisions, specifically when combined with the analysis of 5-minute timeframe candlesticks and VWAP. By closely monitoring these levels and observing the price movements within this timeframe, traders can enhance the accuracy of their entry and exit points. It is important to bear in mind that support and resistance levels are not fixed, and they can change over time as market conditions evolve.
The dashed lines on the chart indicate the reaction levels, serving as additional points of significance to consider. Furthermore, take note of the response at the levels of the High, Low, and Close values from the day prior.
We hope you find this information beneficial in your trading endeavors.
* If you found the idea appealing, kindly tap the Boost icon located below the chart. We encourage you to share your thoughts and comments regarding it.
Wishing you success in your trading activities!

Nifty Analysis EOD – November 14, 2025 – Friday🟢 Nifty Analysis EOD – November 14, 2025 – Friday 🔴
Last-Hour Bull Spike Erases Weekly Uncertainty; 170 Points Fulfilled Descending Triangle Target!
🗞 Nifty Summary
The Nifty opened the final session of the week with a significant 117.80-point Gap Down. The session started with an OL formation (Open = Low), and the initial gap was swiftly filled within the first 20 minutes. However, the market immediately fell back to the opening price, marking the beginning of an extremely volatile, range-bound day characterized by sharp 50-100 point moves. The price action successfully trapped sellers multiple times around the PDL, IB Low, and Open Price Zone. Gradually, the range tightened, forming a Descending Triangle pattern.
The entire picture shifted dramatically at 3:00 PM when this pattern triggered a powerful breakout, spiking 170 points within 10 minutes and fulfilling the pattern’s target.
The day closed at 25,910.05, near the day’s high and above the Previous Day’s Close (PDC).
This close above 25850 successfully maintains the short-term bullish momentum, setting sights on 26100 and the All-Time High (ATH) next week, provided the crucial 25750 support holds tight.
🛡 5 Min Intraday Chart with Levels
🛡 Intraday Walk
The session commenced with a deep gap-down, but the initial OL formation saw bulls immediately absorb the selling, filling the gap. However, the rest of the day was a struggle, defined by a choppy, balanced Market Structure with high volatility. The resistance near the previous day’s trading range successfully pushed the index lower repeatedly. The critical development was the formation of the Descending Triangle throughout the afternoon, reflecting consolidation and potential breakout tension. The explosive breakout at 3:00 PM caught many off-guard, demonstrating the sustained underlying buying interest and conviction to close the week strong.
📉 Daily Time Frame Chart with Intraday Levels
🕯 Daily Candle Breakdown
Open: 25,767.90
High: 25,940.20
Low: 25,740.80
Close: 25,910.05
Change: +30.90 (+0.12%)
🏗️ Structure Breakdown
Type: Small bullish candle with a long lower wick.
Range (High–Low): ≈ 199.40 points — reflecting healthy and active intraday volatility.
Body: ≈ 142.15 points — a moderately sized bullish body, demonstrating buyer dominance by the close.
Upper Wick: ≈ 30.15 points — limited profit booking near the day’s high.
Lower Wick: ≈ 27.10 points — immediate, sharp buying response from the lower levels.
📚 Interpretation
The market opened soft but confirmed buyers were present at the low (25,740). The strong, rapid close near 25,940 is the most important structural element, confirming that the bulls decisively won the weekly close battle. The overall day was active due to factors like financial/election results and the week’s end, but the final action indicates trend continuation.
🕯 Candle Type
Bullish Candle with minor rejection at highs — This is a strong continuation candle and indicates that the underlying uptrend remains intact heading into next week.
🛡 5 Min Intraday Chart
⚔️ Gladiator Strategy Update
ATR: 208.20
IB Range: 112.85 → Medium
Market Structure: Balanced
Trade Highlights:
13:44 Short Trade – SL Hit
Trade Summary: The tight, volatile, and balanced nature of the day resulted in tricky trade management. Many opportunities arise, but the system is not permitted due to Risk Reward (R:R) Rules.
🧱 Support & Resistance Levels
Resistance Zones:
25920 ~ 25944
25977 ~ 26010
26040
26100
Support Zones:
25880 ~ 25865
25790
25740 ~ 25715
🧠 Final Thoughts
“The close is not just a number; it’s a statement.”
The weekly close is firmly bullish, successfully securing the required level above 25850. The challenge for the start of the next week will be to convert the short-term 25920 ~ 25944 resistance into support. A sustained move above this zone should quickly challenge 26100. For the bears to gain control, they must push the Nifty below the 25750 level.
✏️ Disclaimer
This is just my personal viewpoint. Always consult your financial advisor before taking any action.

Nifty levels - Nov 17, 2025Nifty support and resistance levels are valuable tools for making informed trading decisions, specifically when combined with the analysis of 5-minute timeframe candlesticks and VWAP. By closely monitoring these levels and observing the price movements within this timeframe, traders can enhance the accuracy of their entry and exit points. It is important to bear in mind that support and resistance levels are not fixed, and they can change over time as market conditions evolve.
The dashed lines on the chart indicate the reaction levels, serving as additional points of significance to consider. Furthermore, take note of the response at the levels of the High, Low, and Close values from the day prior.
We hope you find this information beneficial in your trading endeavors.
* If you found the idea appealing, kindly tap the Boost icon located below the chart. We encourage you to share your thoughts and comments regarding it.
Wishing you success in your trading activities!

Nifty Analysis EOD – November 13, 2025 – Thursday🟢 Nifty Analysis EOD – November 13, 2025 – Thursday 🔴
Bulls Test 26,000, But Face Sharp Rejection, Ending Day Flat!
🗞 Nifty Summary
The Nifty commenced the session with a minor 33-point Gap Up but immediately slipped almost 100 points, finding crucial support near the 25800 zone. From the day’s low of 25,808.40, the index launched a strong, conviction-fueled upward rally, breaching key resistance levels (CPR, IBH, PDH, R1) without hesitation and pushing toward the important resistance zone of 25977.
After testing this level, Nifty struggled against the psychological 26,000 mark. Although the bulls briefly pierced it, marking a high of 26,010.70, sharp rejection and profit booking triggered a 132-point drop back toward 25880. The day closed at 25,879.15, resulting in a virtually flat close (+0.01%). The selling pressure is clearly reflected between 25977 ~ 26010.
For tomorrow’s final session of the week, bullish momentum critically relies on holding above the 25800 structural support.
🛡 5 Min Intraday Chart with Levels
🛡 Intraday Walk
The day began with immediate volatility as the initial gap-up was quickly sold into, finding a floor at the 25,808 level. This drop was swiftly negated by strong buying conviction, allowing the Nifty to charge through multiple intraday resistance bands.
The market showed peak strength between 10:00 AM and 12:00 PM, achieving the all-important 26,000 psychological level.
However, after making the high, profit booking accelerated dramatically, signaling that aggressive sellers were positioned at this zone. The resulting downtrend was steep, erasing all of the day’s significant gains and confirming a strong defense by bears near the 26,000 mark.
📉 Daily Time Frame Chart with Intraday Levels
🕯 Daily Candle Breakdown
Open: 25,906.10
High: 26,010.70
Low: 25,808.40
Close: 25,879.15
Change: +3.35 (+0.01%)
🏗️ Structure Breakdown
Type: Small-bodied neutral candle with long upper and lower shadows.
Range (High–Low): ≈ 202.30 points — signifying high intraday volatility.
Body: ≈ 26.95 points — a very small real body, reflecting strong indecision.
Upper Wick: ≈ 131.55 points — a clear rejection signal from near the 26,000 level.
Lower Wick: ≈ 70.75 points — confirming sustained buying interest from the 25,800 area.
📚 Interpretation
The index opened firm near 25,900 and successfully tested the 26,010 high, but the failure to sustain above this level is the key takeaway. Selling emerged decisively near the round-number resistance, dragging prices lower toward the 25,808 low, before a mild, indecisive recovery into the close.
The close, which is almost flat (+0.01%), indicates a significant pause in momentum after the multi-day bullish run.
🕯 Candle Type
Doji-like neutral candle (or Spinning Top) — signals indecision and a temporary equilibrium between bulls and bears.
Appearing after a significant upmove, it suggests short-term exhaustion and the necessity for consolidation or a clear break in either direction.
🛡 5 Min Intraday Chart
⚔️ Gladiator Strategy Update
ATR: 209.18
IB Range: 98.40 → Medium
Market Structure: Balanced
Trade Highlights:
09:46 Long Trade – Target Achieved (R:R 1:1.04)
10:24 Long Trade – Target Achieved (R:R 1:2.37)
12:32 Short Trade – Trailing SL Hit
Trade Summary:
The strategy capitalized on the initial two-sided volatility, successfully capturing the strong morning up-move. The afternoon’s sharp reversal led to the trailing stop loss being hit on the counter-trend short trade, reflecting the balanced yet erratic price action.
🧱 Support & Resistance Levels
Resistance Zones:
25920 ~ 25944
25977 ~ 26010 (Crucial Barrier)
26050
26100
Support Zones:
25835
25790
25715 ~ 25680
🧠 Final Thoughts
“The psychological barrier of 26,000 proved too heavy today.”
The market has now clearly defined the critical battle zone for tomorrow: 25977 ~ 26010 on the upside, and 25800 on the downside.
We need a decisive close above 26,010 to confirm the next leg up towards 26050, or a clear breakdown and sustain below 25800 to initiate profit booking towards 25715.
Avoid trading the congestion zone; wait for the breakout or breakdown confirmation.
✏️ Disclaimer
This is just my personal viewpoint. Always consult your financial advisor before taking any action.

Nifty levels - Nov 14, 2025Nifty support and resistance levels are valuable tools for making informed trading decisions, specifically when combined with the analysis of 5-minute timeframe candlesticks and VWAP. By closely monitoring these levels and observing the price movements within this timeframe, traders can enhance the accuracy of their entry and exit points. It is important to bear in mind that support and resistance levels are not fixed, and they can change over time as market conditions evolve.
The dashed lines on the chart indicate the reaction levels, serving as additional points of significance to consider. Furthermore, take note of the response at the levels of the High, Low, and Close values from the day prior.
We hope you find this information beneficial in your trading endeavors.
* If you found the idea appealing, kindly tap the Boost icon located below the chart. We encourage you to share your thoughts and comments regarding it.
Wishing you success in your trading activities!
Nifty Analysis EOD – November 12, 2025 – Wednesday🟢 Nifty Analysis EOD – November 12, 2025 – Wednesday 🔴
Bulls Advance, But Pause at the Gate: 25920 Proves to be a Fortress!
🗞 Nifty Summary
The Nifty continued its strong bullish journey with a massive 117-point Gap Up, opening above the previous day’s high and confirming a clear continuation of positive sentiment. While the index successfully reached and tested the target of 25920 outlined in yesterday’s commentary, it was unable to sustain the breakout. The slow, zigzag movement into this key resistance zone suggests supply is aggressively defending the 25920 ~ 25940 range. The close at 25,875.80 is still structurally bullish, sitting above the prior week’s high, but the bulls must find conviction to conquer the 25920 hurdle to unlock the next 26050 ~ 26100 expansion.
🛡 5 Min Intraday Chart with Levels
🛡 Intraday Walk
The session commenced with a powerful 117-point Gap Up, immediately absorbing the aggressive buying from the previous session. Following a brief 40-point retrace that tested the 25790 support, Nifty sharply jumped around 80 points to the next resistance band of 25865. The index then consolidated with a slight pause between 25865 ~ 25880 before attempting a push toward 25920. This final leg of the upward journey was notably slow, characterized by smaller candles and a zigzag micro-trend, indicating diminishing conviction and resistance from sellers. The high was marked at 25,934.55 before the index pulled back slightly to close just below the key structural resistance.
📉 Daily Time Frame Chart with Intraday Levels
🕯 Daily Candle Breakdown
Open: 25,834.30
High: 25,934.55
Low: 25,781.15
Close: 25,875.80
Change: +180.85 (+0.70%)
🏗️ Structure Breakdown
Type: Bullish candle with moderately long, balanced wicks.
Range (High–Low): ≈ 153.40 points — a tighter range than yesterday, suggesting consolidation.
Body: ≈ 41.50 points — smaller body size, reflecting a loss of directional dominance near the close.
Upper Wick: ≈ 58.75 points — indicating sellers defending the upper resistance band (25920+).
Lower Wick: ≈ 53.15 points — confirming sustained buying interest on intraday dips.
📚 Interpretation
The candle is essentially a Bullish Spinning Top, representing indecision or a temporary equilibrium near a major resistance area. While the overall close is positive (a higher high and a higher close), the relatively balanced wicks show strong two-way action. Buyers pushed aggressively, but sellers successfully capped the high at 25,934, confirming that the 25920-25940 zone is a significant supply barrier.
🕯 Candle Type
Bullish Spinning Top — A continuation candle but signals a necessary pause before the next major move. It confirms the need for a decisive breakout before further vertical expansion.
🛡 5 Min Intraday Chart
⚔️ Gladiator Strategy Update
ATR: 209.94
IB Range: 80.05 → Medium
Market Structure: ImBalanced
Trade Highlights:
10:34 Long Trade – Target Achieved (R:R 1:1.64)
Trade Summary: The strategy capitalized successfully on the initial bullish continuation move following the gap-up. The lower volatility day, indicated by the medium IB range, limited the overall high R:R opportunities, but the core long trend was managed profitably.
🧱 Support & Resistance Levels
Resistance Zones:
25920 ~ 25944 (Crucial Barrier)
25977
26050
26100
Support Zones:
25835
25790
25715 ~ 25680
🧠 Final Thoughts
“The market rewards the patient general, not the emotional soldier.”
Tomorrow’s session promises to be a tricky battlefield for intraday players. The current resistance at 25920 ~ 25944 is the gatekeeper.
Discipline is paramount:
either wait for a decisive, sustained breach and hold above 25920 for the continuation long trade, or wait for the market to fail the PDL and execute the counter-trend short trade with targets at 25715 ~ 25680. Don’t chase the slow moves—wait for confirmation at the structural levels.
✏️ Disclaimer
This is just my personal viewpoint. Always consult your financial advisor before taking any action.

Nifty levels - Nov 13, 2025Nifty support and resistance levels are valuable tools for making informed trading decisions, specifically when combined with the analysis of 5-minute timeframe candlesticks and VWAP. By closely monitoring these levels and observing the price movements within this timeframe, traders can enhance the accuracy of their entry and exit points. It is important to bear in mind that support and resistance levels are not fixed, and they can change over time as market conditions evolve.
The dashed lines on the chart indicate the reaction levels, serving as additional points of significance to consider. Furthermore, take note of the response at the levels of the High, Low, and Close values from the day prior.
We hope you find this information beneficial in your trading endeavors.
* If you found the idea appealing, kindly tap the Boost icon located below the chart. We encourage you to share your thoughts and comments regarding it.
Wishing you success in your trading activities!

Nifty levels - Nov 12, 2025Nifty support and resistance levels are valuable tools for making informed trading decisions, specifically when combined with the analysis of 5-minute timeframe candlesticks and VWAP. By closely monitoring these levels and observing the price movements within this timeframe, traders can enhance the accuracy of their entry and exit points. It is important to bear in mind that support and resistance levels are not fixed, and they can change over time as market conditions evolve.
The dashed lines on the chart indicate the reaction levels, serving as additional points of significance to consider. Furthermore, take note of the response at the levels of the High, Low, and Close values from the day prior.
We hope you find this information beneficial in your trading endeavors.
* If you found the idea appealing, kindly tap the Boost icon located below the chart. We encourage you to share your thoughts and comments regarding it.
Wishing you success in your trading activities!

Nifty Analysis EOD – November 10, 2025 – Monday🟢 Nifty Analysis EOD – November 10, 2025 – Monday 🔴
Bullish Breakout Sustained — Can Buyers Target the Next Major Zone?
🗞 Nifty Summary
Nifty continued its recovery, successfully breaching and closing above the previous day’s high (PDH), signaling strong follow-through. Despite giving up half of the day’s gains in a volatile final hour, the index settled at 25574.25, confirming that bulls remain in control of the short-term sentiment.
This session effectively formed an Open=Low (OL) structure (ignoring a minor 6-point shadow), reflecting strong conviction from the open. To maintain this bullish momentum, bulls must decisively close above 25650 and aim for 25790. Should momentum falter, holding the 25400 level is critical for survival in the current structural battle.
🛡 Intraday Walk
The session commenced with a flat to positive bias, immediately spiking 70 points within the first minute to breach the PDH and R1, marking an initial day high at 25591.45. This initial surge could not be held, leading to a brief slip back toward the session’s opening level.
From there, a strong and gradual ascent began, successfully clearing the PDH, R1, and CDH. Nifty then crossed the Important Resistance Zone of 25615 ~ 25635, establishing a new intraday peak at 25651.95.
After marking this high, Nifty entered a tight consolidation phase for the next 2 hours and 15 minutes, ranging narrowly between 25652 ~ 25620. This equilibrium was shattered at 13:40, triggering a breakdown and a surge in volatility. A sharp, sudden fall and immediate recovery from the mean level likely trapped many short-term traders.
A final attempt to breach the day high failed, and bears took charge, dragging the index down by around 87 points, pushing it below the mean and IB High. Ultimately, Nifty surrendered half of its morning gain, but closed convincingly at 25574.25, above the previous day’s high.
🛡 5 Min Intraday Chart with Levels
📉 Daily Time Frame Chart with Intraday Levels
🕯 Daily Candle Breakdown
Open: 25,503.50
High: 25,653.45
Low: 25,503.50
Close: 25,574.35
Change: +82.05 (+0.32%)
🏗️ Structure Breakdown
Type: Bullish candle with a relatively narrow body but clean structure.
Range (High–Low): ≈ 149.95 points — a modest intraday movement.
Body: ≈ 70.85 points — reflective of a steady upward close.
Lower Wick: No lower wick → buying strength evident from the very start of the session (Open = Low).
Upper Wick: Small upper wick → mild profit booking near the top, but buyers held control until the close.
📚 Interpretation
The day opened precisely at the session’s low, signaling that sellers had zero conviction from the start. Prices sustained gains throughout the session, closing well above the midpoint of the range. This structure indicates controlled, steady buying throughout the majority of the day—a powerful sign of returning confidence and structural strength following last Friday’s reversal.
🕯 Candle Type
This session formed a Bullish Marubozu variant (Open = Low, strong close). It reflects decisive bullish sentiment, often acting as a continuation signal or early confirmation after a period of consolidation.
🛡 5 Min Intraday Chart
⚔️ Gladiator Strategy Update
ATR: 199.99
IB Range: 80.45 → Medium
Market Structure: ImBalanced
Trade Highlights:
09:35 Long Trade – Target Achieved (R:R 1:2.38)
13:05 Short Trade - Target Achieved (R:R 1:3.14)
Trade Summary: The Gladiator Strategy successfully captured the initial bullish momentum and later capitalised on the profit-booking phase, securing two high-R:R exits.
🧱 Support & Resistance Levels
Resistance Zones:
25585
25615 ~ 25635
25680
25715
25790
Support Zones:
25550
25510
25460 ~ 25440
🧠 Final Thoughts
“When the market opens at the low and stays there, you are looking at commitment, not doubt.”
Today’s Open=Low structure was a clear continuation signal, teaching us that conviction often trumps recent volatility. The primary lesson is that while consolidation (like the midday range) can be boring, the breakout (or breakdown) that follows is where the most powerful trades are found. For motivation, remember that even a strong bullish day offers tactical counter-trend opportunities, as proven by the successful late-day short trade.
✏️ Disclaimer
This is just my personal viewpoint. Always consult your financial advisor before taking any action.

Nifty levels - Nov 11, 2025Nifty support and resistance levels are valuable tools for making informed trading decisions, specifically when combined with the analysis of 5-minute timeframe candlesticks and VWAP. By closely monitoring these levels and observing the price movements within this timeframe, traders can enhance the accuracy of their entry and exit points. It is important to bear in mind that support and resistance levels are not fixed, and they can change over time as market conditions evolve.
The dashed lines on the chart indicate the reaction levels, serving as additional points of significance to consider. Furthermore, take note of the response at the levels of the High, Low, and Close values from the day prior.
We hope you find this information beneficial in your trading endeavors.
* If you found the idea appealing, kindly tap the Boost icon located below the chart. We encourage you to share your thoughts and comments regarding it.
Wishing you success in your trading activities!

Nifty Spot for 10-14 Nov 2025Nifty Spot on last friday pulled back from a breakout retest near 25300
Global cues are mixed today morning
But for the whole week 25617.95 on Nifty spot will be a make or break level.
though the trend is sell on rise
NS can find its first hurdle near 25885
Concentrate on
25600 CE & 25600 PE - likely to be most liquid strike prices for this week
Will share above options analysisin following charts.
Like & Share so many can benefit.

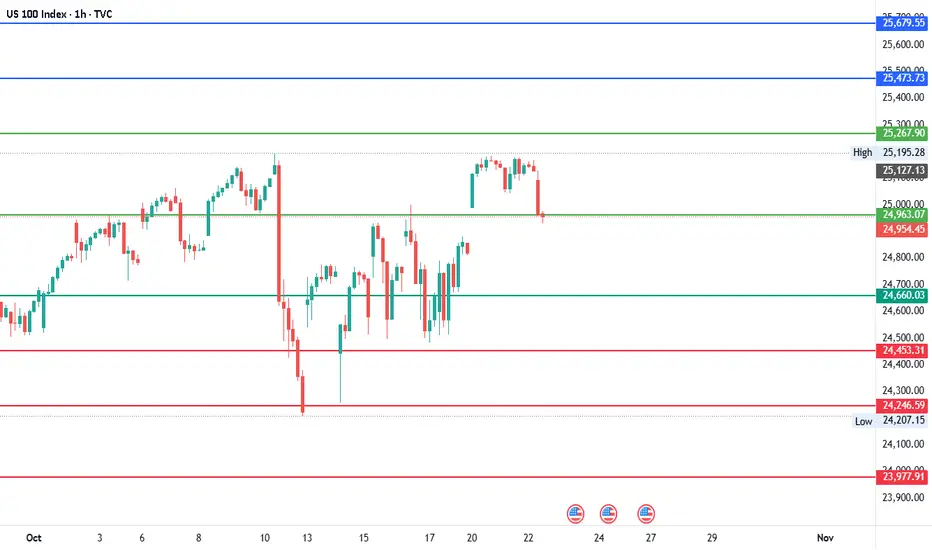
#NDQ - Short-term Range $26,216 - $23,709 | 1000 Points Move?Date: 22-10-2025
#NDQ - Current Price: $24,963.00
Pivot Point: $24,963.07 Support: $24,660.03 Resistance: $25,267.90
Upside Levels:
L1: $25,473.73 L2: $25,679.55 L3: $25,948.23 L4: $26,216.91
Downside Levels:
L1: $24,453.31 L2: $24,246.59 L3: $23,977.91 L4: $23,709.23
#TradingView #Nifty #BankNifty #DJI #NDQ #SENSEX #DAX #USOIL #GOLD #SILVER