Massive Gap-up on expected lines, Which way will Nifty go now?After Maharashtra results as expected Nifty gave a gap up opening and sustained above an important level to close the day but can the rally sustain or will it fizzle out. If Nifty can consolidate in the range and cross the important resistance of 24360 while holding the ground above 200 hours EMA of Father line at 24213 we can see a really very bullish rally in Nifty.
The supports for Nifty remain at 24213, 24135, 23948 and finally 23821. Below 23821 which is the 50 Hours EMA or the Mother line the rally may Fizzle out and bears will again dominate the scene. Resistnace for Nifty remain at 24369 important trend line resistance, 24530, 24673 and 24893 before we gain 25K levels and we can move ahead. Above 25K we will be in a predominantly Bullish territory again.
To know more about Mother and Father lines, trend lines and supports and resistances mentioned in the message and to find them on your own in addition to knowing more about Techno-Funda investing in a nutshell you can read my book The Happy Candles way to Wealth creation available on Kindle and Google Playbook in E-version and on Paperback edition on Amazon. It is one of the highest rated books in that category.
Disclaimer: The above information is provided for educational purpose, analysis and paper trading only. Please don't treat this as a buy or sell recommendation for the stock. We do not guarantee any success in highly volatile market or otherwise. Stock market investment is subject to market risks which include global and regional risks. We will not be responsible for any Profit or loss that may occur due to any financial decision taken based on any data provided in this message.
Niftylevels

Nifty Prediction for 26th November 2024Nifty Prediction for 26th November 2024
nifty moments for intraday and option trading
The benchmark index showed significant upward momentum, driven by gains across all sectors. This rally was largely influenced by the NDA's victory in the Maharashtra state elections, which boosted investor confidence. On Monday, the
Nifty index surged by 314 points, closing at 24,221.90. The session began with an upside gap, and early buying extended the pullback rally. However, the index lost some of its election-driven momentum, retreating slightly from its intraday high of 24,351 and forming like a Doji candlestick pattern on the daily chart.
Despite the slight retreat, the Nifty confirmed a breakout of the Falling Channel pattern with a gap-up opening and sustained levels above the Middle Bollinger Band, indicating a bullish setup for the near term. Momentum indicators further supported this outlook, with the RSI recovering sharply from the oversold zone and showing a positive crossover. Additionally, the MACD exhibited a positive crossover, reinforcing the potential for a reversal.
Traders are advised to maintain a positive bias as long as the Nifty remains above the 24,000 mark. On the upside, if the index sustains levels above 24,350, it could potentially move higher toward the 24,500 and 24,700 levels.

NIFTY : Trading Levels and Plan for 26-Nov-2024Trading Plan for NIFTY - 26th November 2024
Previous Day's Chart Analysis:
NIFTY showed a volatile movement after hitting day high at 25351, and closed near resistance zone that I had already highlighted in yesterdays plan. (highlighted in Yellow ) within the "No Trade Zone," respecting the resistance at 24,432 and support near 24,243 . Bullish momentum ( Green ) was seen towards the upper resistance zones, while bearish ( Red ) price action retraced near the support zones. The key levels of 24,609 (Profit Booking Zone) and 24,041 (Best Buy Zone at Retracement) acted as crucial points for traders.
Trading Plan for 26th November 2024:
Gap-Up Opening (Above 24,432):
If NIFTY opens with a Gap-Up above the critical resistance of 24,432 , it is crucial to observe the price behavior near 24,609 .
A sustained breakout above 24,609 indicates bullish continuation, targeting higher levels.
However, if rejection is observed near 24,609 , a pullback towards 24,432 is likely, which could act as support. Wait for a retest before entering long positions.
Flat Opening (Near 24,250):
A flat opening within the "No Trade Zone" requires patience.
A breakout above 24,325 (upper range of the zone) signals bullish momentum, with targets of 24,432 and beyond.
Conversely, a breakdown below 24,243 could lead to bearish moves targeting 24,105.95 and 24,041 . Avoid trading within the zone to minimize false signals.
Gap-Down Opening (Below 24,243):
A Gap-Down opening below 24,243 will turn the focus to key support levels.
If prices stabilize near 24,105.95 or 24,064.15 , look for signs of recovery to enter long trades.
Failure to hold these supports could trigger further bearish moves towards 23,899 . Aggressive traders can short with tight stop losses.
Risk Management Tips for Options Trading:
Avoid aggressive positions during the first 30 minutes of opening to let the trend settle.
Use strict stop losses and avoid over-leveraging.
Monitor the option's premium decay and implied volatility if the price remains within the "No Trade Zone."
Diversify between directional and non-directional strategies depending on market conditions.
Summary & Conclusion:
The key to successful trading lies in patience and discipline. Focus on the levels discussed ( 24,609 , 24,432 , 24,041 ) for directional trades, and avoid trading within the "No Trade Zone" ( 24,325–24,243 ) to prevent unnecessary risks. Both bullish ( Green ) and bearish ( Red ) scenarios offer opportunities, provided traders respect the levels and manage their risks effectively.
Disclaimer:
I am not a SEBI-registered analyst. The above analysis is for educational purposes only. Please consult with your financial advisor before making any trading decisions.

#NIFTY Intraday Support and Resistance Levels - 25/11/2024Higher gap up opening in nifty near 24300 level. After opening if nifty starts trading above 24350 level then this bullish rally continue towards the 24550 level in today's session. Downside 24050 will act as a strong support for today's session. Any major downside now only expected below 23950 level.

Nifty 26th Nov 2024Date 26 Nov 2024
TIme 9:15 am IST
BIAS
Monthly-Bearish
Weekly-Bearish
Daily-Bearish
4hr-Not Sure
1hr-Not Sure
TRADE
GAP UP- Wait and watch. Possibility of fall if fresh buying does nto set in.
GAP DOWN-Wait and watch. Look for Call trade with small position size and targets.
ll trades to have small positions and book profits fasters. Dont load up for riding trades.

NIFTY : Trading Levels for 25-Nov-2024Nifty Trading Plan for 25-Nov-2024
Introduction:
In the previous session, Nifty displayed a recovery after testing lower support levels mentioned in plan and closed near day high, with buyers stepping in near the retracement zone ( Green ). The index faced resistance in the 23,873–23,920 range ( Yellow ), leading to sideways movement. For today, the market behavior will depend on how Nifty reacts to key levels, with breakout potential to 24,261 or breakdown risks toward 23,411 .
Trading Scenarios for 25-Nov-2024:
Gap-Up Opening (100+ points):
If Nifty opens above 23,920 , the focus will be on the immediate resistance level at 24,261 :
A breakout above 24,261 could lead to a strong bullish trend, with potential targets at 24,350 and beyond. Look for price consolidation above 24,261 before entering long trades.
Failure to sustain above 24,261 may result in a pullback toward 23,873 , offering a short-term reversal opportunity.
Wait for confirmation of the breakout before entering trades to avoid whipsaws.
Flat Opening:
A flat opening near 23,873 will bring the "Opening Support / Resistance Zone" ( 23,845–23,920 ) into focus:
A bullish breakout above 23,920 could target 24,261 as the next resistance.
A bearish breakdown below 23,845 may trigger selling pressure toward 23,759 or 23,684 .
Avoid trading within the range ( 23,845–23,920 ) until the trend direction becomes clear.
Gap-Down Opening (100+ points):
If Nifty opens below 23,759 , the immediate support lies at 23,684 , followed by 23,605 :
A breakdown below 23,605 may lead to accelerated selling, targeting 23,411 . Monitor volume and price action for confirmation.
A bounce from 23,684 or 23,605 could indicate a recovery, with potential upside back to 23,759 and 23,845 .
Be cautious, as a gap-down opening may lead to heightened volatility.
Risk Management Tips for Options Trading:
Use strike prices close to the spot price for better liquidity and responsiveness.
Implement strict stop-losses based on support and resistance zones.
Avoid trading during the initial 15-30 minutes after market opening, as volatility may produce false signals.
Limit your position size to manage risk effectively during uncertain market conditions.
Summary and Conclusion:
Nifty is at a critical juncture with key levels at 23,920 and 23,845 acting as immediate resistance and support. A breakout above 23,920 could drive bullish momentum, while a breakdown below 23,845 may lead to bearish continuation. Follow the trading plan and avoid impulsive trades. Always prioritize risk management to safeguard capital.
Disclaimer: I am not a SEBI-registered analyst. The analysis shared is for educational purposes only. Please consult your financial advisor before making any trading decisions.

Nifty moments for intraday and option trading 25/Nov/2024Nifty moments for intraday and option trading 25/Nov/2024
follow us for more updates and information.

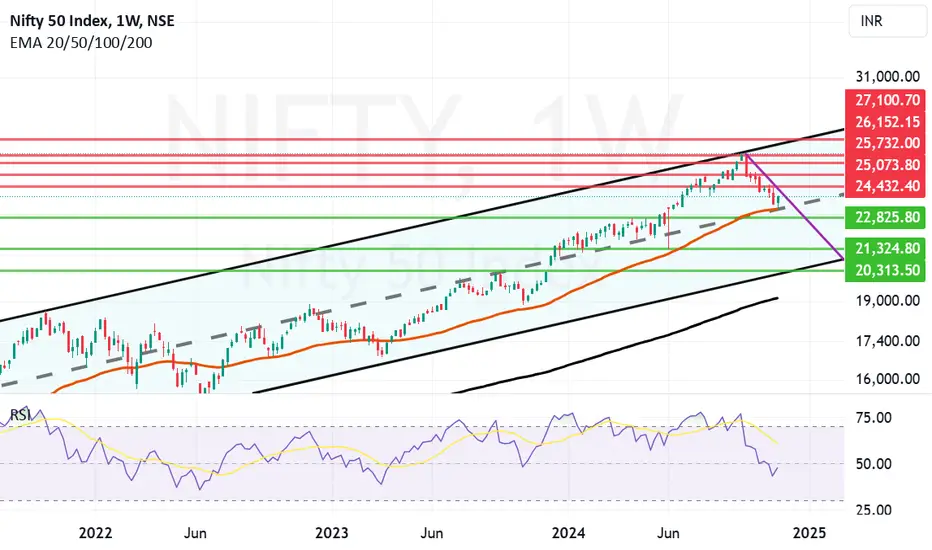
Nifty might be turning corners if there is no further bad news.The medium term outlook of Nifty is that it might be turning corners if there is no further bad news on Global or Local front. RSI is also turning in the positive or bullish zone. 23251 which was the 50 Weeks EMA or the mother line was almost taken and Nifty took a support at exactly mid channel support. This level be the key going forward. In the monthly closing or thereafter if this support is broken then we might see a bear attack once again. In such a scenario next supports will be at 22825. If this support is broken the next supports will be at 21324, 20313 or even 19133 in case of a global catastrophe of some unexpected even from Ukraine / Russia / Iran / Israel front. As of now 23251 seems to be the bottom. The medium term resistances on the upper side remain at 24432, 25073, 25732 and 26152 before Nifty gains previous highs. Nifty channel top currently seems at 27100 levels. There will be a lot of consolidation and it will take a long time before we reach there (2 to 6 or more months). Difficult to predict exact time frame due to lot of uncertainties on the local and global front.
#NIFTY Intraday Support and Resistance Levels - 22/11/2024Gap up opening expected in nifty near 23450 level. After opening possible it will face resistance at this level and reversal towards the downside upto 23200 support level. Major upside rally expected if nifty starts trading and sustain above 23550 in today's session. This upside rally can be goes upto 23750+ level.

NIFTY : Trading Levels for 22-11-2024Nifty Trading Plan for 22-Nov-2024
Introduction:
In the previous session, With a Opening Drop in Nifty displayed a consolidation pattern near the support zone with a lack of strong follow-through on either side. The index closed near 23,346.75, hinting at indecision among traders. Key levels have been identified for today's trading, with distinct zones marked: Yellow for sideways movements, Green for bullish trends, and Red for bearish trends.
Trading Scenarios for 22-Nov-2024:
Gap-Up Opening (100+ points):
If Nifty opens above 23,414 , it will likely face resistance near 23,522 . Look for price action in this zone:
If rejection occurs at 23,522 , a retracement towards the 23,414 level is possible, offering a shorting opportunity.
If an hourly candle sustains above 23,522 , it can target the next resistance at 23,669 .
Wait for clear breakouts or rejections before entering trades. Avoid chasing prices in a strong gap-up scenario to minimize risk.
Flat Opening:
In case of a flat opening near 23,346 , monitor the immediate support at 23,295 :
A breakdown below 23,295 can lead to a bearish move towards 23,231 .
If Nifty holds the 23,346 level and moves above 23,414 , a bullish momentum toward 23,522 is likely.
Trade cautiously in the flat opening zone, as the initial price action might remain range-bound.
Gap-Down Opening (100+ points):
If Nifty opens below 23,231 , the 23,120 support zone will be crucial:
A breach of 23,120 could trigger a sharp sell-off towards 22,986 .
If prices reverse from the 23,120 level, expect a recovery rally back to 23,231 or 23,295 .
Watch for rejection or reversal candlestick patterns at these levels before entering trades.
Risk Management Tips for Options Trading:
Avoid trading during the first 15 minutes of market opening to let volatility settle.
Use defined stop losses based on hourly candle closings.
Focus on at-the-money options for higher liquidity and better premiums.
Limit your risk to 1-2% of your total trading capital per trade.
Summary and Conclusion:
The market's direction today hinges on how it reacts to key levels around 23,414 (resistance) and 23,295 (support). Keep an eye on broader trends and ensure to wait for confirmation signals before initiating trades. Practice strict risk management to safeguard against market volatility.
Disclaimer: I am not a SEBI-registered analyst. The above analysis is for educational purposes only. Please consult your financial advisor before making any investment or trading decisions.

#NIFTY Intraday Support and Resistance Levels - 21/11/2024Flat opening expected in nifty in between consolidation zone of 23450-23550 level. After opening if any side breakout of this zone can gives strong rally towards the breakout direction. If nifty starts trading below 23450 level then strong downside expected in nifty upto 23200 level. Further bullish rally only expected if nifty sustain above 23550 level.

NIFTY : Trading Levels and Plan for 21-Nov-2024Nifty Trading Plan for 21-Nov-2024
Intro:
On 20-Nov-2024, Nifty displayed a volatile session, with the index struggling to sustain above 23,712 , the last intraday resistance. A yellow-shaded "No Trade Zone" highlighted indecisive price action between 23,561 and 23,622 . The index tested support near 23,296 , which aligns with an SMC entry zone and buyer’s support after a liquidity sweep. The green trend depicted potential bullish moves, while the red trend reflected bearish reversals, helping traders prepare for possible outcomes in the upcoming session.
Trading Plan for 21-Nov-2024:
Gap Up Opening (100+ points above 23,561):
If Nifty opens above 23,622 , monitor for a breakout above 23,712 . Sustained movement here could target the Profit Booking Zone (23,815–23,860) .
Wait for the first 15–30 minutes to gauge market direction.
Failure to hold above 23,622 might indicate a reversal, pushing the index back into the "No Trade Zone."
Flat Opening (Near 23,561):
A flat opening within the "No Trade Zone" requires patience. Look for a breakout above 23,622 to go long, targeting 23,712 .
A breakdown below 23,468 may trigger bearish momentum toward 23,296 or lower.
Avoid entering trades in the yellow-shaded zone to reduce risk from whipsaws.
Gap Down Opening (100+ points below 23,468):
A gap down below 23,441 may result in bearish momentum towards 23,296 , where buyers could provide support.
If 23,296 holds, watch for a pullback toward 23,468 or higher.
A breakdown below 23,296 could open doors to deeper bearish moves, targeting 22,964 . Use tight stop-losses for short positions.
Risk Management Tips for Options Traders:
Use stop-losses based on the hourly candle close to avoid getting trapped by intraday volatility.
Avoid trading large positions in the "No Trade Zone"; focus on directional confirmation.
For gap openings, consider strategies like spreads to manage premiums and volatility.
Limit risk to 1–2% of your capital per trade to safeguard against sudden market moves.
Summary and Conclusion:
Key levels to watch are 23,712 on the upside and 23,296 on the downside.
Trade cautiously within the "No Trade Zone" ( 23,561 – 23,622 ).
Let the price action guide your trades, with trends expected to be influenced by intraday volatility.
Disclaimer:
I am not a SEBI-registered analyst. This trading plan is for educational purposes only. Traders are advised to conduct their analysis or consult a financial advisor before making any trading decisions.

NIFTY50 Trend and Key Levels To WatchNifty 50 has corrected almost 10% from its peak. Sentiment across the world is bearish. However, it may likely to hold 23000 levels. Incase it broke 23000, then you may witness blood bath.
Moreover, above 24550 Nifty trend may reverse its current trend.
It has multiple resistance based on fibo levels, price action resistance.
Its first hurdle is 23870-23900

#NIFTY Intraday Support and Resistance Levels - 19/11/2024Gap up opening expected near 23550 level in nifty. After opening if it's starts trading and sustain above 23550 level then strong bullish rally expected. 23450-23550 levels are the consolidation range for nifty. Downside movement expected below 23450 level and this rally can goes upto 23200 level in case nifty starts trading below 23450 level.

NIFTY : Trading Levels and Plan for 19-Nov-2024Trading Plan for 19-Nov-2024
Intro: Previous Day’s Chart Analysis
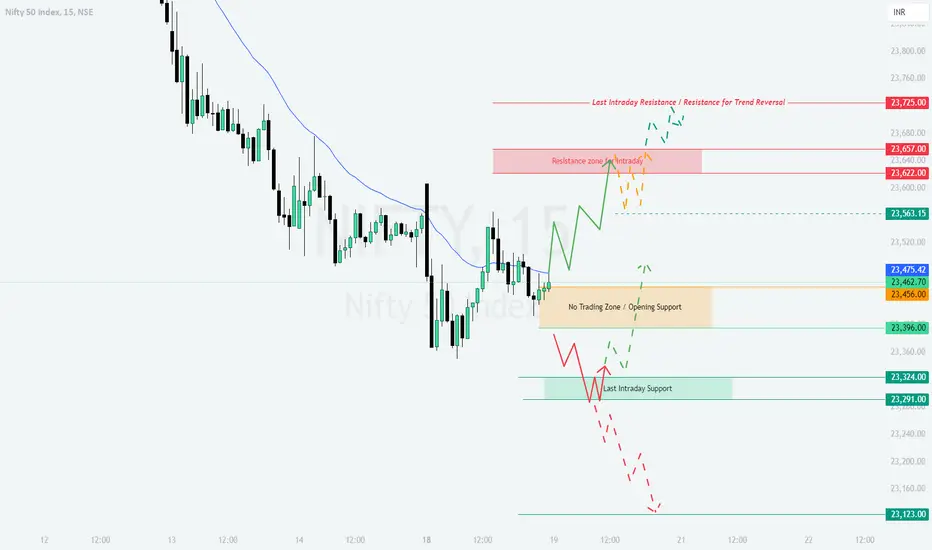
On 18-Nov-2024, the market exhibited a mix of bullish recovery and consolidation. Yellow regions indicated sideways movement, suggesting indecision in the market. Green zones demonstrated bullish recovery attempts, while Red zones highlighted bearish breakdown scenarios. Intraday resistance at 23,725 played a key role in limiting gains, while support at 23,324 helped prevent a deeper sell-off.
Gap-Up Opening Scenario (+100 Points or More):
If Nifty opens around 23,600–23,700 , look for rejection near the resistance zone at 23,657 . Wait for a confirmation candle before entering short positions, targeting the 23,456 support.
If momentum sustains above 23,657 , expect bullish continuation towards 23,725 . Initiate longs after a retest of 23,657 , with a stop loss at 23,600 .
Avoid initiating trades if Nifty stays within 23,657–23,725 without a clear breakout or breakdown.
Flat Opening Scenario (+/- 50 Points):
A flat open near 23,462–23,475 would place the market in the No Trading Zone . Observe price action in this zone to gauge direction.
If the index breaks below 23,456 , short with targets at 23,396 and 23,324 , maintaining a stop loss at 23,475 .
For bullish setups, a breakout above 23,475 could lead to a move toward 23,657 , with stop losses placed at 23,450 .
Gap-Down Opening Scenario (-100 Points or More):
If Nifty opens near 23,324–23,350 , monitor for a pullback to 23,396 . Short positions can be initiated on rejection at 23,396 , targeting 23,291 and 23,123 .
A strong recovery above 23,396 could indicate bullish reversal potential. Longs can be considered after confirmation, with targets at 23,475 .
For aggressive selling, watch for a breach below 23,291 , which may trigger further downside to 23,123 . Use tight stop losses to manage risk.
Risk Management Tips for Options Trading:
Avoid chasing trades immediately after the opening bell; let the first 15–30 minutes establish a clear trend.
Use stop losses based on hourly candle closes to reduce the impact of market noise.
Limit position sizes in volatile zones and avoid holding positions into key economic events.
Keep track of implied volatility (IV) levels to assess premium pricing; avoid overpaying for options.
Summary and Conclusion:
The market's reaction near critical levels such as 23,657 (resistance) and 23,324 (support) will determine the trend for the day. Bullish momentum above 23,657 could target 23,725 , while failure to hold 23,324 may lead to a retest of 23,123 . Follow disciplined trading, and remember that patience and risk management are key to navigating uncertain conditions.
Disclaimer: I am not a SEBI-registered analyst. All information provided is for educational purposes only. Traders are advised to conduct their own research or consult a financial advisor before making any investment decisions.
Nifty near Mid channel & 50 Weeks EMA (Mother Line) support. Nifty after closing below the 200 days EMA Father line on daily charts, may find support near 50 weeks EMA (Mother line of Weekly chart). The 50 weeks EMA is at 23233.
Before reaching there today's low of 23350 will also be a support. If by chance both these levels are broken the mid channel support for Nifty seems to be at at 22800 zone. Below which the bears have potential to drag Nifty further down to 22500 or even below 22K levels. To know more about Parallel channels and how they work or my Mother Father small child theory you can read my book The Happy candles way to wealth creation. Available in Paperback or E-version on Amazon and Google Play book.
Resistances for Nifty on the upper side are at 23658, 24122, 25012 and 25898. Above 25989 Nifty will aim to make a new all time high again as channel top currently seems to be near 27K. RSI is also suggesting that Nifty can make a substantial come back any time now.
Bollinger band lower band width has been pierced today both in daily chart as well as weekly chart indicating that market is heavily oversold and short covering can lead to a moderate recovery or substantial recovery sooner than later. The signs of bottom formation are clear unless FIIs begin another round of aggressive selling. The selling by FII has been continuous but seems to have decreased in the last few sessions rising further hopes for recovery.
Disclaimer: The above information is provided for educational purpose, analysis and paper trading only. Please don't treat this as a buy or sell recommendation for the stock. We do not guarantee any success in highly volatile market or otherwise. Stock market investment is subject to market risks which include global and regional risks. We will not be responsible for any Profit or loss that may occur due to any financial decision taken based on any data provided in this message.

In Depth Analysis for Nifty 50 Index (1-Hour Chart)Symbol: Nifty 50
Timeframe: 1-Hour
---
Technical Analysis:
The Nifty 50 index is currently trading at 23,559.60, moving within a well-defined downward-sloping channel. The price is nearing a crucial support zone (23,480-23,570), which could act as a potential area for a short-term bounce. However, the overall trend remains bearish unless a breakout occurs above the resistance levels.
---
Key Observations:
1. Trend: The index is clearly in a downtrend, forming lower highs and lower lows within the channel. The bearish sentiment remains dominant.
2. Support & Resistance:
Immediate Support: 23,480-23,570. A breakdown below this level could lead to further downside toward 23,200.
Immediate Resistance: 24,070-24,540. These levels correspond to the midline and upper boundary of the channel.
3. Volume Analysis: Declining volumes on the recent down move indicate a potential loss of selling momentum, suggesting the possibility of a short-term pullback.
4. Potential Reversal Zone:
A break above 24,070 could trigger a short-covering rally, pushing prices toward 24,540.
---
Trade Setup:
1. For Bulls:
Entry: Consider going long near 23,480-23,570, provided there are bullish reversal signals like a hammer or bullish engulfing candle.
Target: 24,070, and an extended target of 24,540.
Stop Loss: Below 23,450, to minimize downside risk.
2. For Bears:
Entry: Look for shorting opportunities on rejection near 24,070 or at the channel’s upper boundary (24,540).
Target: 23,480 and further downside to 23,200.
Stop Loss: Above 24,600.
---
Potential Scenarios:
1. Bullish Breakout: A decisive close above 24,070 will confirm a breakout from the channel, opening doors for a move toward higher levels.
2. Continuation of Downtrend: If the index fails to hold the 23,480 support, it could continue its bearish trajectory to 23,200.

Nifty Update , BankNifty Update and Tata Motors UpdateHello Traders ,
Checkout the update on Nifty , BankNifty and Tata Motors. Also checkout our previous analysis to know our accuracy level

Nifty and Banknifty Levels for 18th NovNifty and Banknifty Levels for 18th Nov
Please refer charts for key levels

NIFTY - Trading Levels and Plan for 18-Nov-2024** Nifty Trading Plan for 18-Nov-2024 **
Previous Day Overview:
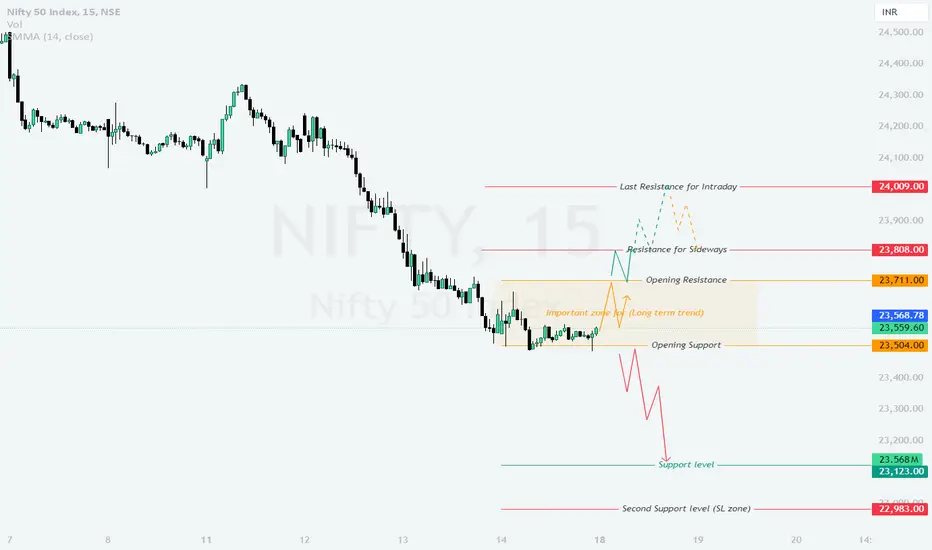
On 17-Nov-2024, Nifty displayed a consolidative pattern near the Important Zone for Long-Term Trend at 23,711 , signaling indecision among traders. The chart highlights three key trends: Yellow showing a sideways movement, Green representing bullish attempts facing resistance near 23,808 , and Red depicting bearish pullbacks testing support at 23,504 . The session emphasizes the significance of these levels in determining market direction.
---
** Opening Scenarios: **
Gap Up Opening (100+ points above)
If Nifty opens above 23,808 , it could test the Last Resistance for Intraday at 24,009 . Monitor the price action in the first 15-30 minutes for consolidation near 23,900 . A sustained breakout above 24,009 could indicate strong bullish momentum. Avoid chasing trades in case of high volatility; instead, wait for a retest of 23,808 as support for a safer entry point.
Flat Opening (within ±50 points)
A flat opening near 23,559 may provide a clearer picture of market sentiment. If Nifty holds above the Opening Resistance at 23,711 , a bullish move toward 23,808 is likely. Conversely, a breakdown below 23,568 could lead to a retest of the Opening Support at 23,504 . Prioritize risk management, as a flat opening could result in sideways movement initially.
Gap Down Opening (100+ points below)
A gap-down opening near 23,504 will shift focus to the Support Level at 23,123 . Allow the first 30 minutes for price stabilization; if Nifty sustains below 23,504 , expect a bearish move toward 23,123 . However, a quick recovery above 23,504 may present a reversal trade opportunity targeting 23,711 .
---
** Risk Management Tips for Options Trading :**
- Use well-defined stop-loss levels, preferably based on hourly candle closes, to avoid unnecessary losses.
- Reduce position sizes when trading gap openings to manage volatility risks effectively.
- Opt for at-the-money (ATM) or slightly out-of-the-money (OTM) options for better liquidity and quicker premium adjustments.
- Avoid over-leveraging, especially in highly volatile market conditions.
---
** Summary & Conclusion :**
For 18-Nov-2024, the key levels to monitor are 23,711 on the upside and 23,504 on the downside. A breakout above 23,808 could signal bullish momentum, while a breach below 23,504 may indicate bearish pressure. The market remains poised for both sideways and directional moves, depending on the opening scenario.
---
**Disclaimer:**
I am not a SEBI-registered analyst. This trading plan is for educational purposes only. Traders are advised to conduct their own analysis or consult with a financial advisor before making any trading decisions.
Nifty at cross road of critical support. Nifty this week gave a closing at 23532 a fraction below 200 days EMA or Father line which was at 23542. It will be imperative for Nifty to close above it within next week for bulls to get out of jail. Closing above 23542 will not be enough as there are many more hurdles to cross for Nifty once it scrambles above 200 days EMA.
If the Nifty is not able to cross above the 200 day's EMA by any chance next week the down side supports for Nifty will be at 23360, 23054 and 22819. Out of these 3 levels, 22819 is the most important support as it is the channel bottom support. This current channel in which Nifty is travelling initiates from May 22. Which means it is a pretty solid final support below which there can be a free fall into intense bear territory. In this case bears can drag Nifty further down to 21840 or 21264 levels.
On the positive side the resistances for Nifty remain at 23864, 24265, 24565 (Major resistance 50 days EMA) followed by 24796 and 25436 levels. Above 25436 we can see a pure Bull Market again.
Disclaimer: The above information is provided for educational purpose, analysis and paper trading only. Please don't treat this as a buy or sell recommendation for the stock. We do not guarantee any success in highly volatile market or otherwise. Stock market investment is subject to market risks which include global and regional risks. We will not be responsible for any Profit or loss that may occur due to any financial decision taken based on any data provided in this message.

NIFTY50 // Breakdown or Reversal?www.tradingview.com
Everyone has seen a severe breakdown in Nifty in recent days and approx. 11% correction. But hey, wait a minute.
Did you checked the level where it is holding right now?
It is the same level from where it has taken a pause and breakout in past. Meaning, we can consider it as a strong buying zone.
Along with the above, it is also a level where 38% retracement is there from Fibonacci retracement perspective.
Consider the level of support at 23500, if Nifty doesn't goes below from here next week, be ready for a resume of bull run again.
So, the next resistance will be : 24500, 26300, 28200, 30000
and, the support will be : 22500, 21600, 21000.
Please note, there is an open gap between 20300-20500. That is the only concerning area. If it goes there to fill the gap, the last support will be 19900.
So, wait for the end of the current weekly candle. If you could see there are approx 6 divergence too on weekly candle which suggest change in situation.
Good luck.
Thanks
StoxWare team

NIFTY : Time to bid inNIFTY / Weekly :
The index is approaching a trend line on the weekly chart and i expect the market to bounce from the trendline support. When it comes to indices, there is no strong support than trendlines.
A good buy strategy is DCAing at 3 zones around the trendline support.
