Nifty levels - Nov 10, 2025Nifty support and resistance levels are valuable tools for making informed trading decisions, specifically when combined with the analysis of 5-minute timeframe candlesticks and VWAP. By closely monitoring these levels and observing the price movements within this timeframe, traders can enhance the accuracy of their entry and exit points. It is important to bear in mind that support and resistance levels are not fixed, and they can change over time as market conditions evolve.
The dashed lines on the chart indicate the reaction levels, serving as additional points of significance to consider. Furthermore, take note of the response at the levels of the High, Low, and Close values from the day prior.
We hope you find this information beneficial in your trading endeavors.
* If you found the idea appealing, kindly tap the Boost icon located below the chart. We encourage you to share your thoughts and comments regarding it.
Wishing you success in your trading activities!
Niftylevels

Nifty delicately placed near Father line. Nifty is delicately placed near the father line now. Starting to look a little oversold. There are chances that we can see a bounce from here tomorrow or next week. Bihar election results will also be looked at many as a barometer to see how the current Government is being seen by larger parts of India. Bihar is usually seen as a litmus test. A result that market would like can certainly drive the next leg of rally. If the result is against market expectation certainly we will see more downside or consolidation.
Supports for Nifty remain at: 25490 (Father line support today low was 25491), 25431 (Mid channel support is around this zone), 25314, 25151, 25024, 24886, 24674 is the channel bottom.
Resistance for Nifty on the upper side are: 25598, 25719 (Mother line resistance), 25904, 26089, 26179 currently is the channel top.
To know more about Mother Father lines and my Mother, Father small Child theory, Fundamental analysis and how to draw charts or use Techno-Funda analysis do read my book the Happy Candles Way To Wealth Creation rated 4.8/5 on Amazon.
Disclaimer: The above information is provided for educational purpose, analysis and paper trading only. Please don't treat this as a buy or sell recommendation for the stock or index. The Techno-Funda analysis is based on data that is more than 3 months old. Supports and Resistances are determined by historic past peaks and Valley in the chart. Many other indicators and patterns like EMA, RSI, MACD, Volumes, Fibonacci, parallel channel etc. use historic data which is 3 months or older cyclical points. There is no guarantee they will work in future as markets are highly volatile and swings in prices are also due to macro and micro factors based on actions taken by the company as well as region and global events. Equity investment is subject to risks. I or my clients or family members might have positions in the stocks that we mention in our educational posts. We will not be responsible for any Profit or loss that may occur due to any financial decision taken based on any data provided in this message. Do consult your investment advisor before taking any financial decisions. Stop losses should be an important part of any investment in equity.

Nifty levels - Nov 07, 2025Nifty support and resistance levels are valuable tools for making informed trading decisions, specifically when combined with the analysis of 5-minute timeframe candlesticks and VWAP. By closely monitoring these levels and observing the price movements within this timeframe, traders can enhance the accuracy of their entry and exit points. It is important to bear in mind that support and resistance levels are not fixed, and they can change over time as market conditions evolve.
The dashed lines on the chart indicate the reaction levels, serving as additional points of significance to consider. Furthermore, take note of the response at the levels of the High, Low, and Close values from the day prior.
We hope you find this information beneficial in your trading endeavors.
* If you found the idea appealing, kindly tap the Boost icon located below the chart. We encourage you to share your thoughts and comments regarding it.


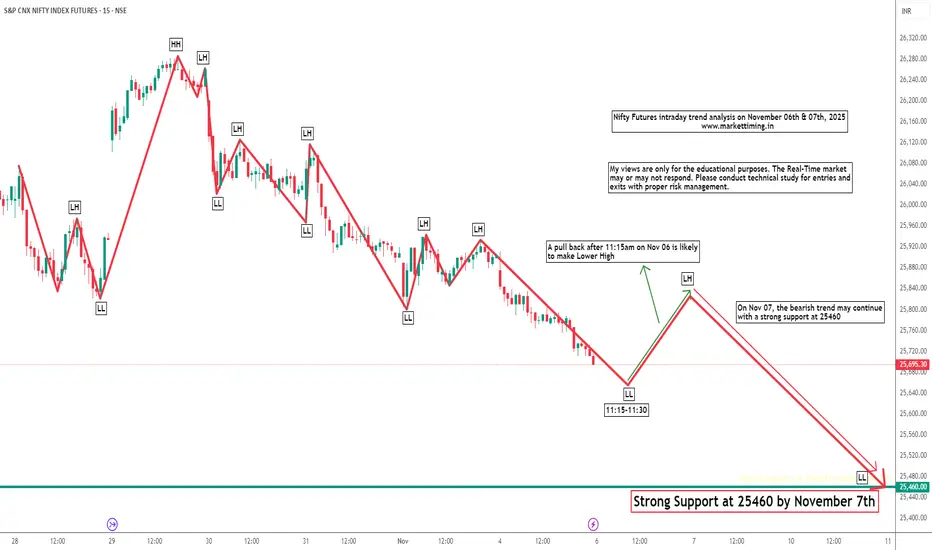
Nifty Futures Intraday Trend Analysis for November 6th and 7thBased on my pattern analysis, I anticipate the bearish momentum to persist until November 7th, potentially testing the support level around 25,460. However, on November 6th, a pullback after 11:15 AM is possible, which could result in a lower high formation.
Please note that this is my personal market outlook, and actual price action may vary due to potential gaps on either side. Traders are advised to perform their own technical analysis for entries and exits, while maintaining proper risk management practices.
Nifty Analysis EOD – November 4, 2025 – Tuesday🟢 Nifty Analysis EOD – November 4, 2025 – Tuesday 🔴
A textbook triple-distribution day where bears dominated the expiry setup.
🗞 Nifty Summary
Nifty started flat to negative and instantly marked the day high at 25,787.40 in the very first minute. A sharp 82-point drop followed, taking the index to the crucial 25,706 zone. From there, Nifty got trapped within a narrow 35-point range (25,720–25,685) before slipping into another similar micro-range (25,685–25,650).
The entire day was a grind dominated by bears while bulls fought to defend supports — often leading to both-side fakeouts that punished intraday traders, particularly option buyers during weekly expiry volatility.
Around 2 PM, a breakdown from the second range breached both the PDL and the 25,635–25,615 support zone with strong momentum and volatility. The index eventually closed at 25,597.65, right at support and near the day’s low — confirming a triple-distribution day structure and a decisive bearish tone.
The engulfing move of yesterday’s bullish candle indicates that bears still have control, and short-term retracement toward 25,400 remains likely.
🛡 5 Min Intraday Chart with Levels
📉 Daily Time Frame Chart with Intraday Levels
🕯 Daily Candle Breakdown
Open: 25,744.75
High: 25,787.40
Low: 25,578.40
Close: 25,597.65
Change: −165.70 (−0.64%)
🏗️ Structure Breakdown
Type: Large bearish candle with a long body and small upper wick.
Range (High–Low): 209 points → high volatility session.
Body: ≈ 147 points → strong bearish control throughout.
Upper Wick: ≈ 42.65 points → rejection from 25,780 resistance.
Lower Wick: ≈ 19.25 points → weak late-session buying attempt.
📚 Interpretation
Nifty opened weak and failed to sustain above 25,780, triggering heavy selling below 25,650. This breakdown invalidated short-term bullish attempts, with bears pressing the index below major supports.
Despite minor pullbacks, the structure clearly confirms downtrend continuation with momentum building toward 25,400.
🕯Candle Type
A strong bearish continuation candle, confirming that yesterday’s spinning-top pattern was merely a pause before another leg lower.
🛡 5 Min Intraday Chart
⚔️ Gladiator Strategy Update
ATR: 202.64
IB Range: 102.30 → Medium
Market Structure: Balanced
Trade Highlights:
10:17 – Short Trade → SL Hit
11:25 – Long Trade → Trailing SL Hit
14:10 – Short Trade → Trailing SL Hit
📌 What’s Next? / Bias Direction
Trend : Bearish Continuation
If this momentum persists, short-term retracement toward 25,400 seems likely. Immediate supports lie at 25,550 and 25,460–25,440 zones.
📌 Support & Resistance Levels
Resistance Zones:
25,715
25,790
25,865 ~ 25,880
Support Zones:
25,585
25,550
25,510
25,460 ~ 25,440
💡 Final Thoughts
A clean triple-distribution expiry session often defines trend continuation phases rather than reversals. As long as Nifty remains below 25,700, sellers will dominate. A break below 25,550 could extend the fall to 25,400 — while any sustained move above 25,715 may only bring temporary relief.
“The market rewards patience when chaos tests conviction.”
✏️ Disclaimer
This is just my personal viewpoint. Always consult your financial advisor before taking any action.

Nifty levels - Nov 06, 2025Nifty support and resistance levels are valuable tools for making informed trading decisions, specifically when combined with the analysis of 5-minute timeframe candlesticks and VWAP. By closely monitoring these levels and observing the price movements within this timeframe, traders can enhance the accuracy of their entry and exit points. It is important to bear in mind that support and resistance levels are not fixed, and they can change over time as market conditions evolve.
The dashed lines on the chart indicate the reaction levels, serving as additional points of significance to consider. Furthermore, take note of the response at the levels of the High, Low, and Close values from the day prior.
We hope you find this information beneficial in your trading endeavors.
* If you found the idea appealing, kindly tap the Boost icon located below the chart. We encourage you to share your thoughts and comments regarding it.
Nifty Analysis EOD – November 3, 2025 – Monday🟢 Nifty Analysis EOD – November 3, 2025 – Monday 🔴
A Day of False Breakouts — Signs of Base Building or Just Another Trap?
🗞 Nifty Summary
Nifty opened 38 points lower, quickly filled the gap in the initial move but couldn’t hold above the 25715 support zone, slipping further to mark the day’s low at 25645.50. From there, a sharp recovery of over 100 points lifted the index above the previous day’s close (PDC) to a new day high of 25761.5, forming the Initial Balance (IB) High.
After a brief retracement, a strong rally attempted to break the IB High, but the very next candle proved it a false breakout, pulling Nifty back under control of the bears. Price hovered near the IB zone, with multiple breakout attempts followed by quick rejections. A double bottom pattern emerged around the earlier swing low, which helped bulls stage another rally toward the IB High — and once again, a false breakout ensued.
Finally, around 2:10 PM, Nifty decisively broke above the IB High, rallying to the next resistance zone of 25790, where it again faced rejection but managed to close near the day’s high at 25774.3, above both CDO and PDC levels.
While the day looked random at first glance, the price behavior reflected a pattern typical of base-building phases — a mix of failed breakouts, mid-range compressions, and reactive rallies. If this indeed is a base formation, the 25700 zone must hold in coming sessions.
As highlighted in yesterday’s note, 25790 was the key level, and today’s close near it makes tomorrow’s close above 25790 crucial for bulls’ continuation. The 25700 level remains the guiding line for short-term structure.
🛡 5 Min Intraday Chart with Levels
🛡 Intraday Walk
Opened 38 points negative and tested 25715 zone.
Failed to sustain, slipped to 25645.5 marking day’s low.
Sharp 100+ point recovery to 25761.5 forming IB High.
Multiple fake breakouts above IB High followed by rejections.
Double bottom near 25650–25670 region provided strong bounce.
Final rally tested 25790 resistance; closed at 25774.3 near the high.
📉 Daily Time Frame Chart with Intraday Levels
🕯 Daily Candle Breakdown
Open: 25,696.85
High: 25,803.10
Low: 25,645.50
Close: 25,763.35
Change: +41.25 (+0.16%)
🏗️ Structure Breakdown
Type: Small-bodied bullish candle with wicks on both ends — indecision with mild bullish bias.
Range (High–Low): 157.60 points → moderate volatility.
Body: ≈ 66.50 points → limited directional strength.
Upper Wick: ≈ 39.75 points → rejection near 25,800.
Lower Wick: ≈ 51.35 points → buying support near 25,650.
📚 Interpretation
After two strong bearish days, Nifty managed to hold key supports and stage a mild comeback. Bulls defended the 25,650–25,700 zone well, though momentum above 25,800 remains lacking. The close above open signals buyer re-entry, albeit cautiously — a potential pause before reversal or consolidation.
🕯Candle Type
A Spinning Top, appearing after consecutive bearish sessions — a classic indecision candle often preceding a short-term base or pullback.
🛡 5 Min Intraday Chart
⚔️ Gladiator Strategy Update
ATR: 201.94
IB Range: 116. → Medium
Market Structure: balanced
Trade Highlights:
9:36 – Long Trade → Target Achieved (R:R 1:1.69)
10:43 – Long Trade → SL Hit
11:26 – Short Trade → Trailing SL Hit
📌 What’s Next? / Bias Direction
The short-term trend remains in flux — bulls are attempting to defend their ground, while bears continue rejecting higher zones.
A close above 25790 could confirm short-term strength and push Nifty toward 25880–25940.
If the 25700 level fails, the market may retest 25580–25550 as the next strong demand area.
📌 Support & Resistance Levels
Resistance Zones:
25790
25865 ~ 25880
25920 ~ 25944
Support Zones:
25635 ~ 25615
25585
25550
25510
25460 ~ 25440
💡 Final Thoughts
“Base-building phases test patience — not skill. The disciplined trader sees patterns where others see noise.”
✏️ Disclaimer
This is just my personal viewpoint. Always consult your financial advisor before taking any action.

Nifty levels - Nov 04, 2025Nifty support and resistance levels are valuable tools for making informed trading decisions, specifically when combined with the analysis of 5-minute timeframe candlesticks and VWAP. By closely monitoring these levels and observing the price movements within this timeframe, traders can enhance the accuracy of their entry and exit points. It is important to bear in mind that support and resistance levels are not fixed, and they can change over time as market conditions evolve.
The dashed lines on the chart indicate the reaction levels, serving as additional points of significance to consider. Furthermore, take note of the response at the levels of the High, Low, and Close values from the day prior.
We hope you find this information beneficial in your trading endeavors.
* If you found the idea appealing, kindly tap the Boost icon located below the chart. We encourage you to share your thoughts and comments regarding it.
Wishing you success in your trading activities!
Nifty Analysis EOD – October 31, 2025 – Friday🟢 Nifty Analysis EOD – October 31, 2025 – Friday 🔴
Bulls Trapped Early — Bears Closed the Week with Authority!
🗞 Nifty Summary
Nifty opened flat to mildly negative, but the sentiment quickly turned bearish as the index slipped 63 points within the first minute, breaking below the Previous Day’s Low (PDL). Just as the tone seemed set for a full bearish day, a sudden aggressive recovery spike flipped the momentum — Nifty rallied 131 points from the day’s low, crossing CDO, CDH, and even the CPR zone.
However, the 25950 resistance zone halted this unexpected surge. The CPR tried to hold as support but eventually failed, leading to a sharp fall below PDL, CDL, and S1. The index finally found a pause around the 25790 support, staying range-bound between 25830 ~ 25760 for most of the session.
In the final minutes (around 2:50 PM), Nifty broke the
consolidation and tested the key 25715 ~ 25725 support zone, closing the day at 25731.90, almost at the day’s low.
The first 20 minutes trapped the bulls, and the bears rode comfortably through the rest of the session. Today’s close erased the past 9 trading days of gains, also finishing below last week’s low, signaling clear selling pressure between 25800 ~ 26,000.
Heading into Monday, sustaining below 25725 ~ 25715 could open the door to the next support zone of 25580 ~ 25550. Bulls need to reclaim 25790 quickly to avoid deeper retracement.
🛡 5 Min Intraday Chart with Levels
🛡 Intraday Walk
Flat-to-weak open quickly turned bearish, breaking PDL.
A surprise 131-point spike trapped early bulls.
Resistance at 25950 and CPR rejection flipped momentum back to bears.
Sharp fall below S1; support emerged at 25790.
Long sideways phase around 25800, followed by a late sell-off to 25725.
Closed near the day’s low — bears in firm control.
📉 Daily Time Frame Chart with Intraday Levels
🕯 Daily Candle Breakdown
Open: 25,863.80
High: 25,953.75
Low: 25,711.20
Close: 25,722.10
Change: −155.75 (−0.60%)
🏗️ Structure Breakdown
Type: Bearish candle with long upper wick, close near day’s low.
Range (High–Low): 242.55 points → wide and volatile.
Body: ≈ 141.70 points → decisive selling pressure.
Upper Wick: ≈ 89.95 points → strong rejection from highs.
Lower Wick: ≈ 10.90 points → weak recovery near close.
📚 Interpretation
Despite a volatile start, the bears dominated throughout. The session’s failed recovery and close near the lows reflect an exhaustion of buying power. The long upper shadow signals repeated rejections at resistance, confirming that sellers continue to defend higher levels strongly.
🕯Candle Type
A Bearish Continuation Candle, extending Thursday’s weakness. The upper shadow rejection shows that bulls’ attempts to reclaim ground were quickly overpowered by sellers.
🛡 5 Min Intraday Chart
⚔️ Gladiator Strategy Update
ATR: 206.86
IB Range: 131.65 → Medium
Market Structure: Imbalanced (Bearish Bias)
Trade Highlights:
9:53 – Short Trade → Target Achieved (R:R 1:2.89)
10:26 – Short Trade → Trailing SL Hit
13:37 – Short Trade → Trailing SL Hit
📌 What’s Next? / Bias Direction
The October expiry week ended with a decisive bearish tone.
If Monday opens below 25715 and fails to reclaim 25790, expect a slide toward 25580 ~ 25550 in the short term.
Conversely, only a close above 25880 can ease selling pressure and hint at a relief bounce.
For now, bearish momentum remains dominant — trade light, stay objective, and let the structure confirm before committing.
📌 Support & Resistance Levels
Resistance Zones:
25790
25865 ~ 25880
25920 ~ 25944
Support Zones:
25635 ~ 25615
25585
25550
25510
25460 ~ 25440
💡 Final Thoughts
“When the market traps the impatient, it rewards the disciplined. Let structure—not emotion—guide your trades.”
✏️ Disclaimer
This is just my personal viewpoint. Always consult your financial advisor before taking any action.

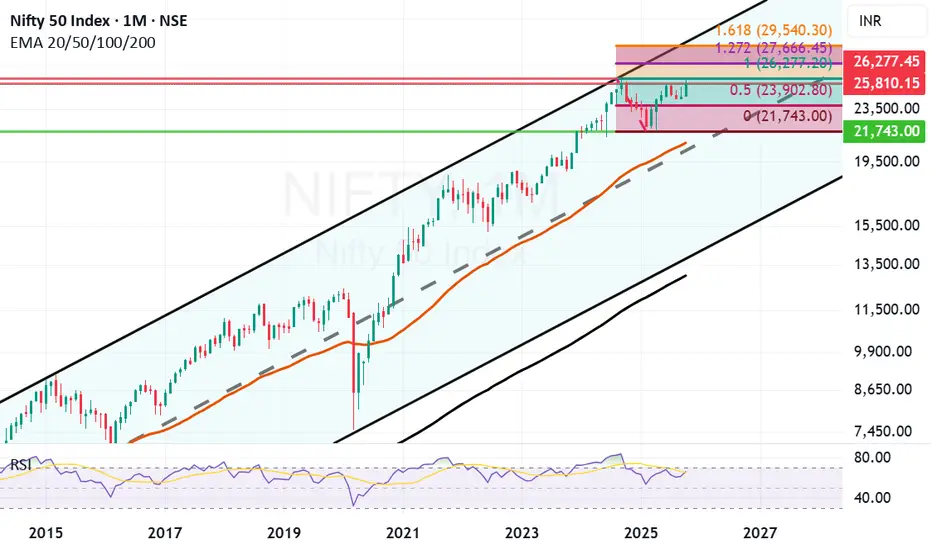
Negative closing today but it was a good monthly closing candle.Despite negative closing for last 2 days of the month it was an overall good monthly candle for Nifty. Previous highest Monthly closing for Nifty was 25810 in September 2024. This month we got a closing slightly below the same at 25722 in October 2025. Once we get a closing above previous all time high in the next month or 2 on in few months time the doors for Next Fibonacci level opens. The next Fibonacci resistance level after we get a closing above previous ATH of 26277 will be at 27666. Golden Fibonacci ratio target in few years time will be 29540.
Very strong Fibonacci support now remains at 23902. Next Fibonacci level support in case of a catastrophic event will be at 21743. Mother line of 50 Months EMA remains at 20853 which is very close to mid-channel support in case there are multiple global or regional situations creating instability.
As of now the shadow of the candle seems positive however there is a chance of little bottom testing for Nifty before we get a new all time high. Sectoral rotations and reshuffling of portfolios of HNIs, MFs and FIIs might also be on card depending on the trade deals and newly emerging tariff scenarios.
Selective stocks which have been giving good results year on year and Quarter on Quarter from Consumption, Defense, Auto, Infrastructure, Banking and Capital Goods sectors including the PSUs themes look good for long term investment currently. While previous superstars of IT, Pharma, Services and other few sectors which lead the previous rally can tend to remain laggard and sideways, specially if the trade deal agreement remain unresolved. If the trade deals with EU and US, specially US goes through even these sectors will fight back and tend to perform.
Overall it was a good month of recovery where Nifty made a comeback from the lows of 24605 to reach 26104 gaining almost 1499 points at one point. Yet it was little disappointing to close below 26K at 25722. Still the positive is that we gained 1117 points this month which is not a bad show at all. Hoping that we get a monthly closing above 26K or previous ATH soon so that doors for next phase of Bull rally can commence swiftly.
Disclaimer: The above information is provided for educational purpose, analysis and paper trading only. Please don't treat this as a buy or sell recommendation for the stock or index. The Techno-Funda analysis is based on data that is more than 3 months old. Supports and Resistances are determined by historic past peaks and Valley in the chart. Many other indicators and patterns like EMA, RSI, MACD, Volumes, Fibonacci, parallel channel etc. use historic data which is 3 months or older cyclical points. There is no guarantee they will work in future as markets are highly volatile and swings in prices are also due to macro and micro factors based on actions taken by the company as well as region and global events. Equity investment is subject to risks. I or my clients or family members might have positions in the stocks that we mention in our educational posts. We will not be responsible for any Profit or loss that may occur due to any financial decision taken based on any data provided in this message. Do consult your investment advisor before taking any financial decisions. Stop losses should be an important part of any investment in equity.
Nifty levels - Nov 03, 2025Nifty support and resistance levels are valuable tools for making informed trading decisions, specifically when combined with the analysis of 5-minute timeframe candlesticks and VWAP. By closely monitoring these levels and observing the price movements within this timeframe, traders can enhance the accuracy of their entry and exit points. It is important to bear in mind that support and resistance levels are not fixed, and they can change over time as market conditions evolve.
The dashed lines on the chart indicate the reaction levels, serving as additional points of significance to consider. Furthermore, take note of the response at the levels of the High, Low, and Close values from the day prior.
We hope you find this information beneficial in your trading endeavors.
* If you found the idea appealing, kindly tap the Boost icon located below the chart. We encourage you to share your thoughts and comments regarding it.
Wishing you success in your trading activities!

Nifty Analysis EOD – October 30, 2025 – Thursday 🟢 Nifty Analysis EOD – October 30, 2025 – Thursday 🔴
Bears Take the Driver’s Seat — 26K Slips Away Again!
🗞 Nifty Summary
Nifty opened with a 55-point gap-down right at the previously marked support zone of 26010 ~ 26020. However, the very first minute of trade confirmed weakness — the index couldn’t hold this zone and lost nearly 140 points within the first 40 minutes, breaking both key support and PDL levels.
A brief rescue attempt came from 25900, leading to a 75-point bounce, but conviction was missing — the market stayed rangebound for the majority of the session. Around 1:30 PM, a breakdown below IB Low triggered another wave of selling, marking the day’s low at 25845 in a highly volatile session.
By the close, Nifty settled at 25891.20, down 177 points, reflecting a clear shift in control to the bears.
🛡 5 Min Intraday Chart with Levels
🛡 Intraday Walk
Gap-down open near key support (26010–26020) failed instantly.
Sharp 140-point fall in early trade broke multiple support levels.
Rebound from 25900 lacked conviction; sideways phase dominated mid-session.
Breakdown below IB Low (13:30) opened a fresh range to 25845.
Wild volatility throughout; end-of-day close below 26K strengthened bearish grip.
📉 Daily Time Frame Chart with Intraday Levels
🕯 Daily Candle Breakdown
Open: 25,984.40
High: 26,032.05
Low: 25,845.25
Close: 25,877.85
Change: −176.05 (−0.68%)
🏗️ Structure Breakdown
Type: Bearish candle with long upper wick and wide range.
Range (High–Low): 186.80 points → high volatility.
Body: ≈ 106.55 points → strong selling pressure.
Upper wick: ≈ 47.65 points → rejection from intraday highs.
Lower wick: ≈ 32.60 points → mild recovery from lows.
📚 Interpretation
The day began with optimism but ended in disappointment for bulls. Early strength faded quickly as sellers dominated from 26,000 onward.
The close near the lower end of the range confirms profit booking and mild distribution at higher levels. This candle follows the earlier bullish continuation with a strong bearish response, signaling short-term caution.
🕯Candle Type
A Bearish Engulfing–like continuation candle, though not textbook perfect, represents a decisive rejection near 26K — an early warning for bulls.
🛡 5 Min Intraday Chart
⚔️ Gladiator Strategy Update
ATR: 202.90
IB Range: 139.80 → Medium
Market Structure: Imbalanced (Bearish Tilt)
Trade Highlights:
10:31 – Short Trade → Trailing SL Hit
10:57 – Long Trade → Target Achieved (R:R 1:1.31)
13:18 – Long Trade → SL Hit
📌 What’s Next? / Bias Direction
As mentioned in yesterday’s note, 26010 ~ 26020 was the must-hold zone — and losing it handed full control to bears.
For bulls to regain ground, Nifty needs to close above 26K with strength.
For bears, a close below 25700 will confirm short-term dominance and possibly extend weakness toward 25580–25500.
Until then, expect high volatility and range-bound play. Avoid emotional trades; discipline is your edge.
📌 Support & Resistance Levels
Resistance Zones:
25920
25944
25977
26010 ~ 26020
Support Zones:
25865 ~ 25845
25810 ~ 25790
25725 ~ 25715
💡 Final Thoughts
“Markets test patience before rewarding conviction. In volatility, your biggest weapon is restraint.”
✏️ Disclaimer
This is just my personal viewpoint. Always consult your financial advisor before taking any action.

Nifty levels - Oct 31, 2025Nifty support and resistance levels are valuable tools for making informed trading decisions, specifically when combined with the analysis of 5-minute timeframe candlesticks and VWAP. By closely monitoring these levels and observing the price movements within this timeframe, traders can enhance the accuracy of their entry and exit points. It is important to bear in mind that support and resistance levels are not fixed, and they can change over time as market conditions evolve.
The dashed lines on the chart indicate the reaction levels, serving as additional points of significance to consider. Furthermore, take note of the response at the levels of the High, Low, and Close values from the day prior.
We hope you find this information beneficial in your trading endeavors.
* If you found the idea appealing, kindly tap the Boost icon located below the chart. We encourage you to share your thoughts and comments regarding it.
Wishing you success in your trading activities!

Nifty Analysis EOD – October 29, 2025 – Wednesday🟢 Nifty Analysis EOD – October 29, 2025 – Wednesday 🔴
Bulls fight back, but 26,100 still guards the gate to new highs
🗞 Nifty Summary
Nifty opened 22 points higher at 25,982 and immediately tested the 26010 ~ 26020 resistance zone within the first 5 minutes. This zone once again acted as a strong supply area, forcing an early rejection and filling the opening gap.
Despite multiple attempts, Nifty couldn’t break through in the first hour. During this phase, a symmetrical triangle pattern took shape, and its breakout finally triggered a sharp move upward, pushing the index beyond both the 26010 ~ 26020 zone and the PDH level.
However, the bulls failed to hold above PDH, slipping back below where the same zone flipped into support. From there, with persistent effort, Nifty managed to reclaim the PDH and mark a new intraday high near 26085 ~ 26100, the next key resistance zone.
Around 1:10–1:15 PM, heavy volume spikes were noted — particularly on ITM option strikes — signaling a fierce tug-of-war between buyers and sellers. Price consolidated in this area and created a false breakout, eventually sliding back to retest PDH and the 26010 ~ 26020 zone.
By the closing bell, Nifty settled at 26,068.30, posting a 102.90-point gain — a healthy positive finish despite intraday turbulence.
Yesterday’s note had warned about false breakouts, which proved useful today. Up to 13:40, Nifty moved cleanly along a trendline, but once it broke, bias turned unclear — signaling traders to step back. Those who detached after the early profit phase likely preserved gains and avoided the afternoon whipsaws.
Going ahead, 26010 ~ 26020 must hold as support to keep bullish momentum intact. A breakout above 26,100 could open the door toward 26,220, 26,280, and possibly a new all-time high (ATH) soon.
🛡 5 Min Intraday Chart with Levels
🛡 Intraday Walk
Gap-up open of 22 pts → early rejection at 26010 ~ 26020.
Gap filled → forms symmetrical triangle.
Breakout triggers sharp rally → crosses PDH, hits 26085 ~ 26100.
Fakeout at highs → slides back below PDH to support.
Afternoon session volatile, strong volumes between 1:00–1:15 PM.
Index rebounds again, closes strong near 26068.
📉 Daily Time Frame Chart with Intraday Levels
🕯 Daily Candle Breakdown
Open: 25,982.00
High: 26,097.85
Low: 25,960.30
Close: 26,053.90
Change: +117.70 (+0.45%)
🏗️ Structure Breakdown
Type: Bullish candle with small lower shadow and moderate upper wick.
Range (High–Low): 137.55 pts → steady intraday movement.
Body: ≈ 71.9 pts → consistent buying strength.
Upper Wick: ≈ 43.95 pts
Lower Wick: ≈ 21.70 pts
📚 Interpretation
The session opened flat, briefly dipped below 25,960, and then trended higher. Buyers maintained firm control through the day, though some supply was visible near 26,100. The close near the upper end of the range confirms bullish continuation.
🕯Candle Type
Bullish Continuation Candle (Rising Marubozu variant)
Indicates renewed buying interest following a brief pause in momentum (after previous spinning top).
🛡 5 Min Intraday Chart
⚔️ Gladiator Strategy Update
ATR: 202.26
IB Range: 64.75 → Medium
Market Structure: Balanced
Trade Highlights:
10:10 – Long Trade → Target Achieved (R:R 1:2.45)
12:10 – Long Trade → Target Achieved (R:R 1:1.36)
13:30 – Long Trade → SL Hit
📌 What’s Next? / Bias Direction
Bias: Bullish continuation with cautious optimism.
Holding 26,010–26,020 keeps the trend intact;
break above 26,100 can extend the rally toward 26,220+.
📌 Support & Resistance Levels
Resistance Zones:
25996
26010 ~ 26020
26085 ~ 26100
Support Zones:
25865
25828
25790
25725 ~ 25715
💡 Final Thoughts
“Momentum rewards patience — not prediction.”
Nifty is showing healthy consolidation beneath resistance, and the strength of the last two sessions indicates buyers are still in charge. One decisive breakout above 26,100 could set the tone for the next leg higher.
✏️ Disclaimer
This is just my personal viewpoint. Always consult your financial advisor before taking any action.

Nifty levels - Oct 30, 2025Nifty support and resistance levels are valuable tools for making informed trading decisions, specifically when combined with the analysis of 5-minute timeframe candlesticks and VWAP. By closely monitoring these levels and observing the price movements within this timeframe, traders can enhance the accuracy of their entry and exit points. It is important to bear in mind that support and resistance levels are not fixed, and they can change over time as market conditions evolve.
The dashed lines on the chart indicate the reaction levels, serving as additional points of significance to consider. Furthermore, take note of the response at the levels of the High, Low, and Close values from the day prior.
We hope you find this information beneficial in your trading endeavors.
* If you found the idea appealing, kindly tap the Boost icon located below the chart. We encourage you to share your thoughts and comments regarding it.
Wishing you success in your trading activities!

Nifty levels - Oct 29, 2025Nifty support and resistance levels are valuable tools for making informed trading decisions, specifically when combined with the analysis of 5-minute timeframe candlesticks and VWAP. By closely monitoring these levels and observing the price movements within this timeframe, traders can enhance the accuracy of their entry and exit points. It is important to bear in mind that support and resistance levels are not fixed, and they can change over time as market conditions evolve.
The dashed lines on the chart indicate the reaction levels, serving as additional points of significance to consider. Furthermore, take note of the response at the levels of the High, Low, and Close values from the day prior.
We hope you find this information beneficial in your trading endeavors.
* If you found the idea appealing, kindly tap the Boost icon located below the chart. We encourage you to share your thoughts and comments regarding it.
Wishing you success in your trading activities!

Nifty Analysis EOD – October 27, 2025 – Monday🟢 Nifty Analysis EOD – October 27, 2025 – Monday 🔴
Bulls return after the festive break, eyeing 26,000 with renewed strength
Diwali Greetings and Happy New Year to all Indian followers! ✨
After a long Diwali vacation with family, I’m finally back at the desk. Although I was tracking and trading daily, I couldn’t find time to write notes.
During the holiday stretch (7th–24th Oct), Nifty rallied more than 1000 points, hitting our 25,900 pattern target — a smooth ride for intraday traders, except for a few choppy sessions.
🗞 Nifty Summary
Last week’s candle shaped like an inverted hammer/shooting star, hinting at either a pause or a short-term reversal. But today, backed by positive global cues, Nifty opened gap-up by 48 points, showed no intent to fill the gap, and rallied sharply upward.
The index faced resistance around 25,944–25,977, and after several failed breakout attempts beyond 25,977, it briefly marked a new day high at 26,005 before slipping back into the resistance zone.
The final two hours turned volatile — both bulls and bears fought for control. Eventually, Nifty closed at 25,974, just below the intraday high yet comfortably above the previous day’s high — a sign of bullish continuation with caution ahead.
While the close above PDH is positive, sustained strength will only come if bulls breach and hold 25,977–26,020 on the upcoming monthly expiry session.
🛡 5 Min Intraday Chart with Levels
🛡 Intraday Walk
Nifty opened Gap-Up 48 points above PDH.
Rally extended straight to 25,944–25,977 resistance zone.
26,005 marked as intraday high — brief breakout attempt failed.
Last two hours saw heavy volatility within resistance band.
Closed strong at 25,974, maintaining higher-high structure.
🕯 Daily Candle Breakdown
Open: 25,843.20
High: 26,005.95
Low: 25,827.00
Close: 25,966.05
Change: +170.90 (+0.66%)
🏗️ Structure Breakdown
Green candle with solid momentum.
Body ≈ 122.85 pts → decent bullish body.
Range ≈ 178.95 pts → healthy intraday activity.
Upper wick ≈ 39.9 pts, Lower wick ≈ 16.2 pts.
📚 Interpretation
Market opened gap-up and held gains throughout.
Strong follow-through buying above 25,850.
Close near upper quartile of range → bullish conviction intact.
Minor upper wick shows temporary supply at 26,000 psychological mark.
🕯Candle Type
Bullish Marubozu variant (small top wick).
Indicates buying continuation after breakout-driven rally.
🛡 5 Min Intraday Chart
⚔️ Gladiator Strategy Update
ATR: 204.01
IB Range: 119.70 → Medium
Market Structure: Balanced
Trade Highlights:
09:20 – Long Trade → Target Achieved (R:R 1:1.85)
10:06 – Long Trade → Target Achieved (R:R 1:0.79)
📌 What’s Next? / Bias Direction
Bias: Mildly Bullish
As long as 25,850–25,865 holds, the bias remains positive.
A breakout above 26,020 may extend targets to 26,085–26,150, while failure could lead to a sideways consolidation.
📌 Support & Resistance Levels
Resistance Zones:
25996
26010 ~ 26020
26085 ~ 26100
Support Zones:
25865
25828
25790
25725 ~ 25715
💡 Final Thoughts
“Momentum loves clarity — hesitation builds only where conviction weakens.”
The market tone stays upbeat, but resistance near 26,000 will test whether bulls have the stamina to carry forward the festive rally.
✏️ Disclaimer
This is just my personal viewpoint. Always consult your financial advisor before taking any action.

Nifty sustains the trendline Breakout on Muhurat day trading. Nifty sustained the trendline breakout gained earlier this week on Flattish trade on Muhurat day. After making a high of 25934 Nifty ended at 25868. Supports for Nifty are at 25652 and 25370. Below this level there is a Mother line support at 25087. Something to worry about is the upcoming resistances 26015, 26277 and 26484 (Golden Fibonacci ratio resistance). If these 3 resistances are crossed and Nifty can go towards 27K or even reach 27394 which can be the new trend top within this Vikram Samvat year if everything goes in line with and in favour of current trend. Wish you all a fabulous Financial success in this festive season and beyond it.
Disclaimer: The above information is provided for educational purpose, analysis and paper trading only. Please don't treat this as a buy or sell recommendation for the stock or index. The Techno-Funda analysis is based on data that is more than 3 months old. Supports and Resistances are determined by historic past peaks and Valley in the chart. Many other indicators and patterns like EMA, RSI, MACD, Volumes, Fibonacci, parallel channel etc. use historic data which is 3 months or older cyclical points. There is no guarantee they will work in future as markets are highly volatile and swings in prices are also due to macro and micro factors based on actions taken by the company as well as region and global events. Equity investment is subject to risks. I or my clients or family members might have positions in the stocks that we mention in our educational posts. We will not be responsible for any Profit or loss that may occur due to any financial decision taken based on any data provided in this message. Do consult your investment advisor before taking any financial decisions. Stop losses should be an important part of any investment in equity.

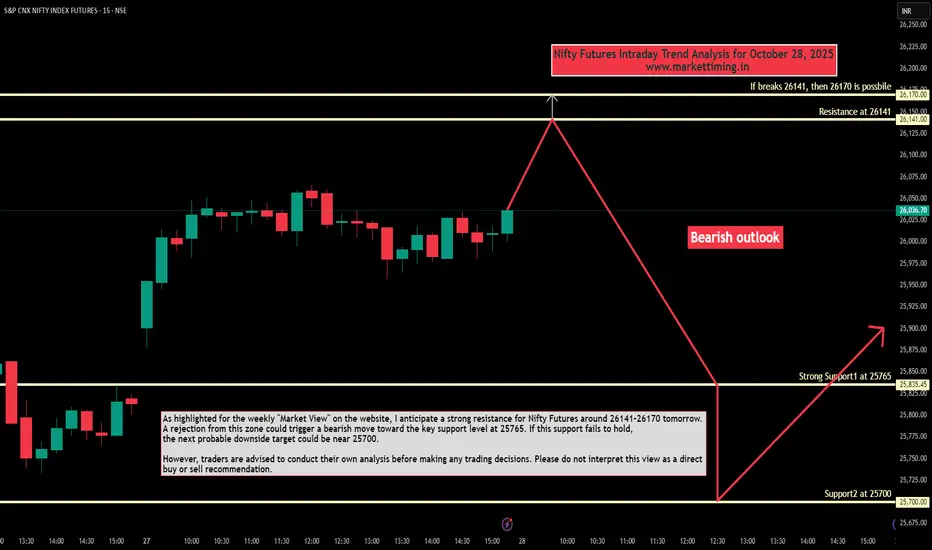
Nifty Futures Intraday Trend Analysis for October 28, 2025As highlighted for weekly "Market View" outlook on the website, I anticipate a strong resistance for Nifty Futures around 26141–26170 tomorrow. A rejection from this zone could trigger a bearish move toward the key support level at 25765. If this support fails to hold, the next probable downside target could be near 25700.
However, traders are advised to conduct their own analysis before making any trading decisions. Please do not interpret this view as a direct buy or sell recommendation.
Nifty levels - Oct 28, 2025Nifty support and resistance levels are valuable tools for making informed trading decisions, specifically when combined with the analysis of 5-minute timeframe candlesticks and VWAP. By closely monitoring these levels and observing the price movements within this timeframe, traders can enhance the accuracy of their entry and exit points. It is important to bear in mind that support and resistance levels are not fixed, and they can change over time as market conditions evolve.
The dashed lines on the chart indicate the reaction levels, serving as additional points of significance to consider. Furthermore, take note of the response at the levels of the High, Low, and Close values from the day prior.
We hope you find this information beneficial in your trading endeavors.
* If you found the idea appealing, kindly tap the Boost icon located below the chart. We encourage you to share your thoughts and comments regarding it.
Wishing you success in your trading activities!

Nifty Hits the 26K Wall—Market Awaits the Spark for a Big LeapAfter six consecutive gains, the Indian benchmark Nifty paused on Friday and slipped slightly from its recent highs, mainly due to profit booking.
Despite the mild correction, the index still ended the week in green, registering modest gains — a sign that the broader market sentiment remains upbeat.
Meanwhile, The India VIX declined 0.30% to 11.59, pointing to subdued market volatility.
Technical View:
On the charts, Nifty attempted a breakout above the 26,000 mark but couldn’t sustain above it.
According to Open Interest (OI) data:
● Resistance: 26,000 remains the strong resistance zone, with heavy call writing indicating a supply wall.
● Support: The 25,500–25,400 zone holds firm as crucial support, backed by significant put writing activity.
Key Triggers for the Week Ahead:
1. US Fed Meeting (Oct 28–29)
Markets will watch closely as the Federal Reserve meets this week. Experts widely expect a rate cut to support growth and ease borrowing costs.
2. Q2 FY26 Earnings Season
The ongoing earnings season will continue to drive stock-specific moves as major Indian corporates announce their quarterly results.
3. US–China Presidential Meeting
Investors will keep an eye on global cues from the upcoming U.S.–China talks, which could influence global sentiment and trade outlook.
4. India–US Trade Deal Progress
Reports suggest India is close to finalising a trade pact with the U.S. — a move that could further boost investor confidence if concluded smoothly.
Looking Ahead
Nifty seems to be catching its breath within a tight range of 25,400–26,000. The bias remains positive, but a decisive breakout above 26,000 is needed to confirm fresh upside momentum.
Until then, traders should focus on stock-specific opportunities, manage risk tightly and stay agile — the next breakout could set the tone for November’s trend.

Nifty 50 @ 52 Week high but Could not Break ATH!What is there for Nifty 50 Now?
Nifty 50 went up till 52 week High @ 26104
but Could not Cross the ATH of 26277
missed by 173 points
There is a Hammer Candle formation on weekly charts from Controlling Supply Zone at the top. Which means bears are not interested to turn to bulls right now.
There is a Strong Resistance @ 26250
and if we talk about Support it is @ 25500 & 25000 and if it breaks it then @ 24500
As per my analysis
1. It should test 25500 and then turn bullish and try top break 26200-26250 Strong Resistance and it it breaks it then we will find a new ATH.
2. it cant hold on 25500 then next Support will be 25000. if it takes support from there it can find resistance much more near @ 25500 then and if it breaks it then it can rally again up till 26200 - 26250 strong resistance or otherwise drop till 24500.
3. If Nifty 50 cant hold on to 25500 & 25000 then it can settle @ 24500 then. It will be a strong Support as then it will be @ Controlling Demand Zone of Monthly. it will take some time then to reach this level monthly EMA 20 will also be near then and it should take Support from it and Start a new Bullish Journey
if it reaches 24500 then it will be a very good opportunity for investors to invest in major shares as they also be at very good level to buy then.
