Nifty 50 @ 52 Week high but Could not Break ATH!What is there for Nifty 50 Now?
Nifty 50 went up till 52 week High @ 26104
but Could not Cross the ATH of 26277
missed by 173 points
There is a Hammer Candle formation on weekly charts from Controlling Supply Zone at the top. Which means bears are not interested to turn to bulls right now.
There is a Strong Resistance @ 26250
and if we talk about Support it is @ 25500 & 25000 and if it breaks it then @ 24500
As per my analysis
1. It should test 25500 and then turn bullish and try top break 26200-26250 Strong Resistance and it it breaks it then we will find a new ATH.
2. it cant hold on 25500 then next Support will be 25000. if it takes support from there it can find resistance much more near @ 25500 then and if it breaks it then it can rally again up till 26200 - 26250 strong resistance or otherwise drop till 24500.
3. If Nifty 50 cant hold on to 25500 & 25000 then it can settle @ 24500 then. It will be a strong Support as then it will be @ Controlling Demand Zone of Monthly. it will take some time then to reach this level monthly EMA 20 will also be near then and it should take Support from it and Start a new Bullish Journey
if it reaches 24500 then it will be a very good opportunity for investors to invest in major shares as they also be at very good level to buy then.
Niftylevels

NIFTY SUPPORT LEVELS – Time to Focus for Potential ReversalNIFTY – Focus on Key Buying Levels (Daily & 4H Timeframe Analysis)
NIFTY is currently showing strong support zones for both momentum and safe buying opportunities.
Timeframe: Daily & 4H
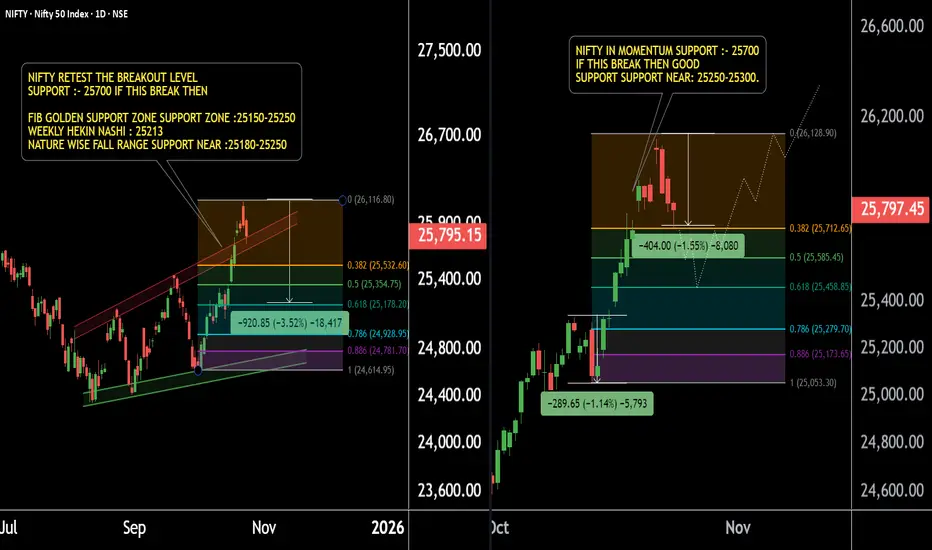
Primary Momentum Buying Level: Around 25,700
Based on Fibonacci levels and short-term price action.
If NIFTY breaks below 25,700, we may see a further decline of 200–250 points.
Next Support Zone: 25,450–25,500 (Daily Timeframe)
Heikin Ashi Candle Support: 25,213, with a broader support range of 25,150–25,250 — confirmed by multiple price action setups.
Key Insight:
If NIFTY holds above these key supports, a reversal or bullish momentum is highly possible. Stay focused on the mentioned levels and trade with patience and discipline.
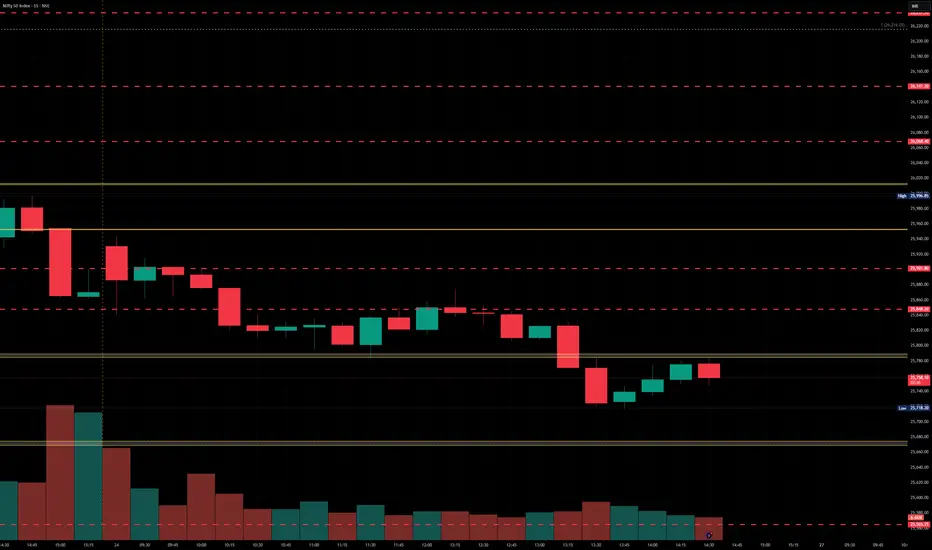
Nifty levels - Oct 27, 2025Nifty support and resistance levels are valuable tools for making informed trading decisions, specifically when combined with the analysis of 5-minute timeframe candlesticks and VWAP. By closely monitoring these levels and observing the price movements within this timeframe, traders can enhance the accuracy of their entry and exit points. It is important to bear in mind that support and resistance levels are not fixed, and they can change over time as market conditions evolve.
The dashed lines on the chart indicate the reaction levels, serving as additional points of significance to consider. Furthermore, take note of the response at the levels of the High, Low, and Close values from the day prior.
We hope you find this information beneficial in your trading endeavors.
* If you found the idea appealing, kindly tap the Boost icon located below the chart. We encourage you to share your thoughts and comments regarding it.
Wishing you success in your trading activities!
Nifty levels - Oct 24, 2025Nifty support and resistance levels are valuable tools for making informed trading decisions, specifically when combined with the analysis of 5-minute timeframe candlesticks and VWAP. By closely monitoring these levels and observing the price movements within this timeframe, traders can enhance the accuracy of their entry and exit points. It is important to bear in mind that support and resistance levels are not fixed, and they can change over time as market conditions evolve.
The dashed lines on the chart indicate the reaction levels, serving as additional points of significance to consider. Furthermore, take note of the response at the levels of the High, Low, and Close values from the day prior.
We hope you find this information beneficial in your trading endeavors.
* If you found the idea appealing, kindly tap the Boost icon located below the chart. We encourage you to share your thoughts and comments regarding it.
Wishing you success in your trading activities!

Nifty levels - Oct 21, 2025Nifty support and resistance levels are valuable tools for making informed trading decisions, specifically when combined with the analysis of 5-minute timeframe candlesticks and VWAP. By closely monitoring these levels and observing the price movements within this timeframe, traders can enhance the accuracy of their entry and exit points. It is important to bear in mind that support and resistance levels are not fixed, and they can change over time as market conditions evolve.
The dashed lines on the chart indicate the reaction levels, serving as additional points of significance to consider. Furthermore, take note of the response at the levels of the High, Low, and Close values from the day prior.
We hope you find this information beneficial in your trading endeavors.
* If you found the idea appealing, kindly tap the Boost icon located below the chart. We encourage you to share your thoughts and comments regarding it.
Wishing you success in your trading activities!

Pre-Diwali Cheer on Dalal Street! Nifty Hits Fresh Yearly HighIndian markets extended their rally for a third straight session on Friday, October 17, with the Nifty hitting fresh one-year highs, spreading early Diwali cheer across Dalal Street.
With this surge, the Nifty 50 is now just 2.16% away from its all-time high of 26,277, reached in September 2024. October has been particularly strong, with the index closing most sessions in the green and posting month-to-date gains of 4.46%, its best performance since March 2025.
Key Drivers of the Rally
● Consumption Stocks Lead the Charge – FMCG and other consumption-oriented stocks gained as investors anticipate improved volume growth.
● Banking Sector Strength – A strong start to the earnings season, led by Axis Bank, boosted confidence with better-than-expected margins and improving asset quality. Nifty Bank NSE:BANKNIFTY even hit a fresh all-time high in the last session.
● Foreign Investor Support – FPIs turned net buyers, helping fuel the rally.
● Positive Macroeconomic Signals – Hopes of an India-U.S. trade deal and falling crude oil prices added to market optimism.
● Geopolitical Stability – Easing tensions in the Middle East reduced risk sentiment, supporting equities.
● Earnings Recovery Expectations – Investors expect H2 FY26 to see stronger earnings, aided by GST rate cuts and the RBI’s cumulative 100-basis-point repo rate reduction, boosting domestic consumption.
Technical Observations
Nifty has broken past the trendline resistance near its previous high of 25,670, signaling continued bullish momentum.
● Immediate support: 25,400–25,500
● Strong support: 25,000
● Resistance zone: 25,850–26,000
Outlook
Next week may stay muted as market holidays on October 21 and 22 could limit major moves. Nifty is likely to remain sideways with a slight bullish bias. Muhurat trading on Tuesday, October 21 (1:45 PM–2:45 PM) will serve as an early indicator of market momentum post-Diwali.

Nifty levels - Oct 20, 2025Nifty support and resistance levels are valuable tools for making informed trading decisions, specifically when combined with the analysis of 5-minute timeframe candlesticks and VWAP. By closely monitoring these levels and observing the price movements within this timeframe, traders can enhance the accuracy of their entry and exit points. It is important to bear in mind that support and resistance levels are not fixed, and they can change over time as market conditions evolve.
The dashed lines on the chart indicate the reaction levels, serving as additional points of significance to consider. Furthermore, take note of the response at the levels of the High, Low, and Close values from the day prior.
We hope you find this information beneficial in your trading endeavors.
* If you found the idea appealing, kindly tap the Boost icon located below the chart. We encourage you to share your thoughts and comments regarding it.
Wishing you success in your trading activities!

Nifty 50 Is Showing Sign of ReversalIn previous chart, Expected upsurge accomplished:
Nifty has reached the optimal supply zone and is expected to decline, at least up to 24,584 . The retracement of wave A (0.786) could act as a strong resistance for a reversal. The lower boundary lies at 24,120 , while 24,377 marks the low of wave (W). It’s better to consider the lower boundary as the potential maximum downside level.
Once the reversal level is identified, we will proceed toward the bullish path.
Stay tuned!
@Money_Dictators
Thanks :)

Strong Breakout for Nifty as it becomes a runaway train.After crossing the mid-channel resistance. Nifty has become a runaway train which has entered and overbought zone on hourly chart as it closed at 25585 with few critical resistances coming to fore. Channel top seems to be just near 26K at 25956. Other critical resistances are at 25586, 25698 and 25786 before it reaches 25956 or 26K. Support for Nifty at this juncture are at 25442, 25323, 25252 (Mother line support and the mid-channel support). Father line support is at 25064. Much required closing above 25500 has lifted the spirits of investors. With key resistances ahead and Nifty being overbought little correction or consolidation would be ideal before it can scale further heights.
Disclaimer: The above information is provided for educational purpose, analysis and paper trading only. Please don't treat this as a buy or sell recommendation for the stock or index. The Techno-Funda analysis is based on data that is more than 3 months old. Supports and Resistances are determined by historic past peaks and Valley in the chart. Many other indicators and patterns like EMA, RSI, MACD, Volumes, Fibonacci, parallel channel etc. use historic data which is 3 months or older cyclical points. There is no guarantee they will work in future as markets are highly volatile and swings in prices are also due to macro and micro factors based on actions taken by the company as well as region and global events. Equity investment is subject to risks. I or my clients or family members might have positions in the stocks that we mention in our educational posts. We will not be responsible for any Profit or loss that may occur due to any financial decision taken based on any data provided in this message. Do consult your investment advisor before taking any financial decisions. Stop losses should be an important part of any investment in equity.

Nifty levels - Oct 17, 2025Nifty support and resistance levels are valuable tools for making informed trading decisions, specifically when combined with the analysis of 5-minute timeframe candlesticks and VWAP. By closely monitoring these levels and observing the price movements within this timeframe, traders can enhance the accuracy of their entry and exit points. It is important to bear in mind that support and resistance levels are not fixed, and they can change over time as market conditions evolve.
The dashed lines on the chart indicate the reaction levels, serving as additional points of significance to consider. Furthermore, take note of the response at the levels of the High, Low, and Close values from the day prior.
We hope you find this information beneficial in your trading endeavors.
* If you found the idea appealing, kindly tap the Boost icon located below the chart. We encourage you to share your thoughts and comments regarding it.
Wishing you success in your trading activities!

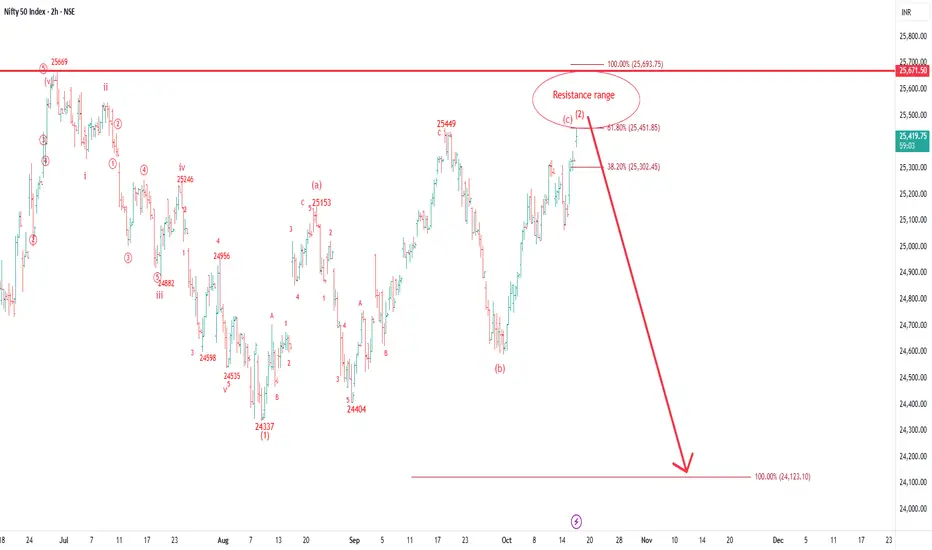
ALERT:Nifty is in Resistance range. Stay Cautious on Buying sideIn this 2hour chart Nifty formed a corrective pattern from 24337 and now it is near to its completion range and soon may decline below 24300 in coming days/weeks.
This analysis is based on Elliott wave Theory so If you have not understand Elliott wave then kindly ignore it.
Thank you.
Nifty levels - Oct 16, 2025Nifty support and resistance levels are valuable tools for making informed trading decisions, specifically when combined with the analysis of 5-minute timeframe candlesticks and VWAP. By closely monitoring these levels and observing the price movements within this timeframe, traders can enhance the accuracy of their entry and exit points. It is important to bear in mind that support and resistance levels are not fixed, and they can change over time as market conditions evolve.
The dashed lines on the chart indicate the reaction levels, serving as additional points of significance to consider. Furthermore, take note of the response at the levels of the High, Low, and Close values from the day prior.
We hope you find this information beneficial in your trading endeavors.
* If you found the idea appealing, kindly tap the Boost icon located below the chart. We encourage you to share your thoughts and comments regarding it.
Wishing you success in your trading activities!

Nifty levels - Oct 15, 2025Nifty support and resistance levels are valuable tools for making informed trading decisions, specifically when combined with the analysis of 5-minute timeframe candlesticks and VWAP. By closely monitoring these levels and observing the price movements within this timeframe, traders can enhance the accuracy of their entry and exit points. It is important to bear in mind that support and resistance levels are not fixed, and they can change over time as market conditions evolve.
The dashed lines on the chart indicate the reaction levels, serving as additional points of significance to consider. Furthermore, take note of the response at the levels of the High, Low, and Close values from the day prior.
We hope you find this information beneficial in your trading endeavors.
* If you found the idea appealing, kindly tap the Boost icon located below the chart. We encourage you to share your thoughts and comments regarding it.
Wishing you success in your trading activities!

Nifty levels - Oct 14, 2025Nifty support and resistance levels are valuable tools for making informed trading decisions, specifically when combined with the analysis of 5-minute timeframe candlesticks and VWAP. By closely monitoring these levels and observing the price movements within this timeframe, traders can enhance the accuracy of their entry and exit points. It is important to bear in mind that support and resistance levels are not fixed, and they can change over time as market conditions evolve.
The dashed lines on the chart indicate the reaction levels, serving as additional points of significance to consider. Furthermore, take note of the response at the levels of the High, Low, and Close values from the day prior.
We hope you find this information beneficial in your trading endeavors.
* If you found the idea appealing, kindly tap the Boost icon located below the chart. We encourage you to share your thoughts and comments regarding it.
Wishing you success in your trading activities!

Nifty Pauses Below Resistance, Eyes Earnings-Driven MoveIndian markets closed on a strong note last week, with the Nifty rising over 1.5% to 25,285. The rally was led by IT sector (up nearly 5%) and PSU banks (up around 1.5%), reflecting sectoral strength during the earnings season.
The India VIX inched up 0.42% to 10.10, still near multi-month lows, though volatility may rise as corporate results roll in.
Technically, the Nifty is now testing a crucial resistance zone at 25,400–25,500, aligning with the apex of a large symmetrical triangle pattern. Open interest data shows heavy call writing at this zone, while strong put writing around 25,100–25,200 indicates immediate support. A decisive breakout on either side may set the tone for the next directional move.
Looking ahead, some consolidation or range-bound movement is likely as the market digests earnings and global developments. US–China trade tensions and semiconductor supply chain concerns may weigh on sentiment if risks intensify.
Given the current setup, traders are advised to adopt a cautious, stock-specific approach. While the broader bias remains positive, protecting profits and avoiding aggressive long positions until a clear breakout is confirmed would be prudent.

Uncertainty can prevail with latest Trump Tariff Tantrum.The chart indicates a Trend line resistance near 25323 which Nifty was set to overhaul but latest Trump Tariff Tantrum has potential to derail the progress again. This time the announcement is 100% tariff on China. Global markets, Crypto and Gift Nifty is showing weakness due to the announcement which will be effective from 1st November.
Resistance for Nifty are at 25323 (Trend line resistance), 25438, 25565 and finally channel top at 25702. Supports for Nifty are at 25215, 25087 (Mother line support), 24987 (Father line support), 24922 and 24750 is the channel bottom support. Shadow of the candle was positive to neutral but this tariff announcement has turned it negative as of now. Let us see how the cookie crumbles next week.
To know mover about Mother line, Father line, Mid channel support / resistance, Chanel top resistnace and channle bottom support, trend line support and resistance (To understand the role of Mother line and Father line) or to be able to draw resistances and supports based on historic peaks and valleys you can read my book THE HAPPY CANDLES WAY TO WEALTH CREATION. The book is available in Amazon in paperback or Kindle version and is rated 4.8/5. This book teaches you Techno-Funda investing. (Techno Funda investing means Knowing which are Fundamentally strong companies and investing / booking profits / staying invested in them based on Technical analysis). The book has some more unique features like rating a stock with the help of Happy Candles Number wherein you can give a stock marks out of 100 based on Techincal and Fundamental analysis you have learned by reading it. Thus you can know if the stock is currently investible or not based on the marks it scores out of 100. The book also covers various aspect of behavioural finance. Lot of people who have read the book consider it as a hand book to equity investing. Buy the book you will not be dissapointed as the book is reasonably priced. Search by the key words The Happy Candles Way to wealth creation and you will get it.
Disclaimer: The above information is provided for educational purpose, analysis and paper trading only. Please don't treat this as a buy or sell recommendation for the stock or index. The Techno-Funda analysis is based on data that is more than 3 months old. Supports and Resistances are determined by historic past peaks and Valley in the chart. Many other indicators and patterns like EMA, RSI, MACD, Volumes, Fibonacci, parallel channel etc. use historic data which is 3 months or older cyclical points. There is no guarantee they will work in future as markets are highly volatile and swings in prices are also due to macro and micro factors based on actions taken by the company as well as region and global events. Equity investment is subject to risks. I or my clients or family members might have positions in the stocks that we mention in our educational posts. We will not be responsible for any Profit or loss that may occur due to any financial decision taken based on any data provided in this message. Do consult your investment advisor before taking any financial decisions. Stop losses should be an important part of any investment in equity.

Nifty levels - Oct 13, 2025Nifty support and resistance levels are valuable tools for making informed trading decisions, specifically when combined with the analysis of 5-minute timeframe candlesticks and VWAP. By closely monitoring these levels and observing the price movements within this timeframe, traders can enhance the accuracy of their entry and exit points. It is important to bear in mind that support and resistance levels are not fixed, and they can change over time as market conditions evolve.
The dashed lines on the chart indicate the reaction levels, serving as additional points of significance to consider. Furthermore, take note of the response at the levels of the High, Low, and Close values from the day prior.
We hope you find this information beneficial in your trading endeavors.
* If you found the idea appealing, kindly tap the Boost icon located below the chart. We encourage you to share your thoughts and comments regarding it.
Wishing you success in your trading activities!

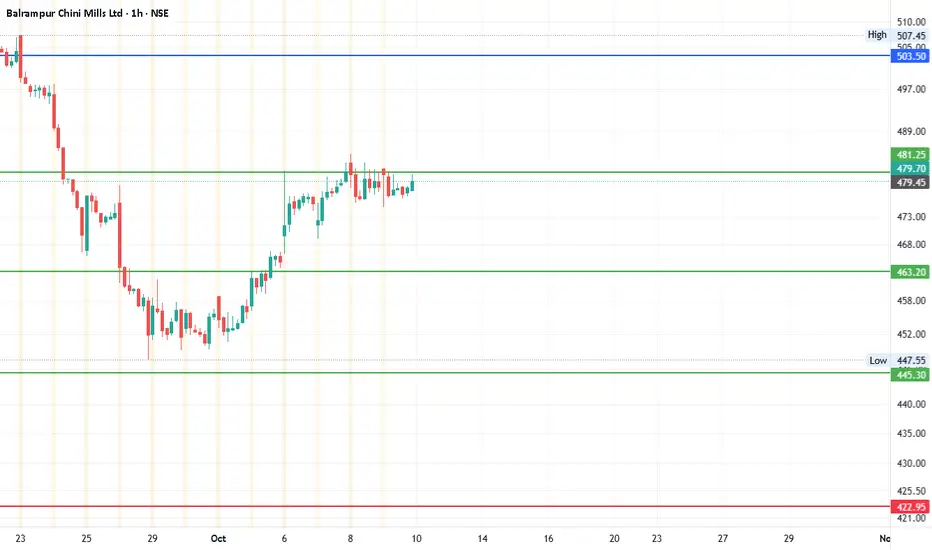
#Balramchin - Range between 354 and 573?Date: 09-10-2025
#Balramchin - Current Price: 479.7
Pivot Point: 463 Resistance: 481 Support: 445
Upside Levels:
L1: 504
L2: 526
L3: 549
L4: 573
Downside Levels:
L1: 423
L2: 401
L3: 377
L4: 354
Quick Updates on X
#TradingView #Nifty #BankNifty #DJI #NDQ #SENSEX #DAX #USOIL #GOLD #SILVER
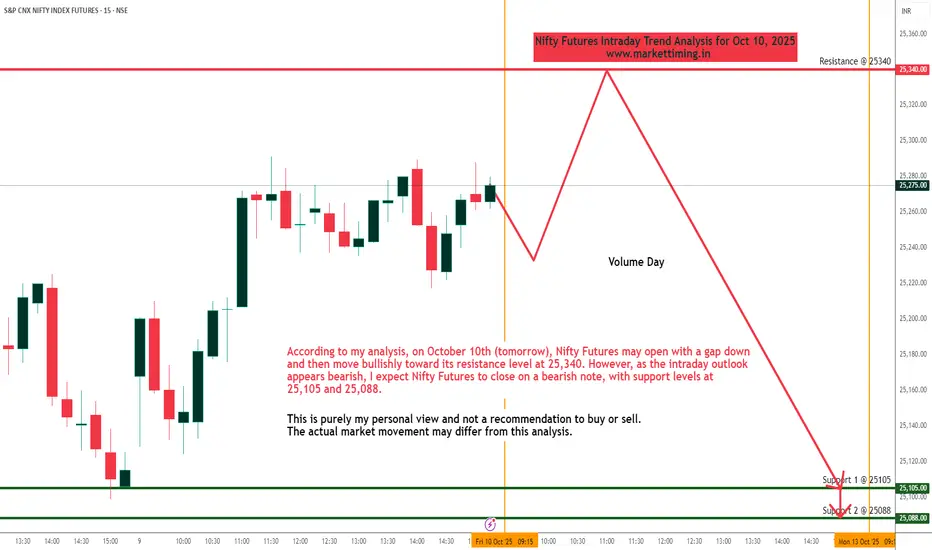
Nifty Futures Intraday Trend Analysis for October 10, 2025According to my analysis, on October 10th (tomorrow), Nifty Futures may open with a gap down and then move bullishly toward its resistance level at 25,340. However, as the intraday outlook appears bearish, I expect Nifty Futures to close on a bearish note, with support levels at 25,105 and 25,088.
This is purely my personal view and not a recommendation to buy or sell. The actual market movement may differ from this analysis.
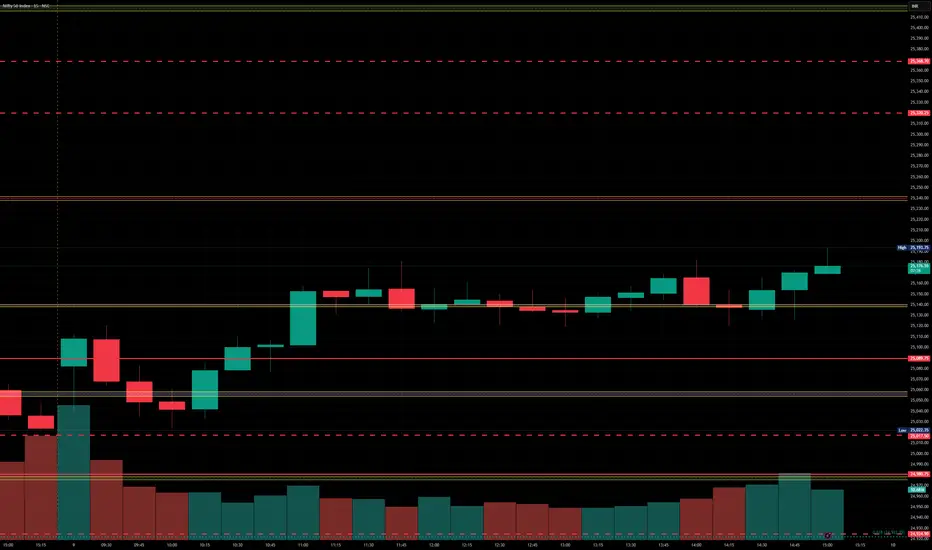
Nifty levels - Oct 10, 2025Nifty support and resistance levels are valuable tools for making informed trading decisions, specifically when combined with the analysis of 5-minute timeframe candlesticks and VWAP. By closely monitoring these levels and observing the price movements within this timeframe, traders can enhance the accuracy of their entry and exit points. It is important to bear in mind that support and resistance levels are not fixed, and they can change over time as market conditions evolve.
The dashed lines on the chart indicate the reaction levels, serving as additional points of significance to consider. Furthermore, take note of the response at the levels of the High, Low, and Close values from the day prior.
We hope you find this information beneficial in your trading endeavors.
* If you found the idea appealing, kindly tap the Boost icon located below the chart. We encourage you to share your thoughts and comments regarding it.
Wishing you success in your trading activities!
Nifty levels - Oct 09, 2025Nifty support and resistance levels are valuable tools for making informed trading decisions, specifically when combined with the analysis of 5-minute timeframe candlesticks and VWAP. By closely monitoring these levels and observing the price movements within this timeframe, traders can enhance the accuracy of their entry and exit points. It is important to bear in mind that support and resistance levels are not fixed, and they can change over time as market conditions evolve.
The dashed lines on the chart indicate the reaction levels, serving as additional points of significance to consider. Furthermore, take note of the response at the levels of the High, Low, and Close values from the day prior.
We hope you find this information beneficial in your trading endeavors.
* If you found the idea appealing, kindly tap the Boost icon located below the chart. We encourage you to share your thoughts and comments regarding it.
Wishing you success in your trading activities!

Nifty levels - Oct 08, 2025Nifty support and resistance levels are valuable tools for making informed trading decisions, specifically when combined with the analysis of 5-minute timeframe candlesticks and VWAP. By closely monitoring these levels and observing the price movements within this timeframe, traders can enhance the accuracy of their entry and exit points. It is important to bear in mind that support and resistance levels are not fixed, and they can change over time as market conditions evolve.
The dashed lines on the chart indicate the reaction levels, serving as additional points of significance to consider. Furthermore, take note of the response at the levels of the High, Low, and Close values from the day prior.
We hope you find this information beneficial in your trading endeavors.
* If you found the idea appealing, kindly tap the Boost icon located below the chart. We encourage you to share your thoughts and comments regarding it.
Wishing you success in your trading activities!

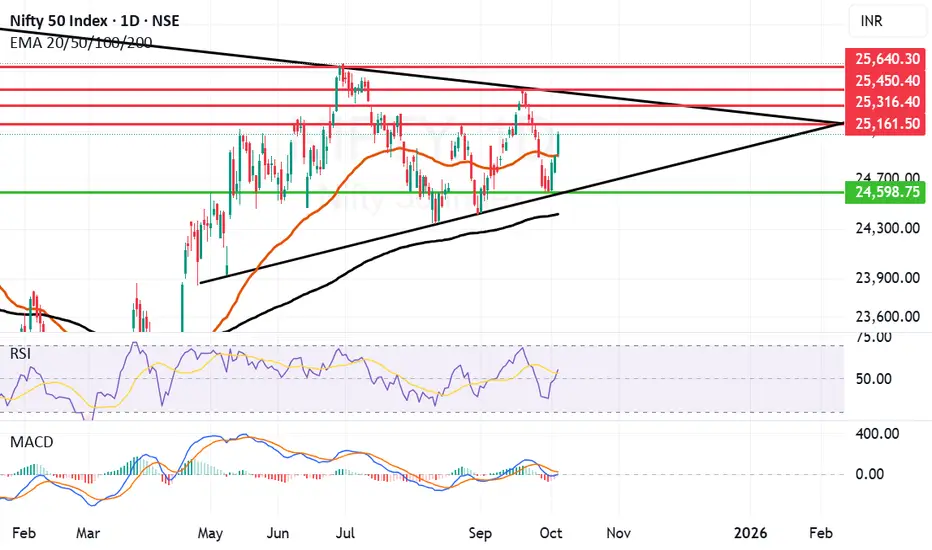
Great Closing above Motherline of Daily Chart. Nifty has given a brilliant closing above Mother line of daily chart and key psychological level of 25K at 25077. Supports for Nifty are at Mother line 24899, Trend line support at 24598 and finally Father line support at 24417. Resistances are at 25161, 25316 and 25450 and finally 25640.
Above 25640 there will be a major Bullish breakout which can take us to 26K or even previous All time high or even beyond it. It will be very important for Nifty to hold the levels now and again not go below the Mother or Father line otherwise again all the momentum that has built in favour of the rally will vanish as quickly.
Having said that RSI, MACD and shadow of the candle suggest are oozing with confidence this time let us see what this week and month holds for us, things look good as of now.
Disclaimer: The above information is provided for educational purpose, analysis and paper trading only. Please don't treat this as a buy or sell recommendation for the stock or index. The Techno-Funda analysis is based on data that is more than 3 months old. Supports and Resistances are determined by historic past peaks and Valley in the chart. Many other indicators and patterns like EMA, RSI, MACD, Volumes, Fibonacci, parallel channel etc. use historic data which is 3 months or older cyclical points. There is no guarantee they will work in future as markets are highly volatile and swings in prices are also due to macro and micro factors based on actions taken by the company as well as region and global events. Equity investment is subject to risks. I or my clients or family members might have positions in the stocks that we mention in our educational posts. We will not be responsible for any Profit or loss that may occur due to any financial decision taken based on any data provided in this message. Do consult your investment advisor before taking any financial decisions. Stop losses should be an important part of any investment in equity.