Nifty Analysis EOD – September 10, 2025 – Wednesday🟢 Nifty Analysis EOD – September 10, 2025 – Wednesday 🔴
📌 Doji at Resistance – Market in Consolidation Grip
🗞 Nifty Summary
Nifty opened with a 114-point gap-up, well above the previous day’s high and right in the middle of the strong resistance zone of 24,975 ~ 25,004. Initially, the index attempted to stabilize and hold above 25,000, but couldn’t sustain the level. It gradually lost ground, broke the VWAP and day’s low, marking a low of 24,915.
A recovery of 75 points from the low brought Nifty back to 24,977.5 at close, resulting in a Doji candle formed near the middle of the resistance zone.
Such large gap-ups or gap-downs are not favorable for intraday players, and positional BTST option buyers were left vulnerable, as the first-minute slip wiped out initial gains.
🛡 5 Min Intraday Chart with Levels
📉 Daily Time Frame Chart with Intraday Levels
🕯 Daily Candle Breakdown
Open: 24,991.00
High: 25,035.70
Low: 24,915.05
Close: 24,973.10
Change: +104.50 (+0.42%)
🏗️ Structure Breakdown
Red candle (Close < Open).
Body: 17.90 points → small.
Upper wick: 44.70 points.
Lower wick: 58.05 points.
This forms a Spinning Top-type candle with long shadows on both sides → indicative of intraday tug-of-war.
📚 Interpretation
Market opened near 25,000, briefly touched 25,035, but sellers rejected higher levels.
Buyers defended 24,915, as seen from the long lower wick.
Closing slightly below open signals mild bearish pressure despite overall gains compared to the previous close.
This is a classic indecision candle, with bulls managing to hold ground but failing to assert dominance.
🕯Candle Type
Spinning Top / Indecision Candle with balanced pressure leaning slightly bearish (due to red close).
📉📈 Short-Term View – September 11, 2025
Support: 24,910 – 24,915 (defended today).
Resistance: 25,030 – 25,050 (strong supply zone with multiple rejections).
👉 Key Insight:
Bulls are trying to protect 24,900 but facing strong resistance near 25,030–25,050.
Market is consolidating and coiling tighter between 24,900–25,050.
A breakout above 25,050 may trigger fresh momentum towards 25,160, while a dip below 24,900 opens risk toward 24,750.
🛡 5 Min Intraday Chart
⚔️ Gladiator Strategy Update
ATR: 193.36
IB Range: 59.3 → Small
Market Structure: Balanced
Trade Highlights:
10:30 AM – Long Trigger → SL Hit
13:20 PM – Short Trigger → SL Hit
📌 Support & Resistance Levels
Resistance Zones:
24,975 ~ 25,004
25,035 ~ 25,140
25,160
Support Zones:
24,915 ~ 24,895
24,845 ~ 24,835
24,785
💡 Final Thoughts
Today’s indecisive spinning top reflects a market stuck in consolidation, caught between supply and demand. Until a decisive breakout occurs, avoid large positional bets and remain focused on intraday tactical trades.
📖 “Patience in consolidation builds the strongest trends later.”
✏️ Disclaimer
This is just my personal viewpoint. Always consult your financial advisor before taking any action.
Niftylevels

Good Closing By Nifty On Hourly ChartNifty has finally closed above the Mother and Father resistance line on the hourly chart. We have tried to draw the Fibonacci retracement based on recent movements of Nifty which can be seen in the chart. We can clearly see the places from where Nifty found resistance recently where Fibonacci lines and places where Nifty took support where also Fibonacci lines.
To know more about Fibonacci retracement and use them for trading/investing you can read my book THE HAPPY CANDLES WAY TO WEALTH CREATION. In this book you can also know more about Trend lines, Supports, Resistances, Mother line and Father line and to draw the same on your chart and for learning Techo-Funda analysis read my Book THE HAPPY CANDLES WAY TO WEALTH CREATION. Heart of the book is my Mother, Father and Small child theory which makes investment easy for those who understand it an use it in their analysis. The book is available on Amazon and will help you in your investing journey whether you are a seasoned investor or a new beginner. The chapters in the book are mostly standalone. The book is rated 4.8/5 on Amazon. It is a value for money book priced at Rs.349/- (Delivery charges extra as charged by Amazon).
Now the next Fibonacci level resistances for Nifty will be at: 24994(Tough Trend line resistnace and Fibonacci resistance, 25152, 25378 and 25669. Above 25669 closing the major Bull run can begin which can take Nifty towards 26K+ levels indicated in the chart.
Mother line and Father line are both supports as of now these are at 24760 and 24783. So the zone between 24760 and 24783 becomes a very strong support zone.
Fibonacci supports for Nifty will be at: 24645 and 24337. A closing below 24337 will create a bear grip on the market which can drag if further downwards.
As of now the shadow of the candles is looking positive and green in colour.
Disclaimer: The above information is provided for educational purpose, analysis and paper trading only. Please don't treat this as a buy or sell recommendation for the stock or index. The Techno-Funda analysis is based on data that is more than 3 months old. Supports and Resistances are determined by historic past peaks and Valley in the chart. Many other indicators and patterns like EMA, RSI, MACD, Volumes, Fibonacci, parallel channel etc. use historic data which is 3 months or older cyclical points. There is no guarantee they will work in future as markets are highly volatile and swings in prices are also due to macro and micro factors based on actions taken by the company as well as region and global events. Equity investment is subject to risks. I or my clients or family members might have positions in the stocks that we mention in our educational posts. We will not be responsible for any Profit or loss that may occur due to any financial decision taken based on any data provided in this message. Do consult your investment advisor before taking any financial decisions. Stop losses should be an important part of any investment in equity.

Nifty levels - Sep 11, 2025Nifty support and resistance levels are valuable tools for making informed trading decisions, specifically when combined with the analysis of 5-minute timeframe candlesticks and VWAP. By closely monitoring these levels and observing the price movements within this timeframe, traders can enhance the accuracy of their entry and exit points. It is important to bear in mind that support and resistance levels are not fixed, and they can change over time as market conditions evolve.
The dashed lines on the chart indicate the reaction levels, serving as additional points of significance to consider. Furthermore, take note of the response at the levels of the High, Low, and Close values from the day prior.
We hope you find this information beneficial in your trading endeavors.
* If you found the idea appealing, kindly tap the Boost icon located below the chart. We encourage you to share your thoughts and comments regarding it.
Wishing you success in your trading activities!

NIFTY KEY LEVELS FOR 10.09.2025NIFTY KEY LEVELS FOR 10.09.2025
RTF: 3 Minutes
If the candle stays above the pivot point, it is considered a bullish bias; if it remains below, it indicates a bearish bias. Price may reverse near Resistance 1 or Support 1. If it moves further, the next potential reversal zone is near Resistance 2 or Support 2. If these levels are also broken, we can expect the trend.
If the range(R2-S2) is narrow, the market may become volatile or trend strongly. If the range is wide, the market is more likely to remain sideways
📢 Disclaimer
I am not a SEBI-registered financial adviser.
The information, views, and ideas shared here are purely for educational and informational purposes only. They are not intended as investment advice or a recommendation to buy, sell, or hold any financial instruments.
Please consult with your SEBI-registered financial advisor before making any trading or investment decisions.
Trading and investing in the stock market involves risk, and you should do your own research and analysis. You are solely responsible for any decisions made based on this research.
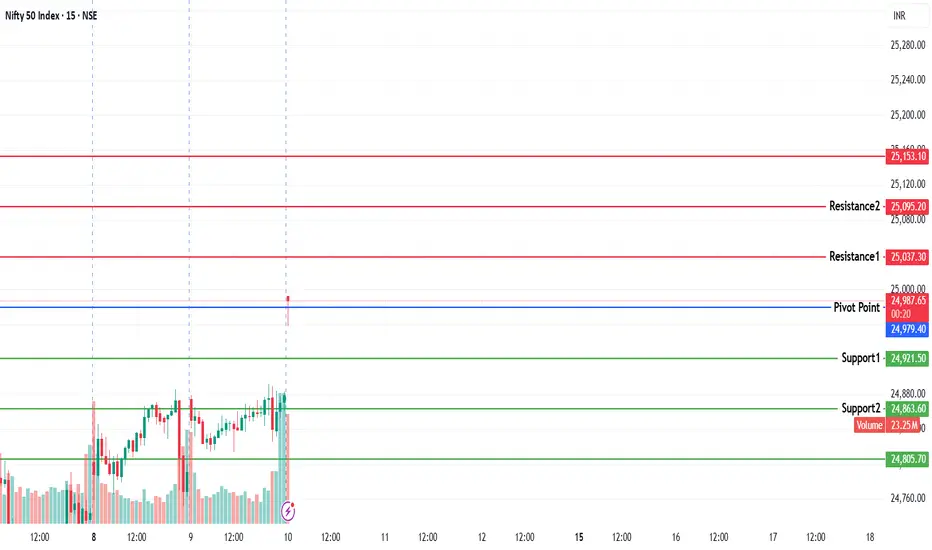
#NIFTY Intraday Support and Resistance Levels - 10/09/2025Nifty is expected to witness a gap up opening, continuing its momentum within the broader consolidation zone. The index has been trading in a tight range, and today’s levels will be crucial to determine the intraday direction.
On the upside, if Nifty sustains above 24,700–24,750, buying momentum could push it towards 24,850, 24,900, and 24,950+. A breakout above 25,050 would signal strong bullish sentiment, opening the way for further targets at 25,150, 25,200, and 25,250+.
On the downside, weakness may come into play if Nifty slips below 24,950–24,900. This could trigger a reversal towards 24,850, 24,800, and 24,750 levels. A break below 24,700 may extend the fall with deeper downside possibilities.
Overall, Nifty remains in a consolidation phase, and traders should focus on the breakout levels for clear intraday opportunities. A disciplined approach with strict stop-losses will be key in managing volatility around these zones.

Nifty AnalysisNifty formed a Green candle in daily timeframe with upper and long lower shadow. Nifty is above short term EMA in daily timeframe (20,50,100). Though it supports Bullish sentiment, Nifty is nearing strong resistance around 25,000.
Nifty may attempt to fill the Gap created on 26th Aug.
Green Path: If Nifty breaks and sustains above 24,990, then Nifty may reach 25,110 - 25,140 - 25,180.
Red Path: If Nifty fails to break and sustain above 24,990, then Nifty may reach 24,840 - 24,755 - 24,600

Nifty levels - Sep 10, 2025Nifty support and resistance levels are valuable tools for making informed trading decisions, specifically when combined with the analysis of 5-minute timeframe candlesticks and VWAP. By closely monitoring these levels and observing the price movements within this timeframe, traders can enhance the accuracy of their entry and exit points. It is important to bear in mind that support and resistance levels are not fixed, and they can change over time as market conditions evolve.
The dashed lines on the chart indicate the reaction levels, serving as additional points of significance to consider. Furthermore, take note of the response at the levels of the High, Low, and Close values from the day prior.
We hope you find this information beneficial in your trading endeavors.
* If you found the idea appealing, kindly tap the Boost icon located below the chart. We encourage you to share your thoughts and comments regarding it.
Wishing you success in your trading activities!

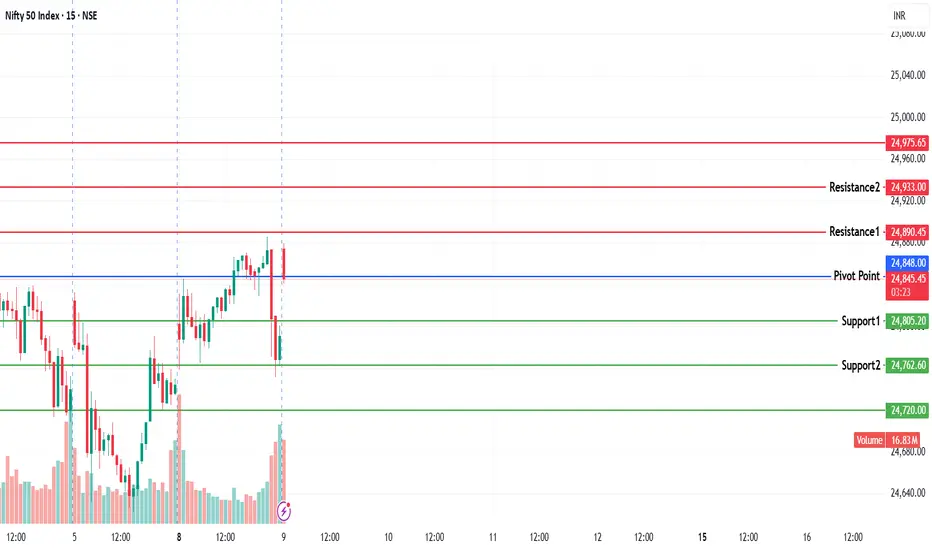
NIFTY KEY LEVELS FOR 09.09.2025NIFTY KEY LEVELS FOR 09.09.2025
RTF: 3 Minutes
If the candle stays above the pivot point, it is considered a bullish bias; if it remains below, it indicates a bearish bias. Price may reverse near Resistance 1 or Support 1. If it moves further, the next potential reversal zone is near Resistance 2 or Support 2. If these levels are also broken, we can expect the trend.
If the range(R2-S2) is narrow, the market may become volatile or trend strongly. If the range is wide, the market is more likely to remain sideways
📢 Disclaimer
I am not a SEBI-registered financial adviser.
The information, views, and ideas shared here are purely for educational and informational purposes only. They are not intended as investment advice or a recommendation to buy, sell, or hold any financial instruments.
Please consult with your SEBI-registered financial advisor before making any trading or investment decisions.
Trading and investing in the stock market involves risk, and you should do your own research and analysis. You are solely responsible for any decisions made based on this research.
Mother Line Resistance and Trend line Resistance stopping Nifty.Two important Resistances on the daily chart Mother line at 24788 and Trend line which is at 24910 are stopping Nifty from flying high. The sectoral index providing maximum support and allowing Nifty to hold above 24700 is defiantly Auto sector which is doing heavy weight lifting. Again today Auto index rose by 3.3%. It can still grow a bit but it is clearly entering the overbought zone. The sector looking most laggard is IT index. Again today it fell close to 1% with no respite in sight with torrid signals still coming from US.
With this seesaw battle continuing Resistances for Nifty currently are at: 24788 (Mother line resistance) and 24910 trendline resistance. If these 2 resistances are crossed the major resistances will be at 25K, 25149 and 25245. Above 25245 Nifty can grow stronger and reach bullish territory.
Supports for Nifty currently remain at: 24621, 24486 (trendline support), 24409 and finally 24292 (Father line Support). A closing below 24292 will drag Nifty further downwards into a strong bearish territory.
Nifty can rise from here and reach 24910 where it will be tested or it can fall towards 24621 or 24486 and then again try to rise towards the trend line at 24910. Which path it will take is yet to be deciphered.
To know more about Trend lines, Supports, Resistances, Mother line and Father line and to draw the same on your chart and for learning Techo-Funda analysis read my Book THE HAPPY CANDLES WAY TO WEALTH CREATION. The book is available on Amazon and will help you in your investing journey whether you are a seasoned investor or a new beginner. The chapters in the book are mostly standalone. The book is rated 4.8/5 on Amazon. It is a value for money book priced at Rs.349/- (Delivery charges extra as charged by Amazon).
Disclaimer: The above information is provided for educational purpose, analysis and paper trading only. Please don't treat this as a buy or sell recommendation for the stock or index. The Techno-Funda analysis is based on data that is more than 3 months old. Supports and Resistances are determined by historic past peaks and Valley in the chart. Many other indicators and patterns like EMA, RSI, MACD, Volumes, Fibonacci, parallel channel etc. use historic data which is 3 months or older cyclical points. There is no guarantee they will work in future as markets are highly volatile and swings in prices are also due to macro and micro factors based on actions taken by the company as well as region and global events. Equity investment is subject to risks. I or my clients or family members might have positions in the stocks that we mention in our educational posts. We will not be responsible for any Profit or loss that may occur due to any financial decision taken based on any data provided in this message. Do consult your investment advisor before taking any financial decisions. Stop losses should be an important part of any investment in equity.

Nifty levels - Sep 09, 2025Nifty support and resistance levels are valuable tools for making informed trading decisions, specifically when combined with the analysis of 5-minute timeframe candlesticks and VWAP. By closely monitoring these levels and observing the price movements within this timeframe, traders can enhance the accuracy of their entry and exit points. It is important to bear in mind that support and resistance levels are not fixed, and they can change over time as market conditions evolve.
The dashed lines on the chart indicate the reaction levels, serving as additional points of significance to consider. Furthermore, take note of the response at the levels of the High, Low, and Close values from the day prior.
We hope you find this information beneficial in your trading endeavors.
* If you found the idea appealing, kindly tap the Boost icon located below the chart. We encourage you to share your thoughts and comments regarding it.
Wishing you success in your trading activities!

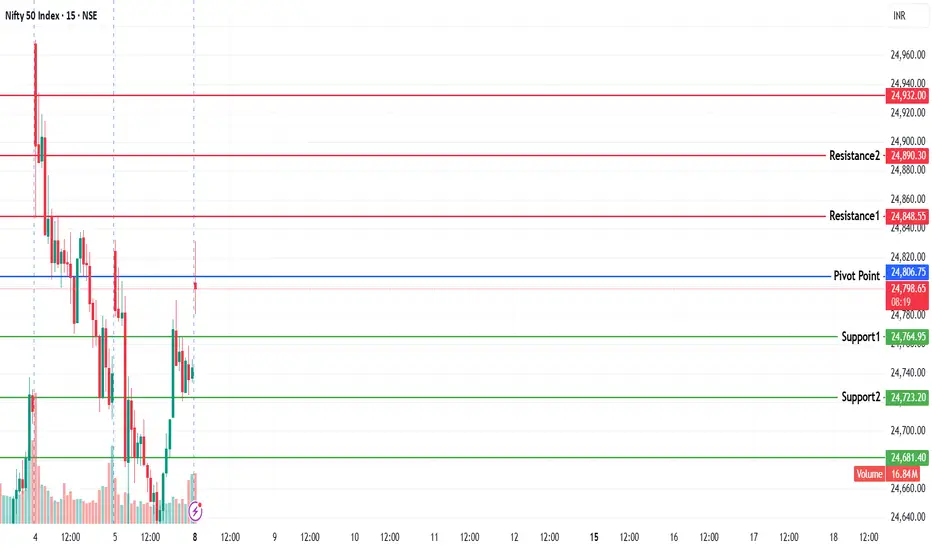
NIFTY KEY LEVELS FOR 08.09.2025NIFTY KEY LEVELS FOR 08.09.2025
RTF: 3 Minutes
If the candle stays above the pivot point, it is considered a bullish bias; if it remains below, it indicates a bearish bias. Price may reverse near Resistance 1 or Support 1. If it moves further, the next potential reversal zone is near Resistance 2 or Support 2. If these levels are also broken, we can expect the trend.
If the range(R2-S2) is narrow, the market may become volatile or trend strongly. If the range is wide, the market is more likely to remain sideways
📢 Disclaimer
I am not a SEBI-registered financial adviser.
The information, views, and ideas shared here are purely for educational and informational purposes only. They are not intended as investment advice or a recommendation to buy, sell, or hold any financial instruments.
Please consult with your SEBI-registered financial advisor before making any trading or investment decisions.
Trading and investing in the stock market involves risk, and you should do your own research and analysis. You are solely responsible for any decisions made based on this research.
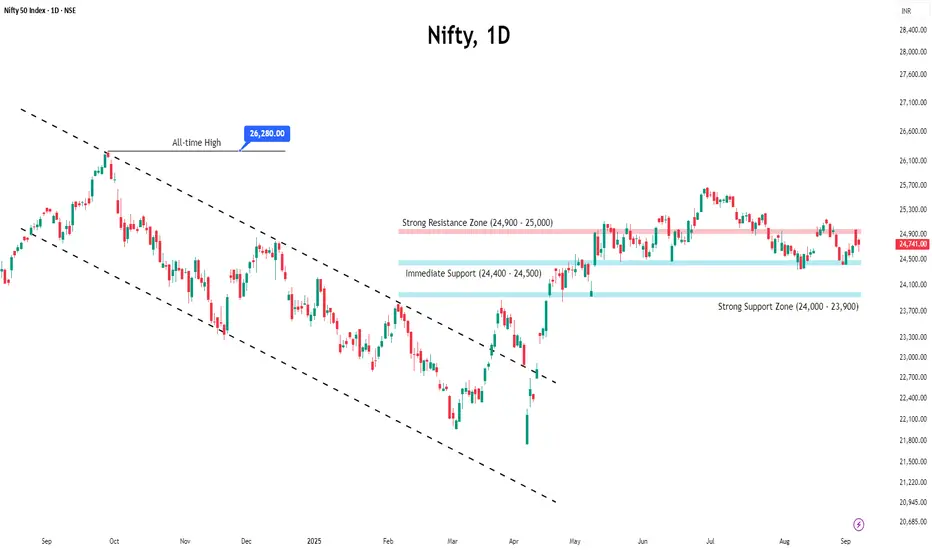
Nifty Wraps Week Positive: Sustainability in QuestionIndian equity markets closed the week with strong gains, with the Nifty rising 1.29% supported by solid domestic economic data and policy reforms.
Key economic indicators like Q1 GDP growth at 7.8%, steady FDI inflows, and a smaller current account deficit have boosted investor confidence.
Despite these positives, global challenges and heavy FII selling over the last two months (₹94,600 crore) still pose risks.
Sector-wise, the picture is mixed. While the overall market outlook is positive, weakness in banking and IT is restraining gains. A rebound in these sectors is crucial for the uptrend to sustain.
Technically, the index faces immediate resistance at the 24,950–25,000 zone, with support positioned at 24,500–24,400.
A decisive breakout from this range is needed to establish the next directional trend; otherwise, the market is poised for a period of consolidation.
Nifty staring at couple of important resistances next week. Nifty is looking at few resistances before it can breakfree. The resistance immediately in front of Nifty is 24748. Once this resistance is crossed then there will be Father line of hourly chart which will again act as resistance. Father line of hourly chart remains at 24775. Once we get a closing above these 2 levels then Nifty can further grow towards 24835, 24930 and 25000. If we get a closing above 25K then the next resistance will be at 25126.
Supports for Nifty currently are at 24701 (Mother line Support of hourly chart) if we get a closing below this level then few other supports will be at 24645, 24559, 24465 (Trend line Support) and 24350.
Closing below 24350 will make Nifty very week. GST reforms are trying to support the Nifty which is being pushed down by Trump Tariffs and other Macro factors.
Disclaimer: The above information is provided for educational purpose, analysis and paper trading only. Please don't treat this as a buy or sell recommendation for the stock or index. The Techno-Funda analysis is based on data that is more than 3 months old. Supports and Resistances are determined by historic past peaks and Valley in the chart. Many other indicators and patterns like EMA, RSI, MACD, Volumes, Fibonacci, parallel channel etc. use historic data which is 3 months or older cyclical points. There is no guarantee they will work in future as markets are highly volatile and swings in prices are also due to macro and micro factors based on actions taken by the company as well as region and global events. Equity investment is subject to risks. I or my clients or family members might have positions in the stocks that we mention in our educational posts. We will not be responsible for any Profit or loss that may occur due to any financial decision taken based on any data provided in this message. Do consult your investment advisor before taking any financial decisions. Stop losses should be an important part of any investment in equity.

Nifty levels - Sep 08, 2025Nifty support and resistance levels are valuable tools for making informed trading decisions, specifically when combined with the analysis of 5-minute timeframe candlesticks and VWAP. By closely monitoring these levels and observing the price movements within this timeframe, traders can enhance the accuracy of their entry and exit points. It is important to bear in mind that support and resistance levels are not fixed, and they can change over time as market conditions evolve.
The dashed lines on the chart indicate the reaction levels, serving as additional points of significance to consider. Furthermore, take note of the response at the levels of the High, Low, and Close values from the day prior.
We hope you find this information beneficial in your trading endeavors.
* If you found the idea appealing, kindly tap the Boost icon located below the chart. We encourage you to share your thoughts and comments regarding it.
Wishing you success in your trading activities!

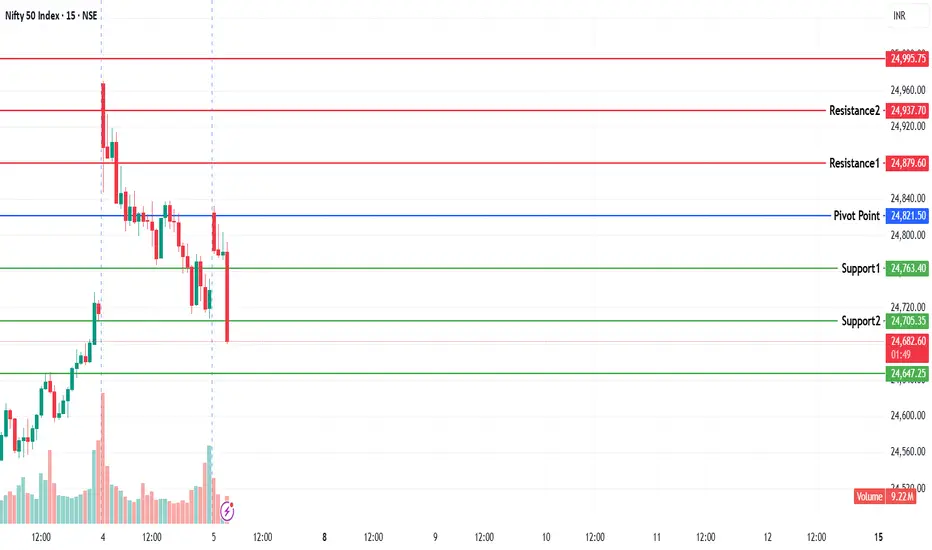
NIFTY KEY LEVELS FOR 05.09.2025NIFTY KEY LEVELS FOR 05.09.2025
RTF: 3 Minutes
If the candle stays above the pivot point, it is considered a bullish bias; if it remains below, it indicates a bearish bias. Price may reverse near Resistance 1 or Support 1. If it moves further, the next potential reversal zone is near Resistance 2 or Support 2. If these levels are also broken, we can expect the trend.
If the range(R2-S2) is narrow, the market may become volatile or trend strongly. If the range is wide, the market is more likely to remain sideways
📢 Disclaimer
I am not a SEBI-registered financial adviser.
The information, views, and ideas shared here are purely for educational and informational purposes only. They are not intended as investment advice or a recommendation to buy, sell, or hold any financial instruments.
Please consult with your SEBI-registered financial advisor before making any trading or investment decisions.
Trading and investing in the stock market involves risk, and you should do your own research and analysis. You are solely responsible for any decisions made based on this research.
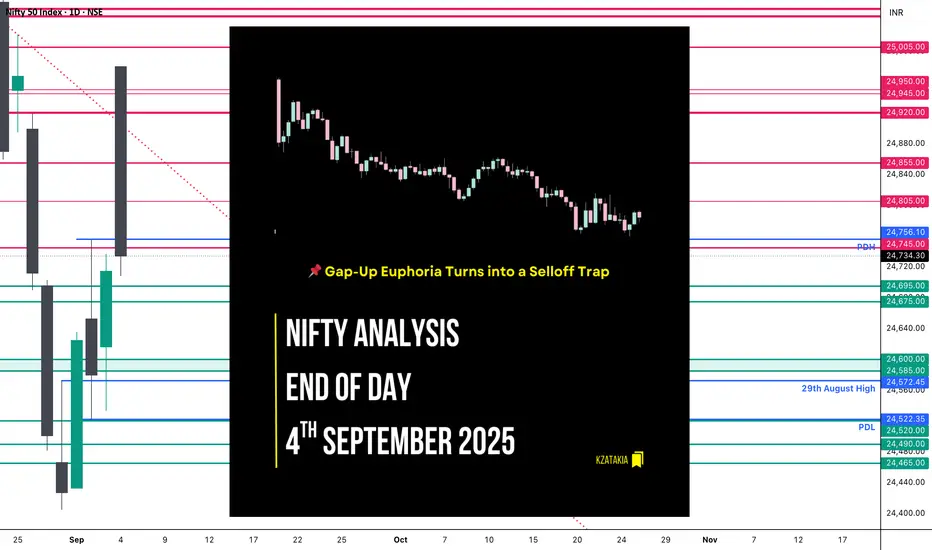
Nifty Analysis EOD – September 4, 2025 – Thursday🟢 Nifty Analysis EOD – September 4, 2025 – Thursday 🔴
📌 Gap-Up Euphoria Turns into a Selloff Trap
🗞 Nifty Summary
A news-driven opening saw Nifty gap up by 254 points at 24,970, immediately triggering all upside targets from the prior day’s Inside Bar pattern. But the euphoria didn’t last long—profit booking hit in the very first 5 minutes. By 10 AM, once the IB Low broke, selling intensified and the index never even tested VWAP for the rest of the session.
Despite intraday swings of over 230 points from high to close, the index managed to end almost flat at 24,739.80 (+26 pts)—back to square one. Yesterday was about a bottom reversal; today screamed rejection at higher levels. The mixed signals leave direction uncertain.
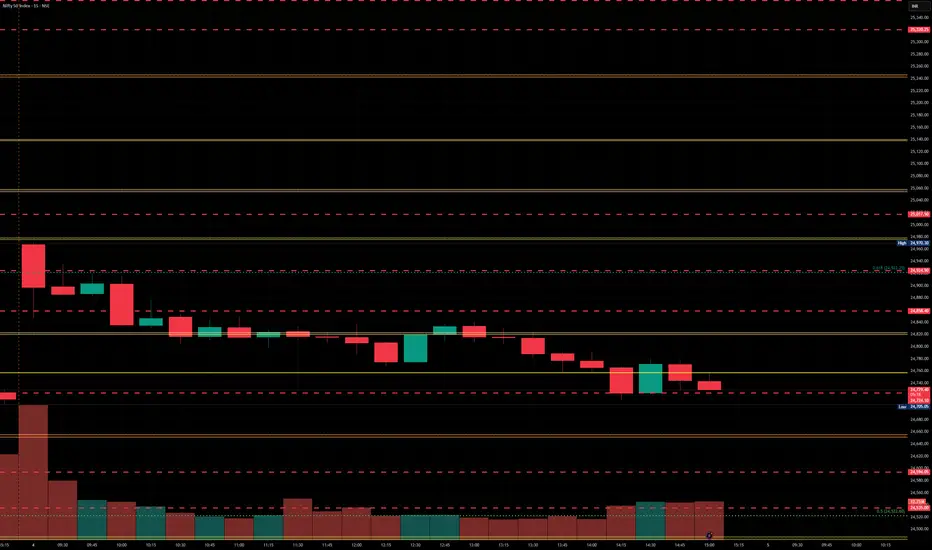
🛡 5 Min Intraday Chart with Levels
📉 Daily Time Frame Chart with Intraday Levels
🕯️ Daily Candle Breakdown
Open: 24,980.75
High: 24,980.75
Low: 24,708.20
Close: 24,734.30
Change: +19.25 (+0.08%)
🏗️ Structure Breakdown
Red candle (Close < Open) despite being marginally positive vs. yesterday.
Body: 246.45 points → large bearish body.
Upper wick: 0 (open = high).
Lower wick: 26.10 points → very small.
🕯Candle Type
Bearish Marubozu (Gap-Up Failure) → supply rejection at upper zone.
📚 Interpretation
Sharp gap-up faded instantly—a textbook bull trap.
Relentless intraday selling pressure; buyers weakly defended lows.
Closing just above key support keeps the tug-of-war alive, but momentum favors sellers.
🔍 Short-Term View – September 5, 2025
Resistance: 24,980–25,000 (failed breakout zone).
Support: 24,700 (tested today, critical).
👉 In short: Today marks exhaustion at the top. Unless Nifty reclaims 24,980–25,000, the risk of sliding back toward 24,600–24,520 remains high.
🛡 5 Min Intraday Chart
⚔️ Gladiator Strategy Update
ATR: 211.71
IB Range: 123.05 → Medium
Market Structure: Imbalanced
Trade Highlights: No trade triggered today.
📌 Support & Resistance Levels
Resistance Zones:
24,740 ~ 24,760
24,805
24,855
24,900 ~ 24,920
Support Zones:
24,695 ~ 24,675
24,600 ~ 24,585
24,520
24,490 ~ 24,465
💡 Final Thoughts
The market teased the bulls with a powerful gap-up, only to hand the reins to sellers. This kind of gap-up failure is often a strong reversal signal. For now, traders should respect the 24,700 support zone—break it, and the downside may accelerate.
📖 “Markets don’t reward euphoria; they test conviction.”
✏️ Disclaimer
This is just my personal viewpoint. Always consult your financial advisor before taking any action.
After good start Nifty fizzles under trend line + Trump PressureAfter the announcements of GST reforms Nifty started the day with the bang reaching 24980 just short of 25K but selling pressure came immediately after Nifty hit the trend line resistance. Also Bears took the advantage of the rally to short the Nifty on account of Trump's fresh salvo of further increasing Tariffs on India in phase 2 and phase 3. The results of GST reforms will shortly start showing within a quarter or 2. The FMCG, Auto, Auto ancillaries, Insurance and health care, Consumption, Infrastructure and to some extent Capital Goods, Home appliances, Travel and Holiday will definitely get a boost in the long run.
It is not easy to close above Father line resistance if you have read my Mother Father and Small child theory you know that. If not you can read my book THE HAPPY CANDLES WAY TO WEALTH CREATION. The book is available on Amazon and is one of the highest rated books in the category.
Resistance for Nifty remain at: 24781 (Father line resistance), 24880, 24980 (Trend line resistance), 25081 and 25172. (Above this level Bulls will become more active).
Supports for Nifty remain at: 24700 (Mother line support), 24660 (Trend line support), 24515, 24397 and finally 24339 (Below this support there will be total bear grip).
Disclaimer: The above information is provided for educational purpose, analysis and paper trading only. Please don't treat this as a buy or sell recommendation for the stock or index. The Techno-Funda analysis is based on data that is more than 3 months old. Supports and Resistances are determined by historic past peaks and Valley in the chart. Many other indicators and patterns like EMA, RSI, MACD, Volumes, Fibonacci, parallel channel etc. use historic data which is 3 months or older cyclical points. There is no guarantee they will work in future as markets are highly volatile and swings in prices are also due to macro and micro factors based on actions taken by the company as well as region and global events. Equity investment is subject to risks. I or my clients or family members might have positions in the stocks that we mention in our educational posts. We will not be responsible for any Profit or loss that may occur due to any financial decision taken based on any data provided in this message. Do consult your investment advisor before taking any financial decisions. Stop losses should be an important part of any investment in equity.

Nifty levels - Sep 05, 2025Nifty support and resistance levels are valuable tools for making informed trading decisions, specifically when combined with the analysis of 5-minute timeframe candlesticks and VWAP. By closely monitoring these levels and observing the price movements within this timeframe, traders can enhance the accuracy of their entry and exit points. It is important to bear in mind that support and resistance levels are not fixed, and they can change over time as market conditions evolve.
The dashed lines on the chart indicate the reaction levels, serving as additional points of significance to consider. Furthermore, take note of the response at the levels of the High, Low, and Close values from the day prior.
We hope you find this information beneficial in your trading endeavors.
* If you found the idea appealing, kindly tap the Boost icon located below the chart. We encourage you to share your thoughts and comments regarding it.
Wishing you success in your trading activities!
NIFTY view for coming daysNifty 50 index view for upcoming sessions.
DAILY Time Frame (TF) -
Trend - Up
Direction - Down (Forming HL)
Upcoming - HL (Tested Extreme HL Zone Once)
2/3/4 Hr TF -
Trend - Up
Direction - Up (Forming HH)
Upcoming - HH(Pending Retracement)
1 Hr TF -
Trend - Uptrend Reversal (To be Downtrend)
Direction - ?
Upcoming - LH (Pending break of previous LL)
15 Min TF -
Trend - Downtrend Reversal (To be Uptrend)
Direction - ?
Upcoming - HL (Pending break of previous HH)
5 mins Uptrend
Summary -
Market is turning Bullish in lower TF
Higher TF like 1 Hr is waiting for LH which maybe formed around 25342 - 25432
Further stretch can also lead index to extend till 25682
Motto is to form a HL which needs to be below 30th June High (25669.35)
Conditions -
LL in 1 Hr is intact (24337.5)
Low in 15 min is intact (24337.5)

Nifty Analysis EOD – September 3, 2025 – Wednesday🟢 Nifty Analysis EOD – September 3, 2025 – Wednesday 🔴
🚀 Inside-Day Rebound: Bulls Eye 24,760 Breakout
🗞 Nifty Summary
Early in the morning, Gift Nifty indicated a gap of more than 50 points, yet surprisingly, Nifty opened with a GapUp of 55 points. Within the first 5 minutes, it lost 97 points and matched Gift Nifty.
The first 5-min range formed at 24,533 ~ 24,630, and the first half of the session was spent consolidating inside this band. Around 12 PM, a breakout attempt above the range high failed to sustain. However, support at 24,600 held firm, and on the second attempt, bulls pushed strongly, breaking past the range high and rallying without looking back, marking the day high at 24,737.
By the close, Nifty held strong near the high at 24,713.6, almost covering yesterday’s lost ground.
🛡 5 Min Intraday Chart with Levels
🔮 Key Takeaway:
The move stayed entirely inside the previous day’s range.
For bullish continuation, 24,745 ~ 24,760 needs to be broken and sustained.
If tomorrow brings a PDH breakout & hold, the upside levels to watch are 24,800, 24,855, and 24,900.
📉 Daily Time Frame Chart with Intraday Levels
🕯 Daily Candle Breakdown
Open: 24,616.50
High: 24,737.05
Low: 24,533.20
Close: 24,715.05
Change: +135.45 (+0.55%)
📊 Candle Structure
Green candle (Close > Open).
Body: 98.55 points → healthy bullish body.
Upper wick: 22.00 points → very small (close near high).
Lower wick: 83.30 points → strong defense by buyers near 24,533.
📌 This forms a near Bullish Marubozu (open near low, close near high).
🔍 Interpretation
Market opened with mixed sentiment but defended the 24,520 zone strongly.
Bulls stepped in and pushed the index steadily higher.
Closing near the high signals confidence and follow-up buying after yesterday’s hesitation.
🔦 Candle Type
Bullish Marubozu–like candle
Indicates strength and continuation potential.
📉📈 Short-Term View
Resistance: 24,740–24,760 zone (tested again today).
Support: 24,520 (bu
yers defended it successfully).
👉 In short:
Today’s session restored bullish momentum, closing near highs with strong buying interest. A breakout above 24,740–24,760 can open the path toward 24,900, while support remains firm at 24,520.
🛡 5 Min Intraday Chart
⚔️ Gladiator Strategy Update
ATR: 204.95
IB Range: 97.5 → Medium
Market Structure: Balanced
Trade Highlights:
1) 12:20 Long Trade Triggered → SL Hit
2) 13:50 Long Trade Triggered → Target Hit (R:R - 1:2)
📌 Support & Resistance Levels
Resistance Zones:
24,740 ~ 24,760
24,805
24,855
24,900 ~ 24,920
Support Zones:
24,600 ~ 24,585
24,520
24,490 ~ 24,465
⚡ Final Thoughts:
“Markets reward patience. Strong bases create stronger rallies.”
Bulls are back in control, but 24,745+ remains the true hurdle for sustained momentum.
✏️ Disclaimer
This is just my personal viewpoint. Always consult your financial advisor before taking any action.

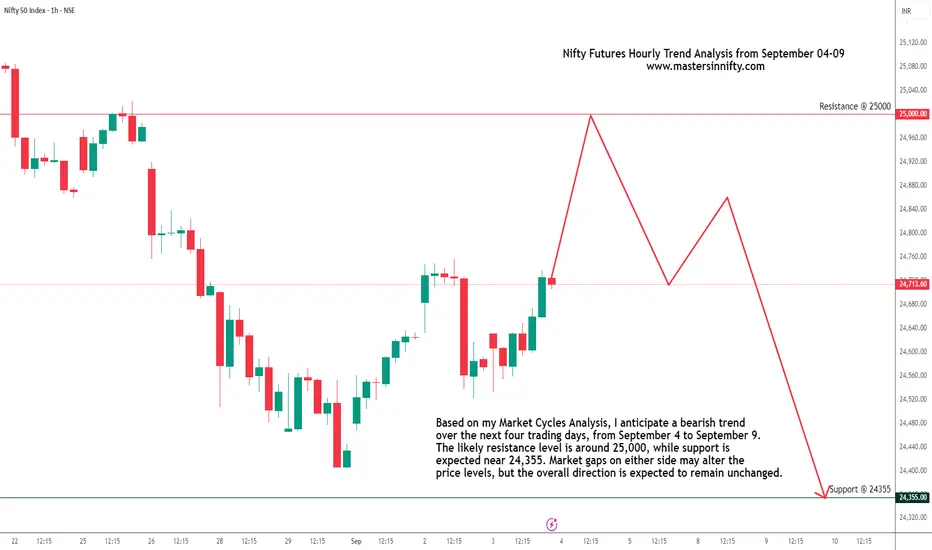
Nifty Futures Hourly Trend Analysis for the next 4 Trading DaysBased on my Market Cycles Analysis, I anticipate a bearish trend over the next four trading days, from September 4 to September 9. The likely resistance level is around 25,000, while support is expected near 24,355. Market gaps on either side may alter the price levels, but the overall direction is expected to remain unchanged.
This is just my personal view but not a recommendation to buy or sell. Use your own technical study for entries, exits and risk management.
Nifty levels - Sep 04, 2025Nifty support and resistance levels are valuable tools for making informed trading decisions, specifically when combined with the analysis of 5-minute timeframe candlesticks and VWAP. By closely monitoring these levels and observing the price movements within this timeframe, traders can enhance the accuracy of their entry and exit points. It is important to bear in mind that support and resistance levels are not fixed, and they can change over time as market conditions evolve.
The dashed lines on the chart indicate the reaction levels, serving as additional points of significance to consider. Furthermore, take note of the response at the levels of the High, Low, and Close values from the day prior.
We hope you find this information beneficial in your trading endeavors.
* If you found the idea appealing, kindly tap the Boost icon located below the chart. We encourage you to share your thoughts and comments regarding it.
Wishing you success in your trading activities!

Nifty unable to cross Important Resistances today. Nifty failed to capitalise a good start today and fell sharply from highs of the day to close in the negative. Nifty today made a high of 24756 but closed 177 points below this level at 24759. This was due to a Trend line resistance near the day's high. It is a complex chart giving mixed signals but for further growth of Nifty it has to close above 3 important resistances which are at 24682 Mother line resistance of hourly chart, 24756 trend line resistance and finally 24790 which is the father line of hourly chart. If we get a closing above 24790 we can see further resistance at 24927 before Nifty is able to touch 25K again. Support for Nifty currently are at 24522, 24410 and 24336. If the support at 24336 is broken we will see further down side in Nifty.
Disclaimer: The above information is provided for educational purpose, analysis and paper trading only. Please don't treat this as a buy or sell recommendation for the stock or index. The Techno-Funda analysis is based on data that is more than 3 months old. Supports and Resistances are determined by historic past peaks and Valley in the chart. Many other indicators and patterns like EMA, RSI, MACD, Volumes, Fibonacci, parallel channel etc. use historic data which is 3 months or older cyclical points. There is no guarantee they will work in future as markets are highly volatile and swings in prices are also due to macro and micro factors based on actions taken by the company as well as region and global events. Equity investment is subject to risks. I or my clients or family members might have positions in the stocks that we mention in our educational posts. We will not be responsible for any Profit or loss that may occur due to any financial decision taken based on any data provided in this message. Do consult your investment advisor before taking any financial decisions. Stop losses should be an important part of any investment in equity.
