NIFTY KEY LEVELS FOR 02.09.2025NIFTY KEY LEVELS FOR 02.09.2025
RTF: 3 Minutes
If the candle stays above the pivot point, it is considered a bullish bias; if it remains below, it indicates a bearish bias. Price may reverse near Resistance 1 or Support 1. If it moves further, the next potential reversal zone is near Resistance 2 or Support 2. If these levels are also broken, we can expect the trend.
If the range(R2-S2) is narrow, the market may become volatile or trend strongly. If the range is wide, the market is more likely to remain sideways
📢 Disclaimer
I am not a SEBI-registered financial adviser.
The information, views, and ideas shared here are purely for educational and informational purposes only. They are not intended as investment advice or a recommendation to buy, sell, or hold any financial instruments.
Please consult with your SEBI-registered financial advisor before making any trading or investment decisions.
Trading and investing in the stock market involves risk, and you should do your own research and analysis. You are solely responsible for any decisions made based on this research.
Niftylevels

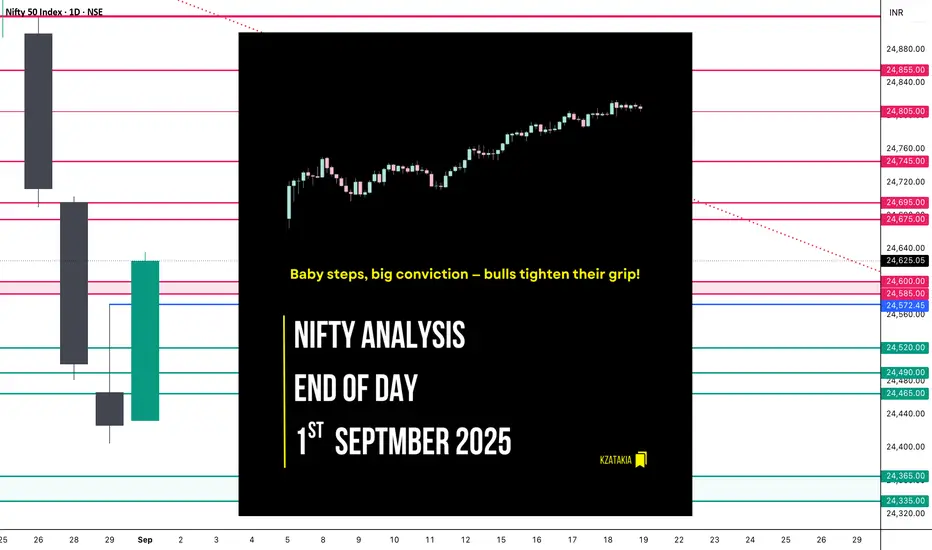
Nifty Analysis EOD - September 1, 2025 - Monday🟢 Nifty Analysis EOD - September 1, 2025 - Monday 🔴
Baby steps, big conviction — bulls tighten their grip!
🗞 Nifty Summary
Nifty opened with a 47-point gap-up, carrying a positive vibe. The index extended gains by nearly 80 points, marking a high of 24,560.85 before slipping back to 24,500. There it found strong support and gradually climbed to break IB High and later breach PDH.
Step by step, bulls showcased steady dominance, ultimately closing at 24,624.15, a solid 190-point gain. The daily timeframe formed a Bullish Marubozu candle, breaking out and closing above the Previous Day High — a decisive statement from buyers.
🛡 5 Min Intraday Chart with Levels
🚶 Intraday Walk
Opened gap-up +47 points.
Climbed ~80 points, touched 24,560.85.
Pulled back to 24,500, took support.
Gradually rose, broke IB High, then PDH.
Closed at 24,624.15, strong bullish grip intact.
📉 Daily Time Frame Chart with Intraday Levels
🕯️ Daily Candle Breakdown
Open: 24,432.70
High: 24,635.60
Low: 24,432.70
Close: 24,625.05
Change: +198.20 (+0.81%)
🏗️ Structure Breakdown
Green candle (Close > Open).
Body: 192.35 points → strong, dominant.
Upper wick: ~10.55 points (negligible).
Lower wick: 0 (open = low).
🕯Candle Type
Bullish Marubozu (near perfect).
📚 Interpretation
Market opened at low, never looked back.
Strong buying all day, closing at peak.
After 3 days of selling (23–25 Aug), this candle marks first solid bullish comeback.
Short-Term View
Support: 24,430 (today’s low & open).
Resistance: 24,635 (today’s high) → breakout may target ~24,800.
Trend Context: After a bearish continuation, today signals a bullish reversal. Needs follow-through buying in the next 1–2 sessions.
🛡 5 Min Intraday Chart
⚔️ Gladiator Strategy Update
ATR: 201.88
IB Range: 93.05 → Medium
Market Structure: Balanced
Trade Highlights
12:25 → Long trade triggered - Trailing SL hit ( R:R = 1 : 1.16 )
📌 Support & Resistance Levels
Resistance Zones
24,675 ~ 24,695
24,745
24,805
24,855
Support Zones
24,575
24,520
24,490 ~ 24,465
🔮 What’s Next? / Bias Direction
Momentum has shifted in favour of bulls, with today’s Marubozu breakout signalling strong conviction. As long as Nifty sustains above 24,500–24,520 zone, buyers remain in control. A clean break above 24,635 opens the gates for 24,800 and beyond.
💭 Final Thoughts
Today’s action reminded us: “Trends don’t announce themselves, they whisper first — and today’s candle was a loud hint.”
✏️ Disclaimer
This is just my personal viewpoint. Always consult your financial advisor before taking any action.
Nifty delicately placed near resistance zones. Today we have seen Good recovery by Nifty on the back of extraordinary GDP numbers of 7.8% in the last Quarter. Now Nifty is delicately placed with chances of V shaped recovery if it can surpass 4 major hurdles,
The resistances are at Mid RSI channel resistance near 24640, Mother line resistance at 24690 (hourly chart), Trend line resistance near 24766 and Father line resistance near 24800 (hourly chart). If we get a closing above 24800 then the doors for 24927, 25015 and 25160 will open. Supports for Nifty currently are at 24504 and 24399. We have a very interesting week ahead with possibility of lot of volatility.
Disclaimer: The above information is provided for educational purpose, analysis and paper trading only. Please don't treat this as a buy or sell recommendation for the stock or index. The Techno-Funda analysis is based on data that is more than 3 months old. Supports and Resistances are determined by historic past peaks and Valley in the chart. Many other indicators and patterns like EMA, RSI, MACD, Volumes, Fibonacci, parallel channel etc. use historic data which is 3 months or older cyclical points. There is no guarantee they will work in future as markets are highly volatile and swings in prices are also due to macro and micro factors based on actions taken by the company as well as region and global events. Equity investment is subject to risks. I or my clients or family members might have positions in the stocks that we mention in our educational posts. We will not be responsible for any Profit or loss that may occur due to any financial decision taken based on any data provided in this message. Do consult your investment advisor before taking any financial decisions. Stop losses should be an important part of any investment in equity.

Nifty levels - Sep 02, 2025Nifty support and resistance levels are valuable tools for making informed trading decisions, specifically when combined with the analysis of 5-minute timeframe candlesticks and VWAP. By closely monitoring these levels and observing the price movements within this timeframe, traders can enhance the accuracy of their entry and exit points. It is important to bear in mind that support and resistance levels are not fixed, and they can change over time as market conditions evolve.
The dashed lines on the chart indicate the reaction levels, serving as additional points of significance to consider. Furthermore, take note of the response at the levels of the High, Low, and Close values from the day prior.
We hope you find this information beneficial in your trading endeavors.
* If you found the idea appealing, kindly tap the Boost icon located below the chart. We encourage you to share your thoughts and comments regarding it.
Wishing you success in your trading activities!

NIFTY KEY LEVELS FOR 01.09.2025NIFTY KEY LEVELS FOR 01.09.2025
RTF: 3 Minutes
If the candle stays above the pivot point, it is considered a bullish bias; if it remains below, it indicates a bearish bias. Price may reverse near Resistance 1 or Support 1. If it moves further, the next potential reversal zone is near Resistance 2 or Support 2. If these levels are also broken, we can expect the trend.
If the range(R2-S2) is narrow, the market may become volatile or trend strongly. If the range is wide, the market is more likely to remain sideways
📢 Disclaimer
I am not a SEBI-registered financial adviser.
The information, views, and ideas shared here are purely for educational and informational purposes only. They are not intended as investment advice or a recommendation to buy, sell, or hold any financial instruments.
Please consult with your SEBI-registered financial advisor before making any trading or investment decisions.
Trading and investing in the stock market involves risk, and you should do your own research and analysis. You are solely responsible for any decisions made based on this research.

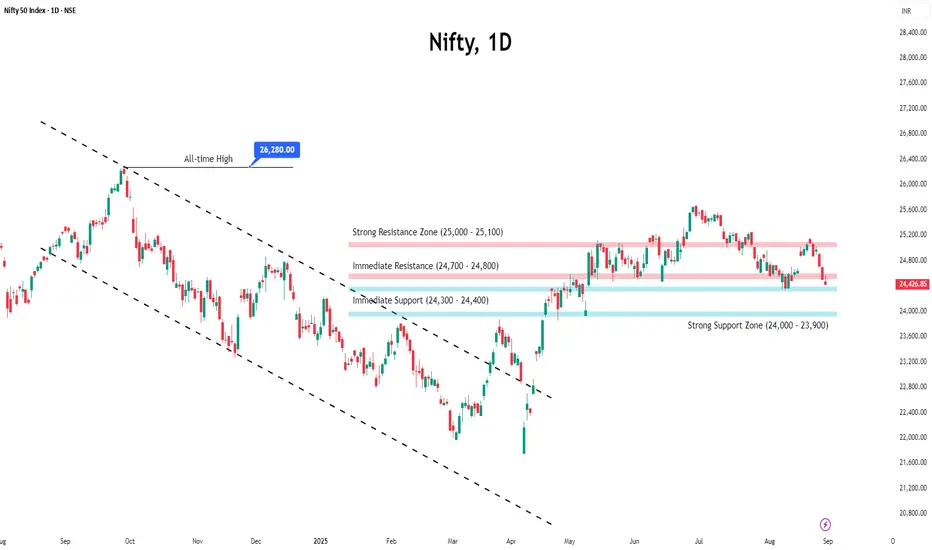
Nifty Ends August in Pain: Can September Spark a Turnaround?Nifty slipped nearly 1.8% in the last week of August as global headwinds and US-India tariff concerns weighed on sentiment.
Selling was broad-based, with Banking and Financials dragging the index down the most.
The index currently trades just above 24,400, a crucial support level. Open interest data indicates that the 24,400–24,300 zone may provide short-term support, while the 25,500–25,600 zone remains significant resistance due to heavy call writing. A decisive break below 24,300 could quickly push the index toward 24,000.
Amid the weakness, a silver lining emerges — India’s strong 7.8% GDP growth, the highest in five quarters and well above expectations, may help cushion further downside.
Looking ahead, Monday’s open will set the tone for September—a gap-up above 25,500 could spark a rebound, while staying below may keep Nifty under pressure.
Nifty Analysis EOD – August 29, 2025 – Friday🟢 Nifty Analysis EOD – August 29, 2025 – Friday 🔴
Failed bounce, sellers strike back at higher levels
🗞 Nifty Summary
Nifty opened with a GapDown of 66 points but immediately started moving up with an OL formation (Open = Low at 24,466.60) — a sign of bullish intent.
The first 5-min range of 98 points set the IB (Initial Balance), marking Day Low = Open and Day High = 24,564.35.
Throughout the session, the index attempted multiple IB breakouts but they all turned into false moves until 2:30 PM, when Nifty finally broke down IB Low and tested 24,400 zone before closing weak at 24,426.85 (−74.05 / −0.30%).
This structure suggests bears are still in control, though signs of base-building are emerging.
🛡 5 Min Intraday Chart with Levels
📝 Intraday Walk
GapDown start, but immediate OL formation = bullish sentiment
Quick gap-filling attempt, but resistance capped upside near 24,564
Multiple failed IB breakouts (both sides) = choppy action
Post 2:30 PM → decisive IB Low breakdown toward 24,400
Weak close at 24,426, below the midpoint of the day
📉 Daily Time Frame Chart with Intraday Levels
🕯 Daily Candle Breakdown
Open: 24,466.70
High: 24,572.45
Low: 24,404.70
Close: 24,426.85
Change: −74.05 (−0.30%)
🏗️ Structure Breakdown
Upper Wick (~105 pts): strong selling rejection at higher levels
Lower Wick (~22 pts): weak buyer defense near lows
Body (39.85 pts): indecisive but bearish bias
🕯Candle Type
Rejection-style red candle with small body and long upper wick.
📚 Interpretation
Early rebound attempt failed.
Close well below midpoint = sellers retain control.
Candle resembles a Shooting Star (bearish context) → signals supply pressure at higher levels.
🛡 5 Min Intraday Chart
⚔️ Gladiator Strategy Update
ATR: 201.12
IB Range: 97.75 → Medium
Market Structure: Balanced
Trade Highlights: No trade signal triggered
📌 Support & Resistance Levels
Resistance Zones:
24,585 ~ 24,600
24,675 ~ 24,695
24,745
Support Zones:
24,665 ~ 24,650
24,365 ~ 24,335
🔮 What’s Next? / Bias Direction
If 24,400 holds, short-term base formation could play out.
If 24,400 breaks, expect further downside toward 24,250.
Bias → Bearish continuation unless 24,600 is decisively reclaimed.
💭 Final Thoughts
“Markets don’t reverse in a single day – they build a base. Respect the levels, not the noise.”
✏️ Disclaimer
This is just my personal viewpoint. Always consult your financial advisor before taking any action.

Nifty sell till 23932, trend continueNifty sell till 23932, trend continue towards sell, as per my previous still nifty under selling pressure. for a new buy after reach that range we can consider or after trend change indication will decide. NOW its in Pure SELL

Nifty levels - Sep 01, 2025Nifty support and resistance levels are valuable tools for making informed trading decisions, specifically when combined with the analysis of 5-minute timeframe candlesticks and VWAP. By closely monitoring these levels and observing the price movements within this timeframe, traders can enhance the accuracy of their entry and exit points. It is important to bear in mind that support and resistance levels are not fixed, and they can change over time as market conditions evolve.
The dashed lines on the chart indicate the reaction levels, serving as additional points of significance to consider. Furthermore, take note of the response at the levels of the High, Low, and Close values from the day prior.
We hope you find this information beneficial in your trading endeavors.
* If you found the idea appealing, kindly tap the Boost icon located below the chart. We encourage you to share your thoughts and comments regarding it.
Wishing you success in your trading activities!

NIFTY KEY LEVELS FOR 29.08.2025NIFTY KEY LEVELS FOR 29.08.2025
RTF: 3 Minutes
If the candle stays above the pivot point, it is considered a bullish bias; if it remains below, it indicates a bearish bias. Price may reverse near Resistance 1 or Support 1. If it moves further, the next potential reversal zone is near Resistance 2 or Support 2. If these levels are also broken, we can expect the trend.
If the range(R2-S2) is narrow, the market may become volatile or trend strongly. If the range is wide, the market is more likely to remain sideways
📢 Disclaimer
I am not a SEBI-registered financial adviser.
The information, views, and ideas shared here are purely for educational and informational purposes only. They are not intended as investment advice or a recommendation to buy, sell, or hold any financial instruments.
Please consult with your SEBI-registered financial advisor before making any trading or investment decisions.
Trading and investing in the stock market involves risk, and you should do your own research and analysis. You are solely responsible for any decisions made based on this research.

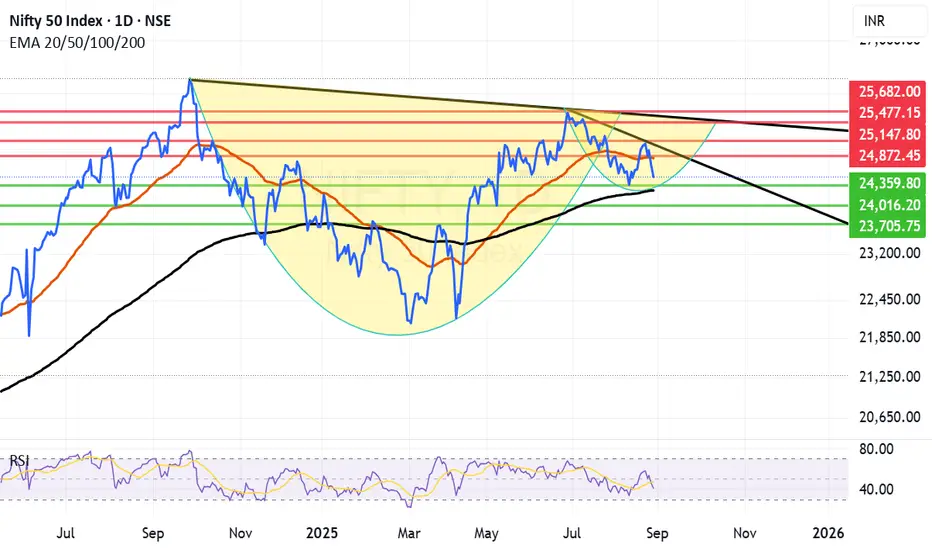
Nifty still in search of strong bottom. Nifty is still in search of a meaningful bottom to launch a fight back. Few support zones are arriving with monthly closing tomorrow Nifty was able to hold on to 24500 levels as it closed dot on that support. It is was a weak closing today indicating a firm bottom is not established yet. Thus further downside can not be ruled out.
The support zone for Nifty is between 24359 and 24266 as of now. 24266 is the Father line or 200 days EMA. If by chance we get a closing below 24359 the next support will be 24266. If 24266 is broken the next support for Nifty will be at 24016 or 23705.
The resistances for Nifty now remain at 24827 (Mother line resistance) and 24872 (Trend line resistance). Closing above 24872 will open the doors for 25147 and 25477. After closing above 25377 the major medium term resistance will be at 25682. Once we get there we will get a fair idea of levels ahead.
Long term chart of Nifty is still not that bad as it is indicating of a cup and handle breakout once we are able to close above 25682. Once we achieve that in next 1 or 2 quarters the doors for 26K and 27K will open. For that we need clarity on GST reduction proposal and Tariff related issue which is plaguing the markets. The Tariff jolt is massive but industry can overcome it in the long run by looking inwards on local consumption and exploring other overseas markets if US remains defiant in the long run.
As indicated by both US and Indian trade and commerce as well as foreign experts the issue will be eventually solved. Till then boost in local consumption / exploring other markets for India Inc. seems to be the only way out for Indian markets to recover. Long term investors should still look at investing holding on to their investments with a longer outlook. Even if there is a 0.5 or 1% reduction in GDP still India will continue to be a fastest growing market.
Years / Quarters and times like these test resolve of Investors but reward the patient handsomely. So patience is the key. Holding on and reshuffling the portfolio / Fresh investment during such phases always pays the mature investor. Always remember the Great man Warren Buffet's advice which goes like this, "Market is the device where money is transferred from the impatient to the patient."
Disclaimer: The above information is provided for educational purpose, analysis and paper trading only. Please don't treat this as a buy or sell recommendation for the stock or index. The Techno-Funda analysis is based on data that is more than 3 months old. Supports and Resistances are determined by historic past peaks and Valley in the chart. Many other indicators and patterns like EMA, RSI, MACD, Volumes, Fibonacci, parallel channel etc. use historic data which is 3 months or older cyclical points. There is no guarantee they will work in future as markets are highly volatile and swings in prices are also due to macro and micro factors based on actions taken by the company as well as region and global events. Equity investment is subject to risks. I or my clients or family members might have positions in the stocks that we mention in our educational posts. We will not be responsible for any Profit or loss that may occur due to any financial decision taken based on any data provided in this message. Do consult your investment advisor before taking any financial decisions. Stop losses should be an important part of any investment in equity.
Nifty levels - Aug 29, 2025Nifty support and resistance levels are valuable tools for making informed trading decisions, specifically when combined with the analysis of 5-minute timeframe candlesticks and VWAP. By closely monitoring these levels and observing the price movements within this timeframe, traders can enhance the accuracy of their entry and exit points. It is important to bear in mind that support and resistance levels are not fixed, and they can change over time as market conditions evolve.
The dashed lines on the chart indicate the reaction levels, serving as additional points of significance to consider. Furthermore, take note of the response at the levels of the High, Low, and Close values from the day prior.
We hope you find this information beneficial in your trading endeavors.
* If you found the idea appealing, kindly tap the Boost icon located below the chart. We encourage you to share your thoughts and comments regarding it.
Wishing you success in your trading activities!

NIFTY KEY LEVELS FOR 28.08.2025NIFTY KEY LEVELS FOR 28.08.2025
************************* Time frame 3 Minutes******************************
If the candle stays above the pivot point, it is considered a bullish bias; if it remains below, it indicates a bearish bias. Price may reverse near Resistance 1 or Support 1. If it moves further, the next potential reversal zone is near Resistance 2 or Support 2. If these levels are also broken, we can expect the trend.
If the range(R2-S2) is narrow, the market may become volatile or trend strongly. If the range is wide, the market is more likely to remain sideways
📢 Disclaimer
I am not a SEBI-registered financial adviser.
The information, views, and ideas shared here are purely for educational and informational purposes only. They are not intended as investment advice or a recommendation to buy, sell, or hold any financial instruments.
Please consult with your SEBI-registered financial advisor before making any trading or investment decisions.
Trading and investing in the stock market involves risk, and you should do your own research and analysis. You are solely responsible for any decisions made based on this research.

Nifty in search of a bottom before Trump Tariff Deadline. Nifty nose dived more than 1% today as the deadline for additional Tariff implementation has arrived. With a market holiday tomorrow investor shorted their positions. The supports for Nifty travelling in the hourly parallel channel which is shown in the chart seem to be at 24689 and 24573. If we get a closing below 24573 then Nifty can fall further to 24351 or below. We are in the zone from where historical RSI support as you can see in the chart. This makes it possible for Nifty to fight back on Thursday and Friday if things go well on Political front and there is no further bad news.
In the scenario of Nifty fighting back the resistance for Nifty seems to be at 24776. If we get a closing above 24776 then there is a triple strong resistance zone between 24850 and 24939. This zone consists of 4 strong resistances which are mid-channel resistance, Mother line of hourly chart, father line of hourly chart and finally trend line resistance. Once we get a closing above 24939 the future resistances will be at 25013, 25127 and finally 25253. Above 25253 closing Bulls will be back in business.
Disclaimer: The above information is provided for educational purpose, analysis and paper trading only. Please don't treat this as a buy or sell recommendation for the stock or index. The Techno-Funda analysis is based on data that is more than 3 months old. Supports and Resistances are determined by historic past peaks and Valley in the chart. Many other indicators and patterns like EMA, RSI, MACD, Volumes, Fibonacci, parallel channel etc. use historic data which is 3 months or older cyclical points. There is no guarantee they will work in future as markets are highly volatile and swings in prices are also due to macro and micro factors based on actions taken by the company as well as region and global events. Equity investment is subject to risks. I or my clients or family members might have positions in the stocks that we mention in our educational posts. We will not be responsible for any Profit or loss that may occur due to any financial decision taken based on any data provided in this message. Do consult your investment advisor before taking any financial decisions. Stop losses should be an important part of any investment in equity.

Nifty levels - Aug 28, 2025Nifty support and resistance levels are valuable tools for making informed trading decisions, specifically when combined with the analysis of 5-minute timeframe candlesticks and VWAP. By closely monitoring these levels and observing the price movements within this timeframe, traders can enhance the accuracy of their entry and exit points. It is important to bear in mind that support and resistance levels are not fixed, and they can change over time as market conditions evolve.
The dashed lines on the chart indicate the reaction levels, serving as additional points of significance to consider. Furthermore, take note of the response at the levels of the High, Low, and Close values from the day prior.
We hope you find this information beneficial in your trading endeavors.
* If you found the idea appealing, kindly tap the Boost icon located below the chart. We encourage you to share your thoughts and comments regarding it.
Wishing you success in your trading activities!

NIFTY KEY LEVELS FOR 26.08.2025NIFTY KEY LEVELS FOR 26.08.2025
************************* Time frame 3 Minutes******************************
If the candle stays above the pivot point, it is considered a bullish bias; if it remains below, it indicates a bearish bias. Price may reverse near Resistance 1 or Support 1. If it moves further, the next potential reversal zone is near Resistance 2 or Support 2. If these levels are also broken, we can expect the trend.
If the range(R2-S2) is narrow, the market may become volatile or trend strongly. If the range is wide, the market is more likely to remain sideways
📢 Disclaimer
I am not a SEBI-registered financial adviser.
The information, views, and ideas shared here are purely for educational and informational purposes only. They are not intended as investment advice or a recommendation to buy, sell, or hold any financial instruments.
Please consult with your SEBI-registered financial advisor before making any trading or investment decisions.
Trading and investing in the stock market involves risk, and you should do your own research and analysis. You are solely responsible for any decisions made based on this research.
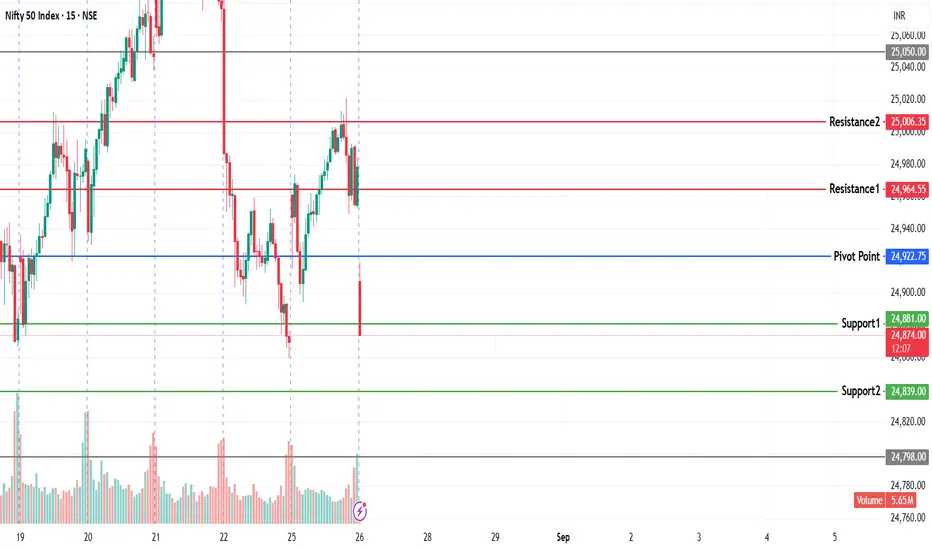
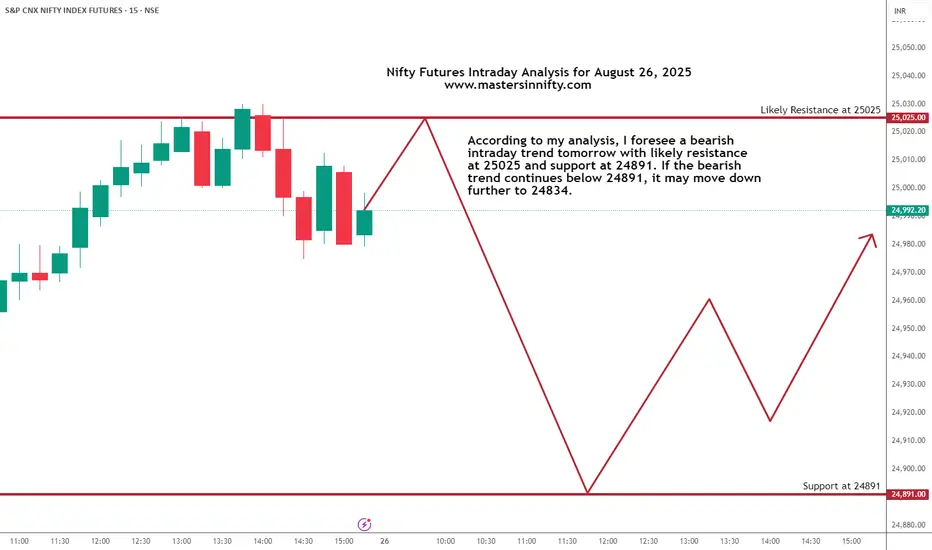
Nifty Futures Intraday Trend Analysis for August 26, 2025According to my analysis, I foresee a bearish intraday trend tomorrow with likely resistance
at 25025 and support at 24891. If the bearish trend continues below 24891, it may move down
further to 24834. Since I don't consider the gaps on the either side, my levels may not be in line with real-time market.
This is my personal view and traders are suggested to do their own technical study to trade in real-time market.
Nifty levels - Aug 26, 2025Nifty support and resistance levels are valuable tools for making informed trading decisions, specifically when combined with the analysis of 5-minute timeframe candlesticks and VWAP. By closely monitoring these levels and observing the price movements within this timeframe, traders can enhance the accuracy of their entry and exit points. It is important to bear in mind that support and resistance levels are not fixed, and they can change over time as market conditions evolve.
The dashed lines on the chart indicate the reaction levels, serving as additional points of significance to consider. Furthermore, take note of the response at the levels of the High, Low, and Close values from the day prior.
We hope you find this information beneficial in your trading endeavors.
* If you found the idea appealing, kindly tap the Boost icon located below the chart. We encourage you to share your thoughts and comments regarding it.
Wishing you success in your trading activities!

NIFTY KEY LEVELS FOR 25.08.2025NIFTY KEY LEVELS FOR 25.08.2025
If the candle stays above the pivot point, it is considered a bullish bias; if it remains below, it indicates a bearish bias. Price may reverse near Resistance 1 or Support 1. If it moves further, the next potential reversal zone is near Resistance 2 or Support 2. If these levels are also broken, we can expect the trend.
If the range(R2-S2) is narrow, the market may become volatile or trend strongly. If the range is wide, the market is more likely to remain sideways
📢 Disclaimer
I am not a SEBI-registered financial adviser.
The information, views, and ideas shared here are purely for educational and informational purposes only. They are not intended as investment advice or a recommendation to buy, sell, or hold any financial instruments.
Please consult with your SEBI-registered financial advisor before making any trading or investment decisions.
Trading and investing in the stock market involves risk, and you should do your own research and analysis. You are solely responsible for any decisions made based on this research.

Nifty Hits Resistance; Volatility Looms Ahead of Monthly ExpiryReason Behind the Fall
The Indian market snapped its six-session winning streak on Friday as investors turned cautious ahead of US Federal Reserve Chair Jerome Powell’s speech at the Jackson Hole symposium.
Concerns over the upcoming 25% US tariffs, set to take effect on August 27, further added to market volatility.
Importantly, Powell signalled in his remarks on Friday that the Federal Reserve is likely to cut interest rates in September.
Technical Setup
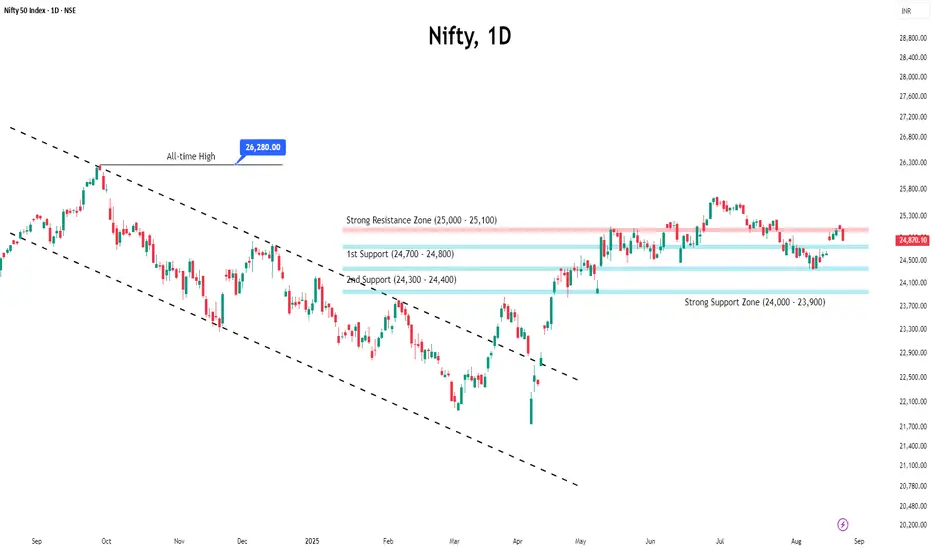
The Nifty faced rejection from the key resistance zone of 25,000–25,100, which may trigger further downside towards 24,500–24,400.
OI Data Analysis
Open interest data shows significant call writing at 25,000, reinforcing it as a strong resistance for the upcoming monthly expiry.
On the downside, 24,800 is emerging as immediate support with notable put writing. If this level fails to hold, the next support is likely near 24,500.
Suggested Strategy
With the additional tariff deadline approaching alongside monthly expiry, heightened volatility is expected.
Traders are advised to stay cautious and adopt a wait-and-watch approach until the index provides clear directional cues.
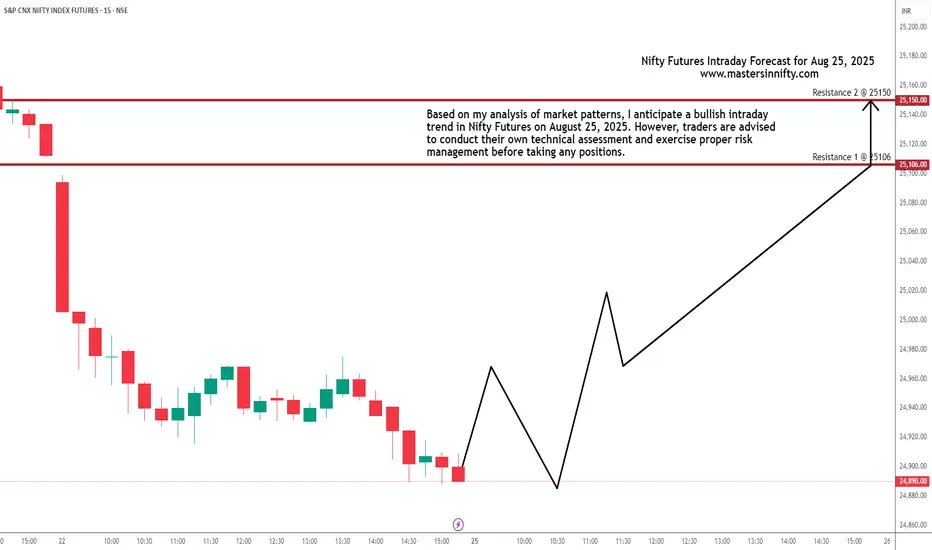
Nifty Futures Intraday Trend analysis on August 25, 2025Based on my analysis of market patterns, I anticipate a bullish intraday trend in Nifty Futures on August 25, 2025. However, traders are advised to conduct their own technical assessment and exercise proper risk management before taking any positions.
My view is not a recommendation to buy or sell but intended for educational purposes.
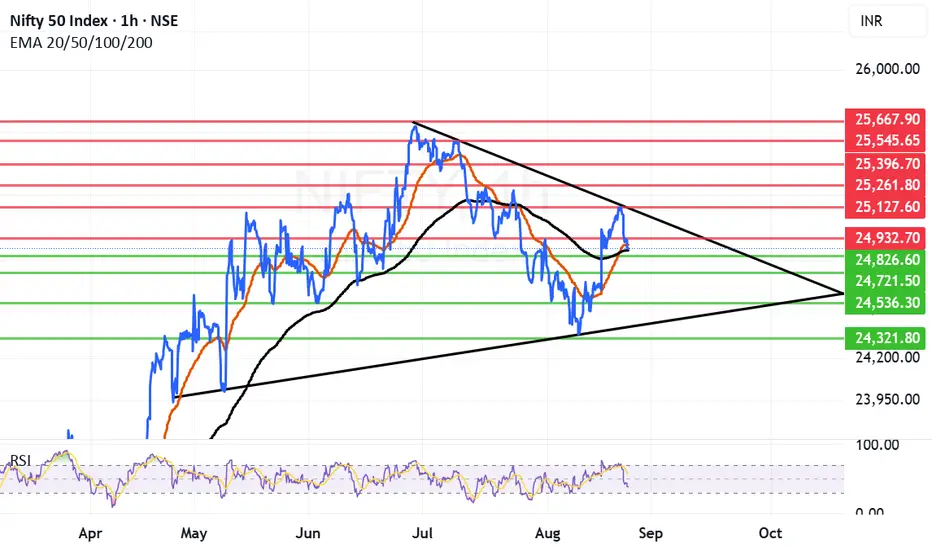
Trendline topples Nifty which is now searching for support now. Trendline resistance has toppled Nifty which is now searching for support from where it can launch a recovery. For a recovery Nifty has to find a firm support which can act as a launchpad again for next phase of move.
If the support is not found in the relevant support zone it can again fall in bear grip. The support zone nearby starts from 24857 (Father line) and a zone nearby which is at 24826. If we get a closing below 24826 then Nifty can fall towards 24721, 24536 or even 24321 levels. 24321 seems to be a strong trendline support.
If Nifty takes support near 24857 or 24826 then (Today's low was 24859) the Nifty can go upwards. In this scenario the resistances for Nifty will be at 24892 (Mother line Resistance), 24932, 25127 (trendline resistance), 25261, 25396, 25545 and finally 25667. After closing above 25261 the Bulls will be back in business.
Disclaimer: The above information is provided for educational purpose, analysis and paper trading only. Please don't treat this as a buy or sell recommendation for the stock or index. The Techno-Funda analysis is based on data that is more than 3 months old. Supports and Resistances are determined by historic past peaks and Valley in the chart. Many other indicators and patterns like EMA, RSI, MACD, Volumes, Fibonacci, parallel channel etc. use historic data which is 3 months or older cyclical points. There is no guarantee they will work in future as markets are highly volatile and swings in prices are also due to macro and micro factors based on actions taken by the company as well as region and global events. Equity investment is subject to risks. I or my clients or family members might have positions in the stocks that we mention in our educational posts. We will not be responsible for any Profit or loss that may occur due to any financial decision taken based on any data provided in this message. Do consult your investment advisor before taking any financial decisions. Stop losses should be an important part of any investment in equity.
Nifty levels - Aug 25, 2025Nifty support and resistance levels are valuable tools for making informed trading decisions, specifically when combined with the analysis of 5-minute timeframe candlesticks and VWAP. By closely monitoring these levels and observing the price movements within this timeframe, traders can enhance the accuracy of their entry and exit points. It is important to bear in mind that support and resistance levels are not fixed, and they can change over time as market conditions evolve.
The dashed lines on the chart indicate the reaction levels, serving as additional points of significance to consider. Furthermore, take note of the response at the levels of the High, Low, and Close values from the day prior.
We hope you find this information beneficial in your trading endeavors.
* If you found the idea appealing, kindly tap the Boost icon located below the chart. We encourage you to share your thoughts and comments regarding it.
Wishing you success in your trading activities!
