Nifty SpotA sharp downturn occurred on January 23, when the index dropped to approximately 25,048.65, reflecting intense selling and risk aversion. This was one of the more pronounced near-term drops within the ten-day window.
The recent weakness was influenced by:
Global trade concerns and geopolitical noise, which weighed on risk assets and dragged domestic benchmark performance.
Foreign portfolio investor outflows, particularly around mid-January, which compounded selling pressure.
Sector-specific weakness, notably in technology and mid/small-cap segments during the down phase.
Run up to Budget on FEB 1 ... volatility will increase
marked important price action levels marked...
Like and share
Niftyoptions

nifty 28.01.2026expiry day action shows bullish strength after range-bound movement. support placed at 25100- shorts only below this level. resistance at 25250 & 25350. fresh buying interest likely above 25250.

nifty for 23.01.2026today nifty stayed confused with buyers and sellers fighting for dominance. the session ended on a bullish note, but momentum still needs liquidity support. a gap down opening below 25150 may set up an interesting trading opportunity.

nifty for 19.02.2026nifty showed an attempt by buyers to take control in the last session, but the move failed and sellers turned active, though without strong momentum. with the budget and major company results expected this week, buyers may step in again. until then, the market is likely to remain range-bound between 25800 and 25600.
a gap up opening and break out above 25750 could trigger a bullish move, while a gradual breakdown below 25600 may lead to a bearish trend but overall, selling pressure still appears weak.

nifty 14.01.2026nifty price action is extremely volatile in this expiry week. ahead of tomorrows sensex expiry expiry, nifty has formed a wide 250-points range. upside resistance is placed around 25800-25830, while downside support lies near 25550-25580. a strong directional move is expected only after a clear breakout from this range.

nifty 13.01.2026nifty showed a strong uptrend today, but it appears to be a liquidity grab on the upside as geopolitical concerns still persist. additionally, post market close, inflation data came in higher than expected. considering these factors, I'm expecting a gap down opening tomorrow, with a possible continuation of the decline towards the 25350 level.

nifty outlook for 06.01.2026nifty currently showing bullish momentum, but the ongoing geopolitical uncertainty could trigger downside preassure. there is notable liquidity on the lowerside.
bearish scenario: if nifty open with bearish candle below 26200,a short move may develop towards 25900.
bulish scenario: if nifty opens flat and forms a bulish candle closing above 26300,an upside move towards 26470 is likely

ICICI PRU | Weekly Bullish Options Setup | 27 Jan ExpiryTrade Structure (Text Format)
• Sell 680 PE
• Buy 670 PE
• Defined-risk bull put spread
Why this setup works
NSE:ICICIPRULI ICICI Prudential is holding above key support near the 675–680 zone after a healthy pullback. Price is stabilising above the lower band, RSI is holding the mid-zone, and put-side open interest is building around 680, indicating strong downside support.
With time decay in our favour and no immediate breakdown signals, this structure benefits if the stock simply stays above support.
View
Moderately bullish — expecting ICICI PRU to hold above 680 and consolidate higher into expiry.
This post is for education only. It’s not financial advice or a recommendation to trade.
#WeeklyOptions #BullPutSpread #ICICIPRU #OptionsTradingIndia #NSEOptions #ThetaGang #HighProbabilityTrades #DefinedRisk

PREMIERENE | Weekly Bearish Options Setup | 27 Jan ExpiryTrade Structure (Text Format)
• Sell 850 CE
• Buy 870 CE
• Defined-risk Bear Call Spread
Why this setup works
NSE:PREMIERENE PREMIERENE is facing strong supply near the 850–860 zone, with price struggling to sustain above resistance. Momentum is weakening, RSI is rolling over from the mid-zone, and upside attempts are getting sold into.
Call OI is heavy near 850, indicating capped upside. With stable IV, call spreads offer efficient risk-defined positioning for a bearish view.
View
Moderately bearish — expecting the stock to stay below 850 and drift sideways to down.
This post is for education only. It’s not financial advice or a recommendation to trade.
#WeeklyOptions #BearishSetup #OptionsTradingIndia #BearCallSpread #NSEOptions #PremiumDecay #PriceActionTrading #StockMarketIndia #RMInvestech

COALINDIA | Weekly Bullish Options Setup | 27 Jan ExpiryTrade Idea -
• Sell 405 PE
• Buy 400 PE
• Defined-risk bull put spread
Why this setup works
Coal India NSE:COALINDIA has broken out of a consolidation range with strong price acceptance above the 390–395 support zone. The stock is holding above the mid-band, momentum is improving, and RSI is trending higher.
Put-side open interest is building below current price, indicating strong downside support. With stable IV, bull put spreads offer a favourable risk-defined way to express a bullish view.
View
Moderately bullish — expecting COALINDIA to stay above support and grind higher or remain range-bound on the upside.
This post is for education only. It’s not financial advice or a recommendation to trade.
#COALINDIA
#WeeklyOptions
#BullishSetup
#BullPutSpread
#OptionsTradingIndia
#NSEOptions
#StockMarketIndia
#IndianTraders
#OptionsStrategy

“Tomorrow, 03-12-2025 Nifty prediction. “Tomorrow, 03-12-2025 Nifty is likely to trade approximately 40 points in positive territory, indicating a mildly bullish sentiment in the early session.”
Explanation for Traders:
Market may show slight upward momentum
Buyers might attempt to take control early
A strong bullish move will need follow-through with volume
BANKNIFTY 500 down sentiment in the early session.”


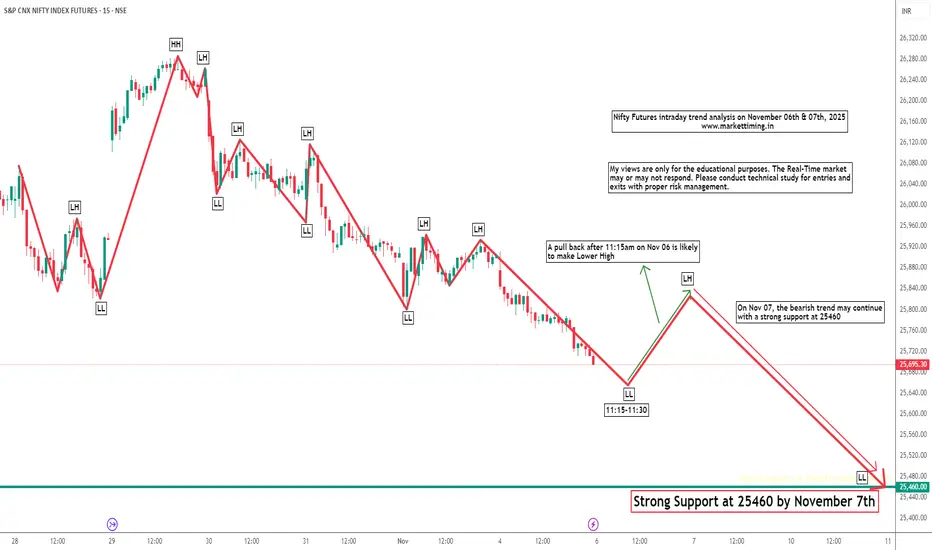
Nifty Futures Intraday Trend Analysis for November 6th and 7thBased on my pattern analysis, I anticipate the bearish momentum to persist until November 7th, potentially testing the support level around 25,460. However, on November 6th, a pullback after 11:15 AM is possible, which could result in a lower high formation.
Please note that this is my personal market outlook, and actual price action may vary due to potential gaps on either side. Traders are advised to perform their own technical analysis for entries and exits, while maintaining proper risk management practices.
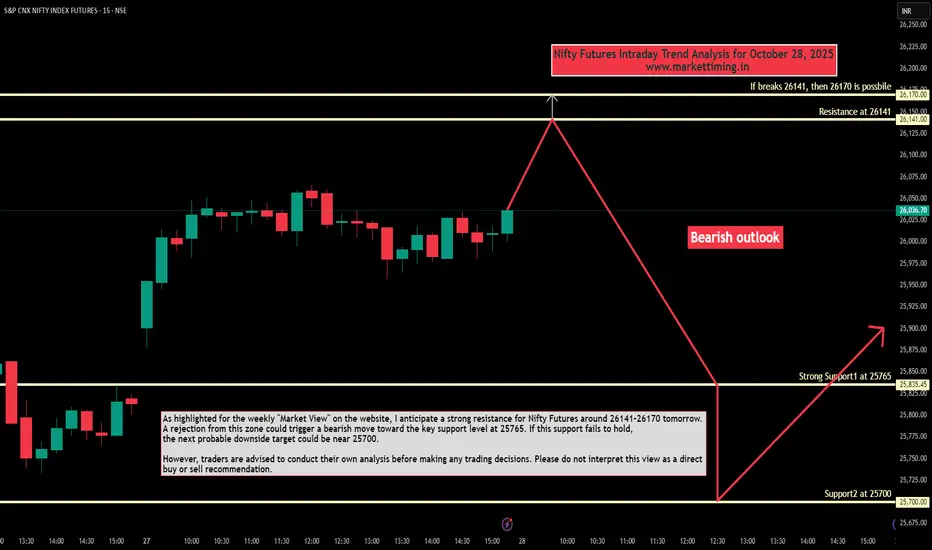
Nifty Futures Intraday Trend Analysis for October 28, 2025As highlighted for weekly "Market View" outlook on the website, I anticipate a strong resistance for Nifty Futures around 26141–26170 tomorrow. A rejection from this zone could trigger a bearish move toward the key support level at 25765. If this support fails to hold, the next probable downside target could be near 25700.
However, traders are advised to conduct their own analysis before making any trading decisions. Please do not interpret this view as a direct buy or sell recommendation.
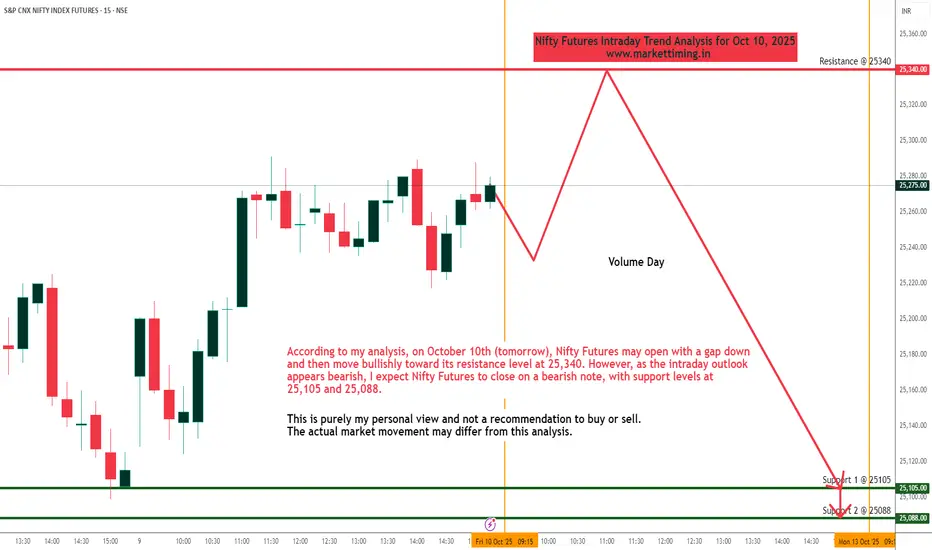
Nifty Futures Intraday Trend Analysis for October 10, 2025According to my analysis, on October 10th (tomorrow), Nifty Futures may open with a gap down and then move bullishly toward its resistance level at 25,340. However, as the intraday outlook appears bearish, I expect Nifty Futures to close on a bearish note, with support levels at 25,105 and 25,088.
This is purely my personal view and not a recommendation to buy or sell. The actual market movement may differ from this analysis.
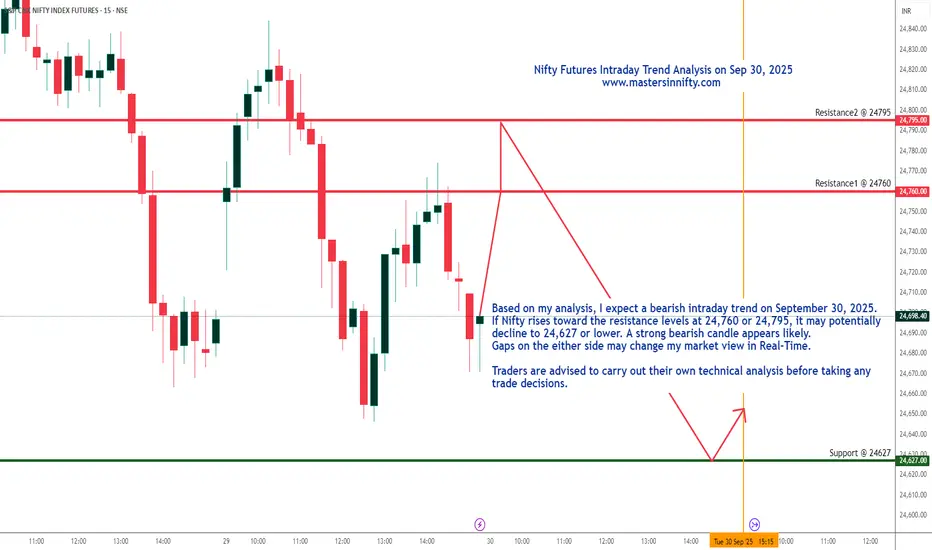
Nifty Futures Intraday Trend analysis on Sept 30, 2025Based on my analysis, I expect a bearish intraday trend on September 30, 2025. If Nifty rises toward the resistance levels at 24,760 or 24,795, it may potentially decline to 24,627 or lower. A strong bearish candle appears likely. Gaps on the either side may change my market view.
Traders are advised to carry out their own technical analysis before taking any trade decisions.
Nifty Spot Daily Trend Analysis from September 29Nifty spot may find support near 24,530 with a potential rebound toward 25,100, indicating the possibility of a Head and Shoulders formation in the coming sessions.
A gap-up opening on September 29, 2025 cannot be ruled out, which may influence these projected levels. Traders should rely on their own technical assessment before initiating positions.
Adherence to disciplined risk management is strongly recommended.

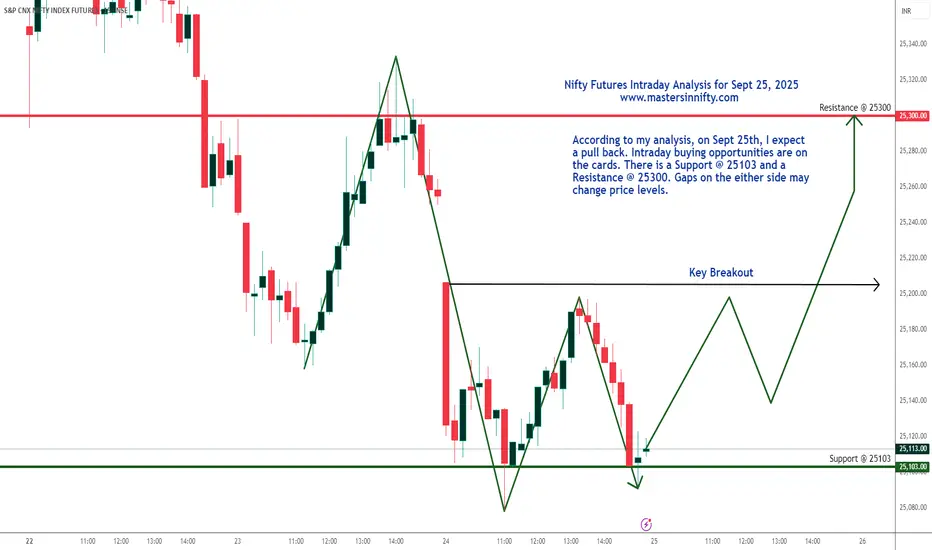
Nifty Intraday Trend Analysis for Sept 25, 2025According to my analysis, on Sept 25th, I expect a pull back. Intraday buying opportunities are on the cards. There is a Support @ 25103 and a Resistance @ 25300. Gaps on the either side may
change price levels.
It's my personal view. Real-Time market may not respond to my analysis due to other factors.
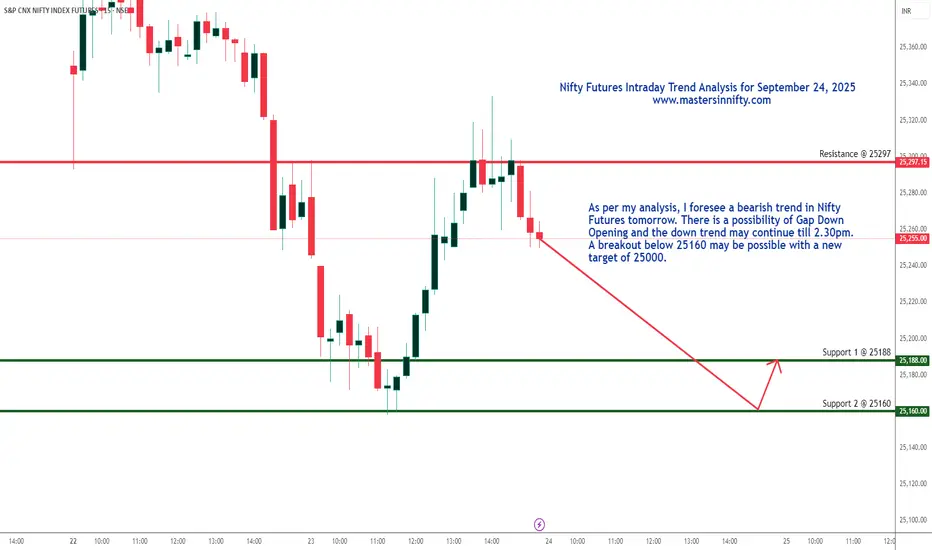
Nifty Futures Intraday Trend Analysis for September 24, 2025According to my analysis, a bearish trend is on the cards with Support levels at 25188 and 25160. Once it breaks 25160, there is a possibility of the next support levels at 25130 or 25000.
There is also a possibility of Gap Down opening tomorrow.
Since it's my personal perspective, traders are suggested to conduct own technical analysis before entering into trades. Trade with proper risk management.
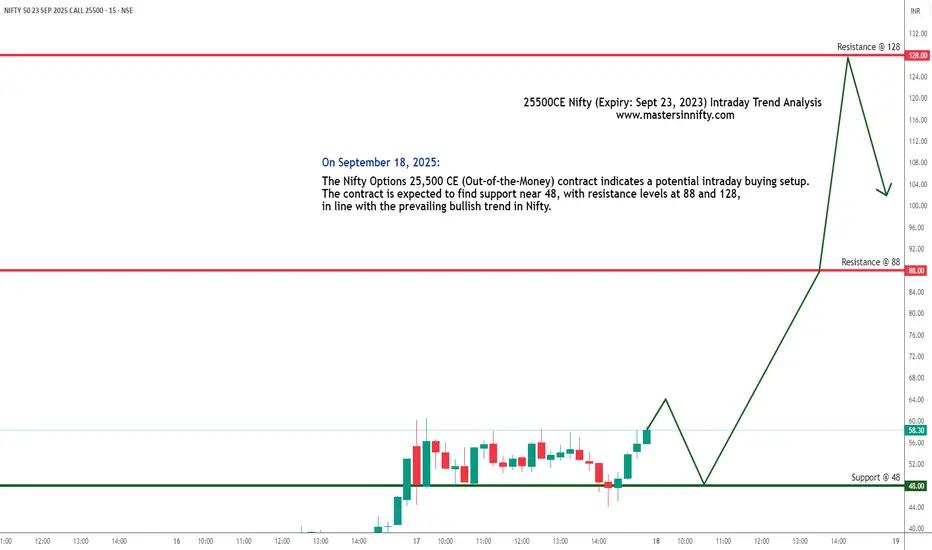
25500CE Nifty Options Intraday Trend Analysis on Sept 18, 2025The Nifty Options 25,500 CE (Out-of-the-Money) contract indicates a potential intraday buying setup. The contract is expected to find support near 48, with resistance levels at 88 and 128, in line with the prevailing bullish trend in Nifty.
This is my personal view. Please conduct your own technical analysis for entries and exit with proper risk management.
Derivative trading involves significant risk to capital and may not be suitable for all investors.
NLong
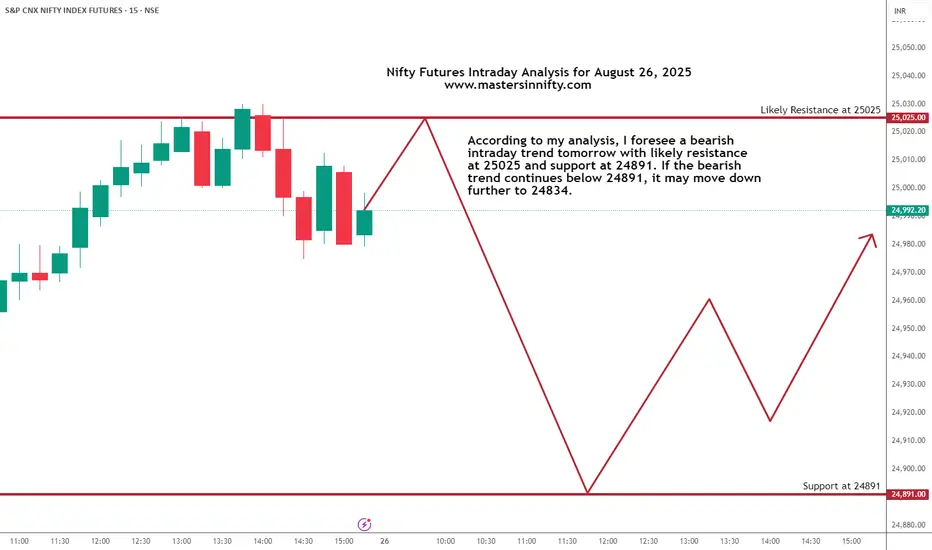
Nifty Futures Intraday Trend Analysis for August 26, 2025According to my analysis, I foresee a bearish intraday trend tomorrow with likely resistance
at 25025 and support at 24891. If the bearish trend continues below 24891, it may move down
further to 24834. Since I don't consider the gaps on the either side, my levels may not be in line with real-time market.
This is my personal view and traders are suggested to do their own technical study to trade in real-time market.
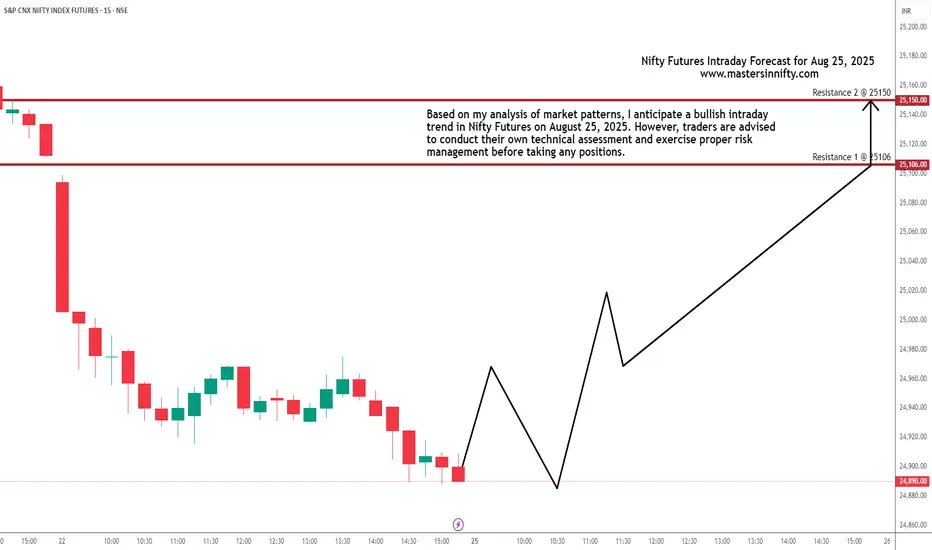
Nifty Futures Intraday Trend analysis on August 25, 2025Based on my analysis of market patterns, I anticipate a bullish intraday trend in Nifty Futures on August 25, 2025. However, traders are advised to conduct their own technical assessment and exercise proper risk management before taking any positions.
My view is not a recommendation to buy or sell but intended for educational purposes.
NIFTY KEY LEVELS FOR 12.08.2025NIFTY KEY LEVELS FOR 12.08.2025
If the candle stays above the pivot point, it is considered a bullish bias; if it remains below, it indicates a bearish bias. Price may reverse near Resistance 1 or Support 1. If it moves further, the next potential reversal zone is near Resistance 2 or Support 2. If these levels are also broken, we can expect the trend.
If the range(R2-S2) is narrow, the market may become volatile or trend strongly. If the range is wide, the market is more likely to remain sideways
📢 Disclaimer
I am not a SEBI-registered financial adviser.
The information, views, and ideas shared here are purely for educational and informational purposes only. They are not intended as investment advice or a recommendation to buy, sell, or hold any financial instruments.
Please consult with your SEBI-registered financial advisor before making any trading or investment decisions.
Trading and investing in the stock market involves risk, and you should do your own research and analysis. You are solely responsible for any decisions made based on this research.
