Fresh 500% Tariff threat and geo-political tensions grip Nifty. Fresh Trump Tariff threat has sent investors in a tizzy and craved path for Nifty fall that we saw today. But is there more pain in store? Nifty is currently near a support level of 25864. Which is just a little away from today's closing that whic was at 25876. If we get a closing below 25864 more pain might be instore and the next support levels will be at 25740, 25639, 25544 or even 25427 (which is a channel bottom support).
Resistances for Nifty on the upper side remain at 26033 (Father line) and 26103 (Mother line). If we get a closing above 26103 the next resistnace will be at 26188 and finally channel top of 26360. A proper rally can resume only when we get a closing above 26360.
RSI is indicating that the market is already nearing oversold zone as RSI currently is 21.76. Lot of speculation is going on related to tariffs and other geo-political tensions are gripping happening in South Asia (Iran, Afghanistan, Pakistan, India and Bangladesh). Lot of geo-political tensions are unravelling in EU (Russia, Ukraine, Greenland). Another bunch lot of geo-political tensions are brewing between UAE and KSA with regards to Yeman. We all know what happened in Venenzuela and the tensions are rife due to this between China, Russia and the USA. USA captured Ships with Russian flags on it yesterday and speculators / Bears take advantage of such situation to bring down markets specially the ones moving upwards. That is what happened to Nifty today. DII was still on the buying side.
Long term investors with a horizen of 12 to 24 months will take this oppertunity to add some more blue chips in their portfolio specially with quarterly result starting next week onwards. Keep stocks with good results and strong fundamentals in radar. Most of the dips are portfolio shuffling/new investment and compounding oppertunities for long term investors. This is not a market for Short term investment and making a quick buck through F&O. Only those with patience will survive the churning that is going on as consolidation phase goes on and on in the market. Patience of people with deep focus and egle eye will be rewarded as there is nothing wrong with India's growth story. Threat from valuation perspective and geo-political factors still remains the major concern as we move deeper into 2026. It is a geo-politically volatile time. Time is not conducive for those with shallow pockets and lack patience.
Disclaimer: The above information is provided for educational purpose, analysis and paper trading only. Please don't treat this as a buy or sell recommendation for the stock or index. The Techno-Funda analysis is based on data that is more than 3 months old. Supports and Resistances are determined by historic past peaks and Valley in the chart. Many other indicators and patterns like EMA, RSI, MACD, Volumes, Fibonacci, parallel channel etc. use historic data which is 3 months or older cyclical points. There is no guarantee they will work in future as markets are highly volatile and swings in prices are also due to macro and micro factors based on actions taken by the company as well as region and global events. Equity investment is subject to risks. I or my clients or family members might have positions in the stocks that we mention in our educational posts. We are not a SEBI registered Research analyst. We will not be responsible for any Profit or loss that may occur due to any financial decision taken based on any data provided in this message. Do consult your investment advisor before taking any financial decisions. Stop losses should be an important part of any investment in equity.
Niftyparallelchannel

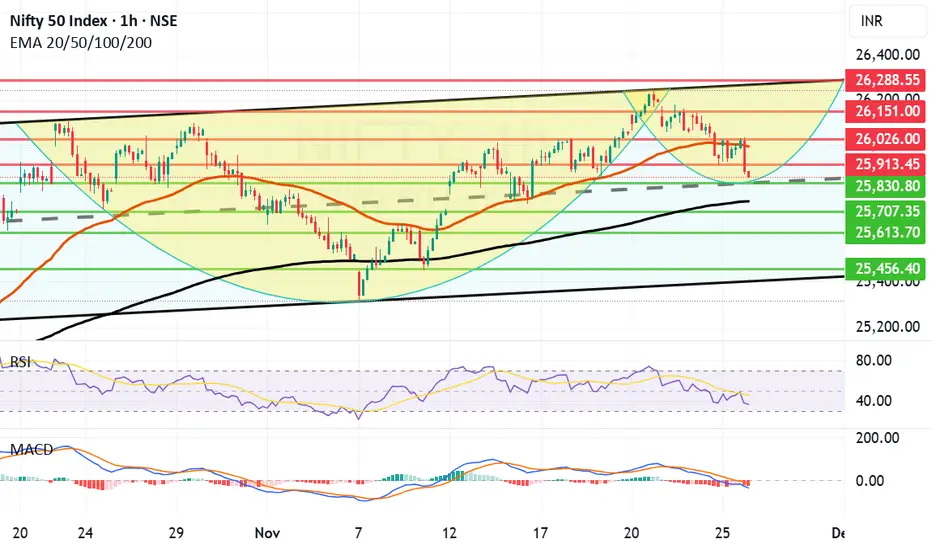
Nifty can sail further only if trend line resistance is broken. After a tipsy turvy week Nifty has again given a good closing above the mid channel resistance and is on the verge of a major trend line breakout. If we can get a closing next week above 26071 then the next resistances for Nifty will be at 26187 and 26333. Channel top for Nifty currently is at 26676. Supports for Nifty now remain at 25896 (Major Mid channel support), 25695 is the major trend line support. Channel bottom support for Nifty is at 25342.
RSI has turned bullish and is currently at 54.4 with median resistance at 55.49. If it is crossed we can see further upsurge towards 70 or 80. Shadow of the candle for next week is neutral due to the trend line resistance and RSI median. If and when they are crossed the shadow will turn positive.
Disclaimer: The above information is provided for educational purpose, analysis and paper trading only. Please don't treat this as a buy or sell recommendation for the stock or index. The Techno-Funda analysis is based on data that is more than 3 months old. Supports and Resistances are determined by historic past peaks and Valley in the chart. Many other indicators and patterns like EMA, RSI, MACD, Volumes, Fibonacci, parallel channel etc. use historic data which is 3 months or older cyclical points. There is no guarantee they will work in future as markets are highly volatile and swings in prices are also due to macro and micro factors based on actions taken by the company as well as region and global events. Equity investment is subject to risks. I or my clients or family members might have positions in the stocks that we mention in our educational posts. We will not be responsible for any Profit or loss that may occur due to any financial decision taken based on any data provided in this message. Do consult your investment advisor before taking any financial decisions. Stop losses should be an important part of any investment in equity.

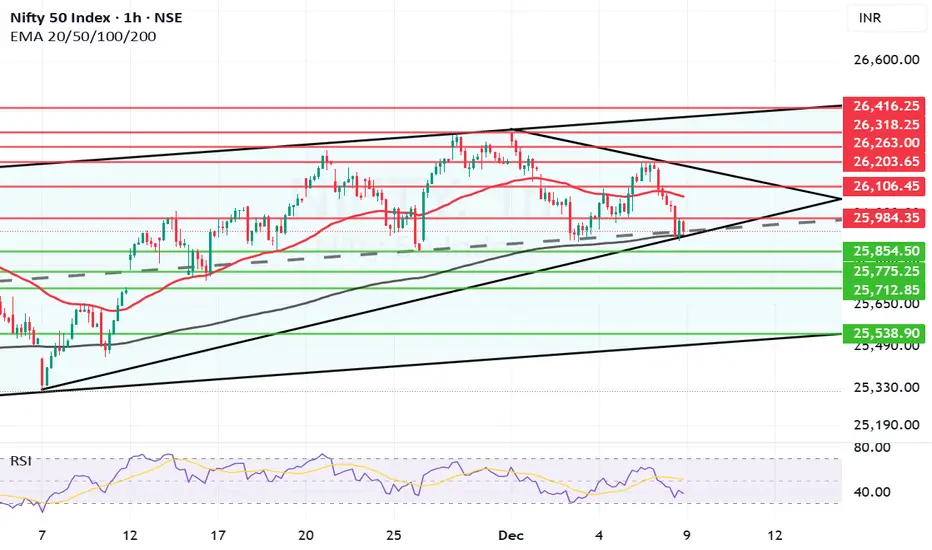
Nifty near father line support on hourly chart.After the drubbing today at browsers where Nifty ended 225.9 points below previous close has closed at 25960. Below the comfort level of 26K. The sell of was global today due to US FED meet later tonight.
Supports for Nifty are at 25915 (Major Father line support). If this support is broken Nifty will become weak and can further plummet towards 25854, 25775 or even 25712. The channel bottom support for Nifty will be near 25538.
Resistances for Nifty are at 25984, 26066 (Mother line resistance), 26203, 26263, 26318 and finally channel top resistance is near 26416.
Shadow of the candle is looking neutral despite the fall today. If the father line support at 25915 is not broken we can see a swift recovery in Nifty.
Disclaimer: The above information is provided for educational purpose, analysis and paper trading only. Please don't treat this as a buy or sell recommendation for the stock or index. The Techno-Funda analysis is based on data that is more than 3 months old. Supports and Resistances are determined by historic past peaks and Valley in the chart. Many other indicators and patterns like EMA, RSI, MACD, Volumes, Fibonacci, parallel channel etc. use historic data which is 3 months or older cyclical points. There is no guarantee they will work in future as markets are highly volatile and swings in prices are also due to macro and micro factors based on actions taken by the company as well as region and global events. Equity investment is subject to risks. I or my clients or family members might have positions in the stocks that we mention in our educational posts. We will not be responsible for any Profit or loss that may occur due to any financial decision taken based on any data provided in this message. Do consult your investment advisor before taking any financial decisions. Stop losses should be an important part of any investment in equity.
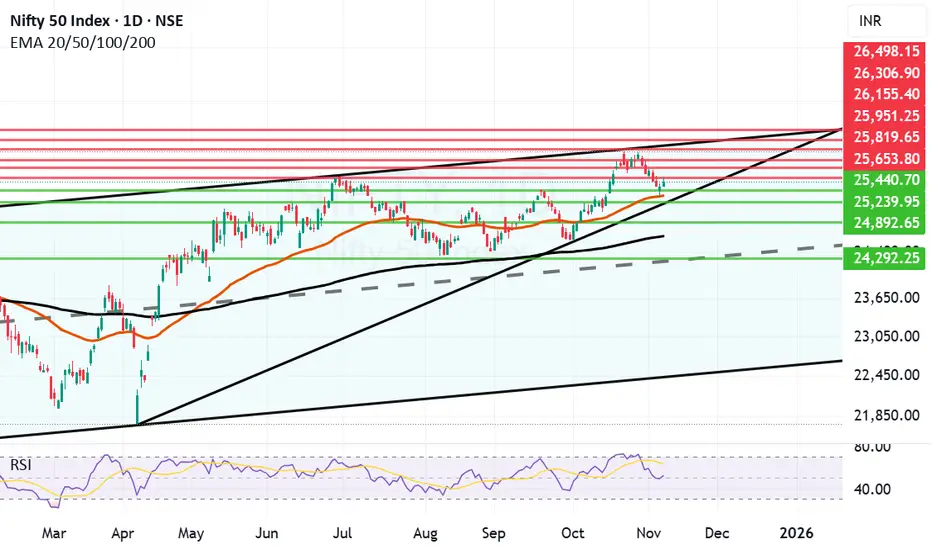
Nifty makes ATH, Profit Booking strikes thereafter. What next?Nifty made a new ATH today exactly after 14 Months although it is a point to rejoice. On the hindsight there is no growth for last 14 months. Such phases do come even in a Bull market but a closing above Today's ATH that is 26310 will be the real turnaround. Sometimes the indices will not reward you for months years and on some other occasions they will cover it up in few weeks or month. Afterall it is law of averages that catches up.
Nifty has been growing from last 20 years approximately around 15% per year. Last 14 months have been lackluster so if things go well Bulls can have a field day or weeks or months in the coming times. What we need is a weekly or monthly closing above 26310. As you can see in the chart the next resistance after 26310 will be around 26433. Major major Breakout above this zone.
Supports for Nifty are near 26141, 26015, 25834 and finally Mother line support is near 25608 on the daily chart.
Disclaimer: The above information is provided for educational purpose, analysis and paper trading only. Please don't treat this as a buy or sell recommendation for the stock or index. The Techno-Funda analysis is based on data that is more than 3 months old. Supports and Resistances are determined by historic past peaks and Valley in the chart. Many other indicators and patterns like EMA, RSI, MACD, Volumes, Fibonacci, parallel channel etc. use historic data which is 3 months or older cyclical points. There is no guarantee they will work in future as markets are highly volatile and swings in prices are also due to macro and micro factors based on actions taken by the company as well as region and global events. Equity investment is subject to risks. I or my clients or family members might have positions in the stocks that we mention in our educational posts. We will not be responsible for any Profit or loss that may occur due to any financial decision taken based on any data provided in this message. Do consult your investment advisor before taking any financial decisions. Stop losses should be an important part of any investment in equity.

Relentless Profit Booking brings Nifty Further down. What next?The fall in Nifty continued today as again there was again profit booking. However the candles formed in hourly chart indicate that may be a temporary bottom is nearby. The supports nearby are at 25830, 25751 (Father line support, Major Support), 25707, 25613 and finally 25456. The resistance on the upper side for Nifty are at 25913, 25026, 25151 and finally 25288 which can be a new ATH and channel top resistance. (This will be tough to cross.)
The candle still is little bit negative to neutral and MACD is also yet to take a proper turn towards Bullish reversal so little bit of pain still might be there but you never know today's low of 25857 might also work as reversal point.
Disclaimer: The above information is provided for educational purpose, analysis and paper trading only. Please don't treat this as a buy or sell recommendation for the stock or index. The Techno-Funda analysis is based on data that is more than 3 months old. Supports and Resistances are determined by historic past peaks and Valley in the chart. Many other indicators and patterns like EMA, RSI, MACD, Volumes, Fibonacci, parallel channel etc. use historic data which is 3 months or older cyclical points. There is no guarantee they will work in future as markets are highly volatile and swings in prices are also due to macro and micro factors based on actions taken by the company as well as region and global events. Equity investment is subject to risks. I or my clients or family members might have positions in the stocks that we mention in our educational posts. We will not be responsible for any Profit or loss that may occur due to any financial decision taken based on any data provided in this message. Do consult your investment advisor before taking any financial decisions. Stop losses should be an important part of any investment in equity.
Volatile day where Nifty Bulls beat the Bears. Today we saw a volatile session in Nifty where Nifty initially collapsed to 25449 but then again rose to regain level above 25650 closing at 25694. The candle we saw today confirms a bullish trend.
Exit Poll indicative of the Government that Market likes will retain Bihar. Trump is signalling reduction of Tariff. So overall it can trigger a further up trend but you never say never in the market. Market can always surprise you but Shadow of the candles currently is positive.
The resistances for Nifty now remain at 25708, 25819, 26004, 26115, 26277, 26306 and finally the channel top remains at 26498. Supports for Nifty now remain at 25440, 25352, 25239, 24892, 24670 and 24292.
Disclaimer: The above information is provided for educational purpose, analysis and paper trading only. Please don't treat this as a buy or sell recommendation for the stock or index. The Techno-Funda analysis is based on data that is more than 3 months old. Supports and Resistances are determined by historic past peaks and Valley in the chart. Many other indicators and patterns like EMA, RSI, MACD, Volumes, Fibonacci, parallel channel etc. use historic data which is 3 months or older cyclical points. There is no guarantee they will work in future as markets are highly volatile and swings in prices are also due to macro and micro factors based on actions taken by the company as well as region and global events. Equity investment is subject to risks. I or my clients or family members might have positions in the stocks that we mention in our educational posts. We will not be responsible for any Profit or loss that may occur due to any financial decision taken based on any data provided in this message. Do consult your investment advisor before taking any financial decisions. Stop losses should be an important part of any investment in equity.

Good follow up candle but Nifty. Nifty today gave a good follow-up candle after Friday's green candle where it confirmed Mother line support. Nifty today closed at 25574. Nifty made a high of 25653 but could not hold 25650 level which was very important for further progress. Once Nifty gives a closing above 25653 now we can see further positivity in the market. The resistances for Nifty remain at 25653, 25819, 25951 and 26155. The channel top for Nifty is in the zone of 26306 to 26498 if we and when we get a closing above previous all time high of 26277. Supports for Nifty now remain at 25440, 25338 (Mother line support) and 25239. A closing below 25239 can bring further weakness which can drag Nifty towards 24892, Father line support of 24660 or even 24292 which is currently the mid channel support. As of now shadow of the candle looks positive and RSI is also turning bullish.
Disclaimer: The above information is provided for educational purpose, analysis and paper trading only. Please don't treat this as a buy or sell recommendation for the stock or index. The Techno-Funda analysis is based on data that is more than 3 months old. Supports and Resistances are determined by historic past peaks and Valley in the chart. Many other indicators and patterns like EMA, RSI, MACD, Volumes, Fibonacci, parallel channel etc. use historic data which is 3 months or older cyclical points. There is no guarantee they will work in future as markets are highly volatile and swings in prices are also due to macro and micro factors based on actions taken by the company as well as region and global events. Equity investment is subject to risks. I or my clients or family members might have positions in the stocks that we mention in our educational posts. We will not be responsible for any Profit or loss that may occur due to any financial decision taken based on any data provided in this message. Do consult your investment advisor before taking any financial decisions. Stop losses should be an important part of any investment in equity.
Nifty delicately taken the Mother line support what next?Nifty took Mother line support on Friday closed in the negative 17 points at 25492. However it closed 174 above day's low that was 25318. This means 25318 become a major support now going forward. Mother line currently is at 25328. So this 10 point zone is a banger support for Nifty. If we get a closing below 25318 there will be further weakness which can take Nifty towards 24892, Father line 24651 another major support or even mid channel support near 24318. In case 25328 is held the resistances for Nifty going upwards will be high of Friday that is 25551, 25693, 25949, 26155 and finally channel top near 26494. If we reach the channel top it will be a new All Time high.
To know how a Parallel Channel or Mother Father lines and my Mother, Father small Child theory functions or how Fundamental analysis works and how to draw charts or use Techno-Funda analysis do read my book the Happy Candles Way To Wealth Creation rated 4.8/5 on Amazon.
Disclaimer: The above information is provided for educational purpose, analysis and paper trading only. Please don't treat this as a buy or sell recommendation for the stock or index. The Techno-Funda analysis is based on data that is more than 3 months old. Supports and Resistances are determined by historic past peaks and Valley in the chart. Many other indicators and patterns like EMA, RSI, MACD, Volumes, Fibonacci, parallel channel etc. use historic data which is 3 months or older cyclical points. There is no guarantee they will work in future as markets are highly volatile and swings in prices are also due to macro and micro factors based on actions taken by the company as well as region and global events. Equity investment is subject to risks. I or my clients or family members might have positions in the stocks that we mention in our educational posts. We will not be responsible for any Profit or loss that may occur due to any financial decision taken based on any data provided in this message. Do consult your investment advisor before taking any financial decisions. Stop losses should be an important part of any investment in equity.

Momentum building but 2 tough resistances ahead before new ATH. Momentum is building in Nifty towards making a new All time high but there are 2 very important resistances to cross before Nifty can scale a new high.
One critical resistance will be 26104 which is the 1 year high. Today again Nifty came close to this level but receded thereafter after making a day high of 26097. If we are able to cross this level the previous ATH of 26277 will act as a ferocious resistance which will not be easy to cross on closing basis. If this will be crossed channel top seems to be near 26424. Trend top for medium term seems to be 26913.
Supports for Nifty at this juncture will be at 25984, 25845 (Mother line support of Hourly EMA), Mid-channel support seems to be near 25694. Father line strong support of hourly EMA seems to be near 25396 and channel bottom seems to be near 25232.
shadow of the candles is neutral but if we get a closing above 26104 it can become very positive.
As a Fresh rally dawns upon us it is mandatory to study and understand investing before you put your hard earned money on equity. I would recommend my book THE HAPPY CANDLES WAY TO WEALTH CREATION at this juncture so that you are able to make a conscious and strong financial decisions while investing in equity.
Disclaimer: The above information is provided for educational purpose, analysis and paper trading only. Please don't treat this as a buy or sell recommendation for the stock or index. The Techno-Funda analysis is based on data that is more than 3 months old. Supports and Resistances are determined by historic past peaks and Valley in the chart. Many other indicators and patterns like EMA, RSI, MACD, Volumes, Fibonacci, parallel channel etc. use historic data which is 3 months or older cyclical points. There is no guarantee they will work in future as markets are highly volatile and swings in prices are also due to macro and micro factors based on actions taken by the company as well as region and global events. Equity investment is subject to risks. I or my clients or family members might have positions in the stocks that we mention in our educational posts. We will not be responsible for any Profit or loss that may occur due to any financial decision taken based on any data provided in this message. Do consult your investment advisor before taking any financial decisions. Stop losses should be an important part of any investment in equity.

Strong Breakout for Nifty as it becomes a runaway train.After crossing the mid-channel resistance. Nifty has become a runaway train which has entered and overbought zone on hourly chart as it closed at 25585 with few critical resistances coming to fore. Channel top seems to be just near 26K at 25956. Other critical resistances are at 25586, 25698 and 25786 before it reaches 25956 or 26K. Support for Nifty at this juncture are at 25442, 25323, 25252 (Mother line support and the mid-channel support). Father line support is at 25064. Much required closing above 25500 has lifted the spirits of investors. With key resistances ahead and Nifty being overbought little correction or consolidation would be ideal before it can scale further heights.
Disclaimer: The above information is provided for educational purpose, analysis and paper trading only. Please don't treat this as a buy or sell recommendation for the stock or index. The Techno-Funda analysis is based on data that is more than 3 months old. Supports and Resistances are determined by historic past peaks and Valley in the chart. Many other indicators and patterns like EMA, RSI, MACD, Volumes, Fibonacci, parallel channel etc. use historic data which is 3 months or older cyclical points. There is no guarantee they will work in future as markets are highly volatile and swings in prices are also due to macro and micro factors based on actions taken by the company as well as region and global events. Equity investment is subject to risks. I or my clients or family members might have positions in the stocks that we mention in our educational posts. We will not be responsible for any Profit or loss that may occur due to any financial decision taken based on any data provided in this message. Do consult your investment advisor before taking any financial decisions. Stop losses should be an important part of any investment in equity.

Uncertainty can prevail with latest Trump Tariff Tantrum.The chart indicates a Trend line resistance near 25323 which Nifty was set to overhaul but latest Trump Tariff Tantrum has potential to derail the progress again. This time the announcement is 100% tariff on China. Global markets, Crypto and Gift Nifty is showing weakness due to the announcement which will be effective from 1st November.
Resistance for Nifty are at 25323 (Trend line resistance), 25438, 25565 and finally channel top at 25702. Supports for Nifty are at 25215, 25087 (Mother line support), 24987 (Father line support), 24922 and 24750 is the channel bottom support. Shadow of the candle was positive to neutral but this tariff announcement has turned it negative as of now. Let us see how the cookie crumbles next week.
To know mover about Mother line, Father line, Mid channel support / resistance, Chanel top resistnace and channle bottom support, trend line support and resistance (To understand the role of Mother line and Father line) or to be able to draw resistances and supports based on historic peaks and valleys you can read my book THE HAPPY CANDLES WAY TO WEALTH CREATION. The book is available in Amazon in paperback or Kindle version and is rated 4.8/5. This book teaches you Techno-Funda investing. (Techno Funda investing means Knowing which are Fundamentally strong companies and investing / booking profits / staying invested in them based on Technical analysis). The book has some more unique features like rating a stock with the help of Happy Candles Number wherein you can give a stock marks out of 100 based on Techincal and Fundamental analysis you have learned by reading it. Thus you can know if the stock is currently investible or not based on the marks it scores out of 100. The book also covers various aspect of behavioural finance. Lot of people who have read the book consider it as a hand book to equity investing. Buy the book you will not be dissapointed as the book is reasonably priced. Search by the key words The Happy Candles Way to wealth creation and you will get it.
Disclaimer: The above information is provided for educational purpose, analysis and paper trading only. Please don't treat this as a buy or sell recommendation for the stock or index. The Techno-Funda analysis is based on data that is more than 3 months old. Supports and Resistances are determined by historic past peaks and Valley in the chart. Many other indicators and patterns like EMA, RSI, MACD, Volumes, Fibonacci, parallel channel etc. use historic data which is 3 months or older cyclical points. There is no guarantee they will work in future as markets are highly volatile and swings in prices are also due to macro and micro factors based on actions taken by the company as well as region and global events. Equity investment is subject to risks. I or my clients or family members might have positions in the stocks that we mention in our educational posts. We will not be responsible for any Profit or loss that may occur due to any financial decision taken based on any data provided in this message. Do consult your investment advisor before taking any financial decisions. Stop losses should be an important part of any investment in equity.

Nifty on the verge of a Trendline breakout. Nifty did a great job today by closing above a very important resistance of 25128. Now the major hurdle seems to be near the trendline which is near 25228. Once this range is crossed the next hurdles will be at 25306, 25431 and channel top near 25579. The supports for Nifty are at 25128. Mother line support near 25021 which is also a mid channel support. (Making this area a very strong support). Followed by 24965 (Father line support). If by chance father line support is broken we can see Nifty falling towards 24806 or even 24601 which is the channel bottom support. As of now the shadow of the candle seems to be positive (Green).
To know mover about Mother line, Father line, Mid channel support / resistance, Chanel top resistnace and channle bottom support, trend line support and resistance (To understand the role of Mother line and Father line) or to be able to draw resistances and supports based on historic peaks and valleys you can read my book THE HAPPY CANDLES WAY TO WEALTH CREATION. The book is available in Amazon in paperback or Kindle version and is rated 4.8/5. This book teaches you Techno-Funda investing. (Techno Funda investing means Knowing which are Fundamentally strong companies and investing / booking profits / staying invested in them based on Technical analysis). The book has some more unique features like rating a stock with the help of Happy Candles Number wherein you can give a stock marks out of 100 based on Techincal and Fundamental analysis you have learned by reading it. Thus you can know if the stock is currently investible or not based on the marks it scores out of 100. The book also covers various aspect of behavioural finance. Lot of people who have read the book consider it as a hand book to equity investing. Buy the book you will not be dissapointed as the book is reasonably priced. Search by the key words The Happy Candles Way to wealth creation and you will get it.
Disclaimer: The above information is provided for educational purpose, analysis and paper trading only. Please don't treat this as a buy or sell recommendation for the stock or index. The Techno-Funda analysis is based on data that is more than 3 months old. Supports and Resistances are determined by historic past peaks and Valley in the chart. Many other indicators and patterns like EMA, RSI, MACD, Volumes, Fibonacci, parallel channel etc. use historic data which is 3 months or older cyclical points. There is no guarantee they will work in future as markets are highly volatile and swings in prices are also due to macro and micro factors based on actions taken by the company as well as region and global events. Equity investment is subject to risks. I or my clients or family members might have positions in the stocks that we mention in our educational posts. We will not be responsible for any Profit or loss that may occur due to any financial decision taken based on any data provided in this message. Do consult your investment advisor before taking any financial decisions. Stop losses should be an important part of any investment in equity.

Nifty approaching major support zones very fast. We saw a slide in Nifty this week due to Tariff related concerns and H1B Visa related concerns. The announcements triggered major sell off from FIIs (Who are anyway on a sell path for a long time) and the retail investors. DII and probably HNIs too are buying every sell off which is helping the market from not having a catastrophic fall. Now Nifty is fast approaching the points which can be potential turnaround zones.
Supports For nifty remain at: 24501, 24209 Mother Line Support) falling below Mother line of weekly chart (Very strong support)(50 Weeks EMA) can help the bears to tighten the grip over the market. If we get a closing below 24209 the next support levels will be at 23912, 23116. In very unlikely circumstances Nifty can reach 21741 or 20936 (Father line support).
Resistance For Nifty remain at: 25030, 25516 (Trend line resistance)(Strong resistance), 26277 (Nifty All Time High). If and when we are able to close above 26277. Nifty will gallop quickly towards 27K or even 28K.
It has been a long wait to reach 27K so far after we reached the All time high of 26277 in September 24. 1 year on we are having negative returns on Nifty due to International wars, Indo-Pak war episode followed by Trump Tariff but ones the tide turns a bright upside awaits us. Indian GDP is still expected to grow at 6.5% as per IMF and many other agencies. The night will end and there will be daylight soon. Sometimes it is the darkest before the sun is about to shine. Keep the faith. Sectoral rotation is always advised.
Emphasise on sectors that will benefit from local consumption increase due to Income tax relief, GST relief and Government spending, Chip making, on Infra, Power and defense, Banking, NBFCs and Finances. Sometimes it is just the question of shifting the sail in the direction of the tailwind.
Disclaimer: The above information is provided for educational purpose, analysis and paper trading only. Please don't treat this as a buy or sell recommendation for the stock or index. The Techno-Funda analysis is based on data that is more than 3 months old. Supports and Resistances are determined by historic past peaks and Valley in the chart. Many other indicators and patterns like EMA, RSI, MACD, Volumes, Fibonacci, parallel channel etc. use historic data which is 3 months or older cyclical points. There is no guarantee they will work in future as markets are highly volatile and swings in prices are also due to macro and micro factors based on actions taken by the company as well as region and global events. Equity investment is subject to risks. I or my clients or family members might have positions in the stocks that we mention in our educational posts. We will not be responsible for any Profit or loss that may occur due to any financial decision taken based on any data provided in this message. Do consult your investment advisor before taking any financial decisions. Stop losses should be an important part of any investment in equity.

Weak closing but market on the verge of being oversold.We saw a closing today that has dragged Nifty below Father line support and mid channel support of hourly chart. RSI is indicating that the market is oversold and there are slim chances of recovery from support near 24872. If 24872 is broken than we can see Nifty further slipping towards 24772, 24644 or even channel bottom near 24473. If 24473 is broken then market can end up in total bear grip.
Resistances for market seem to be near 24959 Mid channel resistance, followed by father line and Mother line resistance near 24999 and 24125. Closing above 25125 can take the market upwards towards 25215, 25343 and 25431. As of now 25431 is the channel top.
As of now shadow of the candle is neutral but with a tinge of red. Meaning we can have a flat to positive start but later market can become laggard again. For market to sustain upward momentum we need a closing above both Mother and Father line resistances on daily chart.
Disclaimer: The above information is provided for educational purpose, analysis and paper trading only. Please don't treat this as a buy or sell recommendation for the stock or index. The Techno-Funda analysis is based on data that is more than 3 months old. Supports and Resistances are determined by historic past peaks and Valley in the chart. Many other indicators and patterns like EMA, RSI, MACD, Volumes, Fibonacci, parallel channel etc. use historic data which is 3 months or older cyclical points. There is no guarantee they will work in future as markets are highly volatile and swings in prices are also due to macro and micro factors based on actions taken by the company as well as region and global events. Equity investment is subject to risks. I or my clients or family members might have positions in the stocks that we mention in our educational posts. We will not be responsible for any Profit or loss that may occur due to any financial decision taken based on any data provided in this message. Do consult your investment advisor before taking any financial decisions. Stop losses should be an important part of any investment in equity.

Channel top and H1B visa mayhem hits Nifty. Nifty was today hit by dual mayhem of Channel top resistance and the hike in H1B visa fees by US. As we know IT sector was the worst hit today as IT index plummeted further down by -2.95%. Pharma and Small Cap index where other indices which took major hit. Commodities like Gold and Silver continued to shine. It is yet to be seen if IT index will plummet further or this was just a one day negativity. There are Pros and Cons of the hike lot of analyst believe that this is definitely a jolt for now but it will end up strengthening Indian It sector as lot more offshoring of work will happen. It is too early to judge if this shock will be absorbed in a day, week or IT index will take more time to recover from this issue.
The support for Nifty remain at: 25200 is the immediate trend line support where the Nifty stopped today, followed by 25133 and 24997. 24947 is the mid channel line support below which Nifty will become very weak.
The Resistances for Nifty remain at: 25221 (Mother line resistance) followed by 25309 and 25364. If we get a closing above 25364 Channel top seems to be near 25431 and 25469. Closing above 25469 will give us a channel Break Out and will have potential to lead us to new highs.
Disclaimer: The above information is provided for educational purpose, analysis and paper trading only. Please don't treat this as a buy or sell recommendation for the stock or index. The Techno-Funda analysis is based on data that is more than 3 months old. Supports and Resistances are determined by historic past peaks and Valley in the chart. Many other indicators and patterns like EMA, RSI, MACD, Volumes, Fibonacci, parallel channel etc. use historic data which is 3 months or older cyclical points. There is no guarantee they will work in future as markets are highly volatile and swings in prices are also due to macro and micro factors based on actions taken by the company as well as region and global events. Equity investment is subject to risks. I or my clients or family members might have positions in the stocks that we mention in our educational posts. We will not be responsible for any Profit or loss that may occur due to any financial decision taken based on any data provided in this message. Do consult your investment advisor before taking any financial decisions. Stop losses should be an important part of any investment in equity.

Nifty in search of a bottom before Trump Tariff Deadline. Nifty nose dived more than 1% today as the deadline for additional Tariff implementation has arrived. With a market holiday tomorrow investor shorted their positions. The supports for Nifty travelling in the hourly parallel channel which is shown in the chart seem to be at 24689 and 24573. If we get a closing below 24573 then Nifty can fall further to 24351 or below. We are in the zone from where historical RSI support as you can see in the chart. This makes it possible for Nifty to fight back on Thursday and Friday if things go well on Political front and there is no further bad news.
In the scenario of Nifty fighting back the resistance for Nifty seems to be at 24776. If we get a closing above 24776 then there is a triple strong resistance zone between 24850 and 24939. This zone consists of 4 strong resistances which are mid-channel resistance, Mother line of hourly chart, father line of hourly chart and finally trend line resistance. Once we get a closing above 24939 the future resistances will be at 25013, 25127 and finally 25253. Above 25253 closing Bulls will be back in business.
Disclaimer: The above information is provided for educational purpose, analysis and paper trading only. Please don't treat this as a buy or sell recommendation for the stock or index. The Techno-Funda analysis is based on data that is more than 3 months old. Supports and Resistances are determined by historic past peaks and Valley in the chart. Many other indicators and patterns like EMA, RSI, MACD, Volumes, Fibonacci, parallel channel etc. use historic data which is 3 months or older cyclical points. There is no guarantee they will work in future as markets are highly volatile and swings in prices are also due to macro and micro factors based on actions taken by the company as well as region and global events. Equity investment is subject to risks. I or my clients or family members might have positions in the stocks that we mention in our educational posts. We will not be responsible for any Profit or loss that may occur due to any financial decision taken based on any data provided in this message. Do consult your investment advisor before taking any financial decisions. Stop losses should be an important part of any investment in equity.

Good turnaround by market as expected from the channel bottom.We had given a message that the market was nearing the bottom and there can be a turnaround sooner than later and market turned around today. This bounce can be currently seen as a technical bounce but it can become a full fledged fightback by bulls if it crosses key resistance levels of Mother line, Father line and Mid-channel resistance. These are the 3 key resistances in front of us currently. All eyes on the important trade deal announcements and with US and China which are on going any news on that from can disrupt the market proceedings in either way. Support and resistance levels for Nifty are as under:
Key Nifty Resistances: 24849 (Trend line resistance), 24922 (Motherline Resistance of hourly chart), 25028, 25070 (Father line resistance), 25189 (Mid-channel resistance), 25243 (Very important resistance for Bulls to conquer). Above 25243 Bulls can gain control of Nifty.
Key Support levels: 25741, 25627 (Channel bottom Support), 24519.
Disclaimer: The above information is provided for educational purpose, analysis and paper trading only. Please don't treat this as a buy or sell recommendation for the stock or index. The Techno-Funda analysis is based on data that is more than 3 months old. Supports and Resistances are determined by historic past peaks and Valley in the chart. Many other indicators and patterns like EMA, RSI, MACD, Volumes, Fibonacci, parallel channel etc. use historic data which is 3 months or older cyclical points. There is no guarantee they will work in future as markets are highly volatile and swings in prices are also due to macro and micro factors based on actions taken by the company as well as region and global events. Equity investment is subject to risks. I or my clients or family members might have positions in the stocks that we mention in our educational posts. We will not be responsible for any Profit or loss that may occur due to any financial decision taken based on any data provided in this message. Do consult your investment advisor before taking any financial decisions. Stop losses should be an important part of any investment in equity.

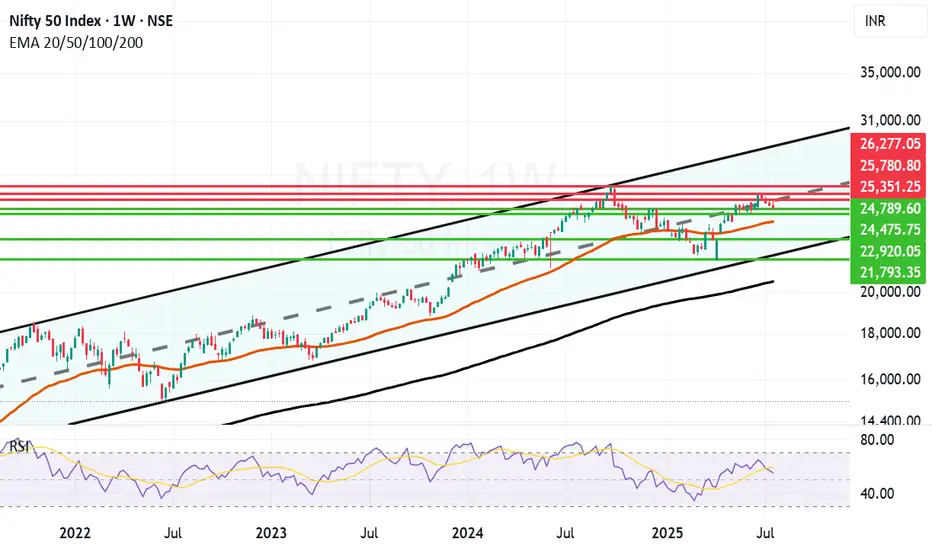
Long term Nifty Outlook Still upbeat. Long term outlook of Nifty is still upbeat. As you can see in the parallel channel in the weekly chart of Nifty. As you can see in the weekly chart Nifty attempted to break free above the Mid-Channel resistance went above it briefly but due to various geopolitical, Tariff and earning related concerns has not yet been successful. In a few years time the channel top can be around 30K and channel bottom seems to be around 21K. Supports for Nifty currently are near 24789, 24475, 23969 (Mother Line support of Weekly chart), 22920 and 21793 (Channel Bottom.) Below that 200 Weeks EMA ot the Father line is at 20577. Resistances for Nifty with long term perspective remain at 25351, 25780 and previous All time high of 26277. Once we get a weekly or monthly closing above 26277 the doors towards 27K+ will open.
Disclaimer: The above information is provided for educational purpose, analysis and paper trading only. Please don't treat this as a buy or sell recommendation for the stock or index. The Techno-Funda analysis is based on data that is more than 3 months old. Supports and Resistances are determined by historic past peaks and Valley in the chart. Many other indicators and patterns like EMA, RSI, MACD, Volumes, Fibonacci, parallel channel etc. use historic data which is 3 months or older cyclical points. There is no guarantee they will work in future as markets are highly volatile and swings in prices are also due to macro and micro factors based on actions taken by the company as well as region and global events. Equity investment is subject to risks. I or my clients or family members might have positions in the stocks that we mention in our educational posts. We will not be responsible for any Profit or loss that may occur due to any financial decision taken based on any data provided in this message. Do consult your investment advisor before taking any financial decisions. Stop losses should be an important part of any investment in equity.
Can Reliance and Banks turn Nifty around? do or die Monday. Nifty as of now has taken support at Mother line in daily chart. As expected in my Yesterday's message. So Hopefully if Big Banks Results are in line tomorrow we might see Nifty going upwards from Monday.
Mota Bhai just announced the results. EBITDA is slightly less than expected but Net Profit and Revenue is much better than Market expectation. In my view market should react positively to this result.
Supports For Nifty remain at 24932 (Mother line), 24759, 24503. As indicated earlier if we get a closing below 24503 we may see a Fall towards 24106 or 23929 (In unlikely circumstances).
Nifty Resistances remain at: 25035, 25248, 25400 and 25613 (Channel top Resistance).
Results for tomorrow
HDFC BANK
ICICIBANK
AUSMALL BANK
RBL BANK
UNION BANK
YES BANK
CENTR BANK
PUNJA BANK
CENTR BANK
So it seems like a Do or Die Monday on cards. Shadow of the candle looks neutral as of now.
Disclaimer: The above information is provided for educational purpose, analysis and paper trading only. Please don't treat this as a buy or sell recommendation for the stock or index. The Techno-Funda analysis is based on data that is more than 3 months old. Supports and Resistances are determined by historic past peaks and Valley in the chart. Many other indicators and patterns like EMA, RSI, MACD, Volumes, Fibonacci, parallel channel etc. use historic data which is 3 months or older cyclical points. There is no guarantee they will work in future as markets are highly volatile and swings in prices are also due to macro and micro factors based on actions taken by the company as well as region and global events. Equity investment is subject to risks. I or my clients or family members might have positions in the stocks that we mention in our educational posts. We will not be responsible for any Profit or loss that may occur due to any financial decision taken based on any data provided in this message. Do consult your investment advisor before taking any financial decisions. Stop losses should be an important part of any investment in equity.
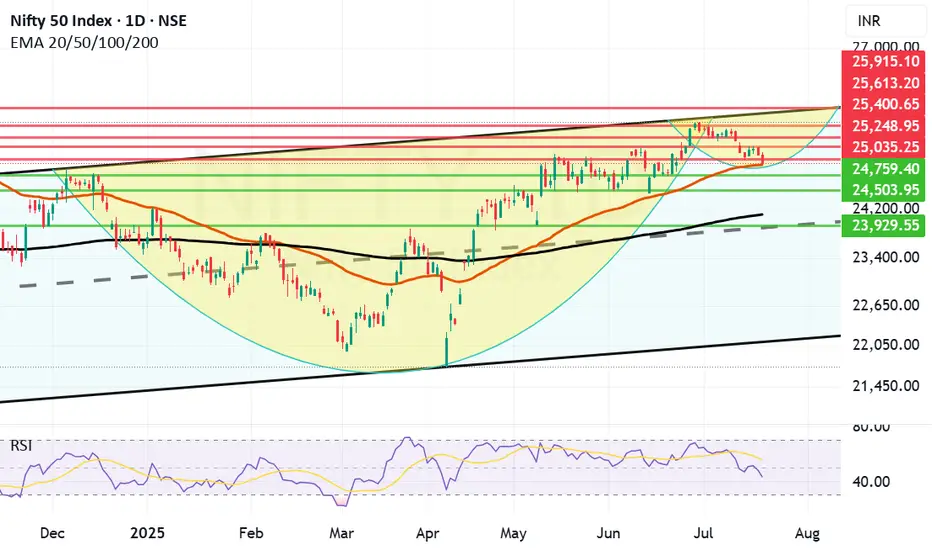
If Mother Line Support will hold, we might see a C&H formation. Although we saw a negative closing today, the chart suggests that if Mother line support will hold we might see a reversal and a Cup and Handle Formation in the near future. Cup and Handle formation is a great pattern which can help us reach the previous high and surpass it. If it happens or not only time can tell.
Supports For Nifty right now remain at: 25035, 24930 (Important Mother Line Support of Daily chart), 24759 and 24503. If 24503 is broken then there will be overall weakness in the market and we can see Nifty plummeting to 24097 (Father Line Support of Daily chart). Just below 24907 there will also be the mid channel support of 23929. (Just in case we reach there).
Resistances For Nifty Remain at: 25248, 25400, 25613 and 25915 seems to be the channel top as of now.
Nifty is delicately placed and the support of 24930 and Resistance of 25248 are the key levels to be watched. Above 25248 Bulls become strong. Below 24930 Bears become strong. Right now we are in no man's land with shadow of the candle slightly negative. If we see a bounce tomorrow or from the Mother line the shadow will has potential to turn positive later in the day tomorrow or next week.
Short term Outlook: Neutral to negative.
Medium Term Outlook: Neutral to Positive.
Long Term Outlook: Positive.
Disclaimer: The above information is provided for educational purpose, analysis and paper trading only. Please don't treat this as a buy or sell recommendation for the stock or index. The Techno-Funda analysis is based on data that is more than 3 months old. Supports and Resistances are determined by historic past peaks and Valley in the chart. Many other indicators and patterns like EMA, RSI, MACD, Volumes, Fibonacci, parallel channel etc. use historic data which is 3 months or older cyclical points. There is no guarantee they will work in future as markets are highly volatile and swings in prices are also due to macro and micro factors based on actions taken by the company as well as region and global events. Equity investment is subject to risks. I or my clients or family members might have positions in the stocks that we mention in our educational posts. We will not be responsible for any Profit or loss that may occur due to any financial decision taken based on any data provided in this message. Do consult your investment advisor before taking any financial decisions. Stop losses should be an important part of any investment in equity.

Nifty has taken support at 25K but can the support hold?Nifty today took a meaningful support at 25001 and bounced close to 25082. However ending the was in the negative by 67.55 points. RSI today went as low as 13.52 indication of oversold market. IT was a major drag after result that market did not like.
Now the resistances in front of Nifty are at 25106, Father Line Resistance at 25106, 25234, Mother Line Resistance at 25297, 25403 and finally 25543. Supports for Nifty remain at 25K, 24866 Chanel Bottom support and finally 24752. Below 24752 Bears can totally take control of the market if we reach there.
Things are in balance right now with Mid-cap, Small-cap starting to see some buying. If IT can hold the levels we will see growth from here. If IT index further caves in and other indices do not support we can see a down side. Shadow of the candle right now is neutral to negative.
Disclaimer: The above information is provided for educational purpose, analysis and paper trading only. Please don't treat this as a buy or sell recommendation for the stock or index. The Techno-Funda analysis is based on data that is more than 3 months old. Supports and Resistances are determined by historic past peaks and Valley in the chart. Many other indicators and patterns like EMA, RSI, MACD, Volumes, Fibonacci, parallel channel etc. use historic data which is 3 months or older cyclical points. There is no guarantee they will work in future as markets are highly volatile and swings in prices are also due to macro and micro factors based on actions taken by the company as well as region and global events. Equity investment is subject to risks. I or my clients or family members might have positions in the stocks that we mention in our educational posts. We will not be responsible for any Profit or loss that may occur due to any financial decision taken based on any data provided in this message. Do consult your investment advisor before taking any financial decisions. Stop losses should be an important part of any investment in equity.
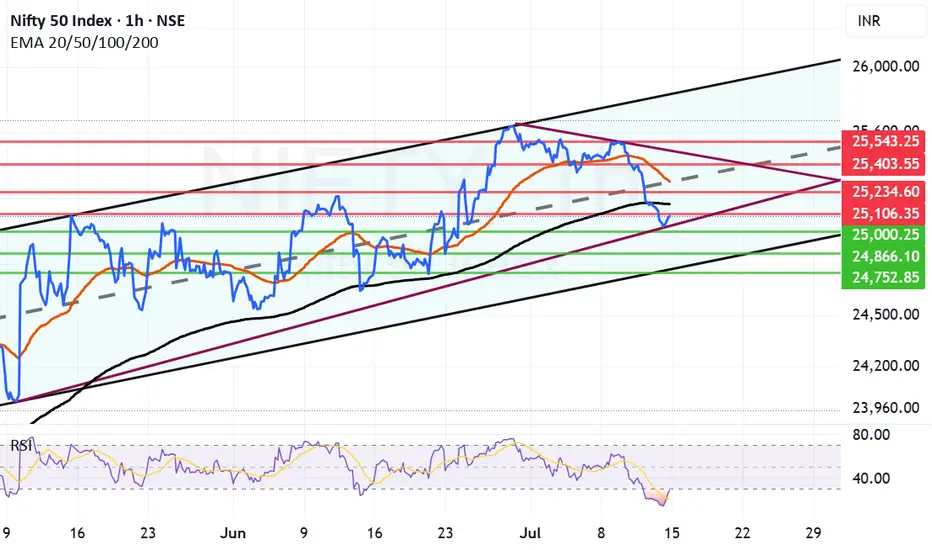
Nifty approaching Mid-channel support zone now. Nifty after a 120 point negative closing is entering an important support zone. This support zone has 3 layers. The First of the support lies at 25322 which is just above the mid-channel. The second for Nifty is near 25222 which is just below the mid channel support.
There is a possibility of bounce either from the current level or either of these 2 levels. If we get a closing below 25322 then there is a possibility that bears might try to pull Nifty down towards 25167 which is the Father line or 200 Hours EMA.
The resistances for Nifty remain at 25404, 25437 which is the Mother line or 50 hours EMA. Post that there are resistances at 25477, 25551 and 25641. Closing above 25641 is required for Nifty to fly towards 26K levels.
Disclaimer: The above information is provided for educational purpose, analysis and paper trading only. Please don't treat this as a buy or sell recommendation for the stock or index. The Techno-Funda analysis is based on data that is more than 3 months old. Supports and Resistances are determined by historic past peaks and Valley in the chart. Many other indicators and patterns like EMA, RSI, MACD, Volumes, Fibonacci, parallel channel etc. use historic data which is 3 months or older cyclical points. There is no guarantee they will work in future as markets are highly volatile and swings in prices are also due to macro and micro factors based on actions taken by the company as well as region and global events. Equity investment is subject to risks. I or my clients or family members might have positions in the stocks that we mention in our educational posts. We will not be responsible for any Profit or loss that may occur due to any financial decision taken based on any data provided in this message. Do consult your investment advisor before taking any financial decisions. Stop losses should be an important part of any investment in equity.
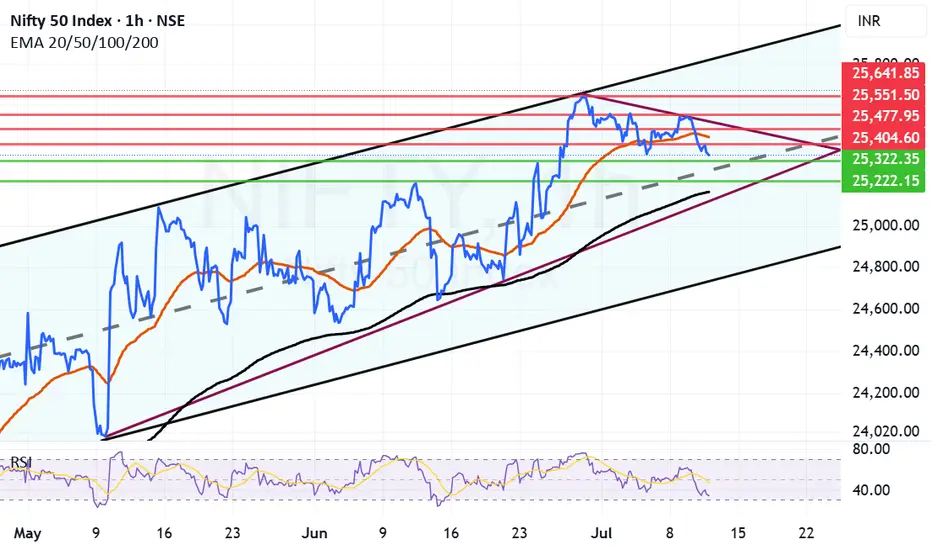
Nifty facing strong resistance between 25587 and 25500. Nifty today again failed to hold levels above 25500 as it made a high of 25587 and closed at 25405. Closing almost 182 point from its high today and 48 points down from yesterday. This is a worrying sign even if just slightly as for moving towards 26K we need a strong closing of the week at least above the Mother line. Nifty closed just below Motherline today which is showing some weakness in the rally which seems to be losing direction. The fear of Tariffs seems to be taking toll on Bulls whereas bears are currently gaining strength. The closing we get tomorrow will indicate a definitive direction to Nifty.
The Supports for Nifty currently remain at: 25385, 25299, 25177 (strong trend line support) and finally we will have Father line support of Hourly candles which is at 25050. Closing 25050 below will have potential to drag Nifty further down towards 24700 which is again a strong Channel bottom support.
The Resistances for Nifty currently remain at: 25416 (Mother line Resistance), 25470, The zone between 25500 and 25587 is a strong Trend line resistance. A closing above 25587 will have potential to take Nifty towards 25603, 25679 or even 25759 (Which is again a strong Channel top resistance).
Disclaimer: The above information is provided for educational purpose, analysis and paper trading only. Please don't treat this as a buy or sell recommendation for the stock or index. The Techno-Funda analysis is based on data that is more than 3 months old. Supports and Resistances are determined by historic past peaks and Valley in the chart. Many other indicators and patterns like EMA, RSI, MACD, Volumes, Fibonacci, parallel channel etc. use historic data which is 3 months or older cyclical points. There is no guarantee they will work in future as markets are highly volatile and swings in prices are also due to macro and micro factors based on actions taken by the company as well as region and global events. Equity investment is subject to risks. I or my clients or family members might have positions in the stocks that we mention in our educational posts. We will not be responsible for any Profit or loss that may occur due to any financial decision taken based on any data provided in this message. Do consult your investment advisor before taking any financial decisions. Stop losses should be an important part of any investment in equity.
