#NIFTY Intraday Support and Resistance Levels - 03/02/2026Nifty is expected to open with a strong bullish gap-up of around 500–800+ points, which clearly reflects positive sentiment and aggressive buying interest in the market. Such a gap-up generally indicates overnight strength driven by global cues or strong domestic triggers, and it often puts immediate pressure on short positions. However, traders should stay alert during the opening minutes, as large gap-ups can initially show volatility or brief profit booking before the real directional move unfolds.
From a technical view, the zone around 25550 will be the first crucial level to watch. If Nifty sustains above this level after the opening, it will confirm bullish continuation. In that scenario, the index can gradually move towards 25750, 25800, and 25950+. Further strength above 26050 will signal a higher breakout, opening the path for extended targets around 26150, 26200, and 26250+, keeping the broader trend decisively positive.
On the downside, despite the gap-up bias, traders must remain cautious of false breakouts. The level near 25450 will act as an important support. If Nifty slips below this zone and fails to reclaim it, it may indicate early profit booking after the gap-up. In such a case, a corrective move towards 25350, 25300, and 25200 cannot be ruled out, especially if selling pressure increases near resistance zones.
Overall, the structure remains bullish as long as Nifty holds above key support levels, and buying on dips is likely to be the preferred strategy. Traders are advised to avoid chasing prices at the open, wait for confirmation near important levels, and manage risk strictly, as gap-up sessions often bring sharp intraday swings along with strong trending opportunities.
Niftyprediction


Nifty Short,Med,Long Term Supports& Resistance_2nd to 6th Feb-26Nifty 24820 (Last week 25048 )
Nifty dipped by 550 points on budget day and settled above Short Term 24819 Support provided.
Budget was a disappointment, concentrated on long term reforms. Hence, Market reflected it.
Semiconductor & Textile push was concentrated with PLI.
High Speed Rail Corridors from Mumbai to chennai and Delhi to Silguri.
Since the GST was reduced in Oct 2025 and also the Income Tax slab reduction last year, there was no much changes in Direct and Indirect Taxes.
last week on profit booking due to global tensions, Q3 results and Pre Budget dip.
Use this opportunity to buy slowly. Since the short term suppport is broken, there is no need in any urgency to buy the stocks.
As far as India is concerned, economy is moderate.
The Nifty 500 stocks have shown a mix of performance in Q3 FY25-26. Some stocks have performed well, while others have lagged.
Q3 results are moderate as public sector banks like union bank, punjab sind, Federal & IOB posted good results. Reliance with moderate 1% up, hdfc bank posted 12% up, ICICI bank -3%, IDBI Bank is flat, Yes Bank is up but sales and EBIT are negative, South indian bank 9%, Infosys 11%, wipro -7% and Tech Mah 33%, Polycab 36%, HDB Fin Services 36% , HDFC Life -1% and ICICI Pru Life 12% and ICICI AMC 45% up and budget for 2026-27 to be proposed on Ist Feb 2026. Persistent system, Waaree Energies , CPCL , BPCL, SBFC Fin, Ultratech Cem, mcx, laurus lab, KVB gave very good results this week.
On Budget Day, Muthoot Fin, Gold related stocks like Muthoot , Thangamayil, MAnappuram, Titan have fallen, Nalco, Hindalco have fallen by 10% in last two sessions.
Also Public Sector banks are reduced,
Gold have dropped more than 15 % in last two trading session, silver near to 50%.
As i am emphasizing for more than 3 months now, that the situation is highly Volatile, SIP route or buy in multiple parcel route (On Dips) with a goal of 3-5 years ( Medium to Long term) will workout.
Considering the global situation, diversify the portfolio with Debt and liquid fund ( approx 20-30% portfolio) and 10-20% in Gold & Silver for Year 2026, this funds ( especially liquid funds will create funds availability for further buying opportunity incase of market dips like a Systematic transfer plan.
Some of the stocks to watchout given last week are HDFC AMC, NMDC, Apar, Sharda Crop, VRL Logistics, krishna Phos chem, Cipla, Dr Reddy, Natco pharma, Apl Apollo Tubes, Muthoot Finance ( On Dips) , tata Steel ( Contra Stock due to Business Cycle), Bank of Mah, BPCL, CG Power, hero motor, shriram finance and NRB bearings. Shared for Analysis purpose only. Dr Reddy, shriram fin, natco pharma, Hero moto corp,HPCL, BPCL, IOCL, Carysil, MAS Financial Services and BSE . Waaree Energies had an IT raid in its premises in Mid of Nov 2025. Outcome will take the stock forward.
New stocks proposed for watchout for 29-Dec-25 to 02-Jan-26 is Indian Bank and NBCC, buy on dip as market in volatile situation. Both stocks reduced further and in buyable range.
New Stocks ( to watchout For Jan Ist Week 2026) are ITC & Lupin.
For 18-Jan-26, after Q3 Results HDFC AMC ( already provided in the call above), Poly cab, union bank, Tech Mah, Infosys are some of the picks for Watchlist.
New Stocks to watchout for 01-Feb-26 are Capri Global, persistent systems, narayana hrudayala, nalco, Dixon & CG Power ( Semiconductor Push).
All the above stocks can be considered slowly ( as multiple parcels) in case of stock price has fallen.
RSI, MACD, Stochastic all indicators are in oversold situation and caution to be emphasized till each indicators move past its respective signal.
Nifty Short Term Supports :
24819 (Trend Line as shown)
Short Term Resistance ( Many from 25000-26320)
1.26329 ( All time High)
25670 (Jun 2025 High)
25360-25420 ( Sep high and trendline support as shown in chart)
25300-25350 (Two Fibonacci resistance shown ) - Major Support
Hence 25300- 25420 acts as major short term support.
25500 ( 25441 Sep 18th 2025 High )
25450 ( 25442 is the Aug 2025 high)
25200 ( 25154 Aug 2025 high)
25000
Medium Term Support:
1. 24000-24170 (Fibonacci Retracements Supports- Two Supports in this zone 24116 & 24171 as shown)
2. 23500-23700 (Fibonacci Retracements Supports- Two Supports in this zone 23608 & 23707 as shown)
3. 23000
Medium Term Resistance:
1.27000 ( Need to decisively break 26269 all time high) This resistance is based on Fibonacci resistance at 27034
2. 26500
3. 26700 ( Finonacci 1.618 as shown in graph)
Long term resistance:
1.28000 ( Need to decisively break and move up 27000)This resistance is based on Fibonacci resistance at 28106
Long Term Support
1.22700-23000 ( Trend line and Mar 2024 High)
2.Big support at 20000 (Sep 2023 high)

Nifty Analysis EOD – January 30, 2026 – Friday🟢 Nifty Analysis EOD – January 30, 2026 – Friday 🔴
The Calm Before the Storm: Nifty Coils for Budget-26!
🗞 Nifty Summary
As predicted, Friday was a “silent” consolidation session characterized by narrow range-bound movement and pre-event manipulation.
The day started with an unexpected 150-point Gap Down that tested our second support at 25,270. Nifty found its footing at the Fib 0.786 level, which acted as a rock-solid floor throughout the day.
A late-session attempt to break the IBH and the Long-Term Trendline at 1:50 PM briefly crossed the 25,335 mark, but the momentum faded precisely at the Fib 0.618 retracement level.
Nifty eventually closed at 25,320.65 (-0.39%), positioning itself exactly in the center of a high-stakes 700-point battlefield.
🛡 5 Min Intraday Chart with Levels
🛡 Intraday Walk
The session was a classic “wait-and-watch” game.
The 157-point range—significantly lower than the Gladiator average of 260—confirms that institutional players are sitting on the sidelines ahead of Sunday’s Budget.
While the intraday volatility offered some scalp opportunities, the false IBH breakout served as a trap for those over-anticipating the move.
The market is now balanced on a knife-edge, with the daily close sitting equidistant from major targets on both sides.
📉 Daily Time Frame Chart with Intraday Levels
🕯 Daily Candle Breakdown
Open: 25,247.55
High: 25,370.70
Low: 25,213.65
Close: 25,320.65
Change: -98.25 (-0.39%)
🏗️ Structure Breakdown
Type: Small Bullish Candle according CDO (Bearish according to PDC)
Range: ≈ 157 points — significantly compressed volatility.
Body: ≈ 73 points — mild selling pressure from the gap-up rejection. (Same size of Previous day)
Upper Wick: ≈ 123 points — strong supply rejection from the 25,370 zone.
Lower Wick: ≈ 34 points — limited buying interest at the extreme lows.
📚 Interpretation
The candle structure is the definition of indecision. The long upper wick proves that sellers are still capping any pre-emptive rallies, while the narrow body reflects a lack of directional conviction. The market has effectively “coiled,” and this compression usually leads to a violent expansion once the Budget news hits the tape.
🕯 Candle Type
Bearish Rejection / Consolidation Candle — Signals a standoff; the Budget session will be the ultimate tie-breaker for this structure.
🛡 5 Min Intraday Chart
⚔️ Gladiator Strategy Update
ATR: 254.37
IB Range: 104..20 → Medium
Market Structure: Balanced
Trade Highlights:
12:23 Long Trade: SL Hit (Mistake: Assumed HTF break based on STF trend; recency bias).
13:54 Long Trade: Trailing Hit (1:0.76) (HTF Trendline Breakout).
Psychology Note: As explicitly mentioned in yesterday’s note, today was intended to be a “No-Trade” day due to expected pre-event consolidation. However, greed and recency bias triggered entries in a non-conducive environment.
The market punished the mistake, providing a stern reminder that discipline is more important than catching every tick.
🧱 Support & Resistance Levels
Resistance Zones:
25,370
25,430 ~ 25,460
25,515
25585 ~ 25605
25650 ~ 25,670
Support Zones:
25180 ~ 25160
25,060
25009
24970 ~ 24920
🧠 Final Thoughts
🧠 Special Budget-26 Note :
The Nifty has closed at 25,320, which is exactly the center point between the 25,670 resistance and the 24,970 support (350 points each way).
For the Budget day, it is highly probable that Nifty will test at least one of these extremes.
A sustained breach of the 25,160–25,460 range will be our “Prime Trade” signal.
✏️ Disclaimer
This is just my personal viewpoint. Always consult your financial advisor before taking any action.

Nifty SpotA sharp downturn occurred on January 23, when the index dropped to approximately 25,048.65, reflecting intense selling and risk aversion. This was one of the more pronounced near-term drops within the ten-day window.
The recent weakness was influenced by:
Global trade concerns and geopolitical noise, which weighed on risk assets and dragged domestic benchmark performance.
Foreign portfolio investor outflows, particularly around mid-January, which compounded selling pressure.
Sector-specific weakness, notably in technology and mid/small-cap segments during the down phase.
Run up to Budget on FEB 1 ... volatility will increase
marked important price action levels marked...
Like and share

How we Create Viewpoint In Nifty 50 29 JAN.Market structure clearly indicates selling pressure, and as per price action logic, price may continue its move towards the next demand zone, where buyers could potentially become active.
This analysis is purely educational, based on chart structure, supply–demand dynamics, and past price behavior. It is not a prediction or guarantee of market movement.
⚠️ Always wait for confirmation near the demand zone before taking any decision.
⚠️ Proper risk management and stop-loss are essential.
📌 Disclaimer:
This content is for educational purposes only. I am not a SEBI-registered advisor. No buy/sell recommendation is being given. Please consult a qualified financial advisor before making any trading or investment decisions.
Charts are shown as per TradingView guidelines and used only for learning and analysis.
Youtube— ProTradeMartix

nifty 28.01.2026expiry day action shows bullish strength after range-bound movement. support placed at 25100- shorts only below this level. resistance at 25250 & 25350. fresh buying interest likely above 25250.

BTR PRO Delivers Again – +50 Points INTRADAY! 27 Jan 2026🔥 BTR PRO DELIVERS AGAIN – +50 POINTS INTRADAY! 🔥
📅 Date: 27 Jan 2026
Stock: BSE LTD
Indicator: BTR PRO Price Action (SL + Targets)
✅ BUY ENTRY: 2705
🎯 T1 HIT
🎯 T2 HIT
🎯 T3 HIT
📈 INTRADAY EXIT: 2755
💰 PROFIT: +50 POINTS CLEAN MOVE
No noise.
No emotions.
Pure Price Action + Rule-Based Targets.
📌 Intraday traders booked full 50 points
📌 Swing targets worked perfectly
👉 Follow BTR PRO
👉 Trade with structure, not hope
#BTRPRO #50Points #IntradayTrading #BSELTD #PriceAction #TradingView #NoEmotionTrading #ConsistencyWins 💪📊

Nifty Short,Mid and Long Term 27=Jan-26 to 30-Jan-26Nifty 25048 (last week 25694 )
Nifty dipped by 650 points last week on profit booking due to global tensions, Q3 results and Pre Budget dip. It would be good opportunity for bottom fish the stocks and to buy mutual funds if it dips.
As far as India is concerned, economy is moderate.
The Nifty 500 stocks have shown a mix of performance in Q3 FY25-26. Some stocks haveperformed well, while others have lagged.
Q3 results are moderate as public sector banks like union bank, punjab sind, Federal & IOB posted good results. Reliance moderate 1% up, hdfc bank posted 12% up, ICICI bank -3%, IDBI Bank is flat, Yes Bank is up but sales and EBIT are negative, South indian bank 9%, Infosys 11%, wipro -7% and Tech Mah 33%, Polycab 36%, HDB Fin Services 36% , HDFC Life -1% and ICICI Pru Life 12% and ICICI AMC 45% up and budget for 2026-27 to be proposed on Ist Feb 2026. Persistent system, Waaree Energies , CPCL , BPCL, SBFC Fin, Ultratech Cem, mcx, laurus lab, KVB gave very good results this week.
Other Q3 Results and 1St Feb Budget will take the market to next level.
Since it is a Volatile situation SIP route or buy in multiple parcel route (On Dips) with a goal of 3-5 years ( Medium to Long term) will workout.
Considering the global situation, diversify the portfolio with Debt and liquid fund ( approx 20-30% portfolio) and 10-20% in Gold & Silver for Year 2026, this funds ( especially liquid funds will create funds availability for further buying opportunity incase of market dips like a Systematic transfer plan.
Some of the stocks to watchout given last week are HDFC AMC, NMDC, Apar, Sharda Crop, VRL Logistics, krishna Phos chem, Cipla, Dr Reddy, Natco pharma, Apl Apollo Tubes, Muthoot Finance ( On Dips) , tata Steel ( Contra Stock due to Business Cycle), Bank of Mah, BPCL, CG Power, hero motor, shriram finance and NRB bearings. Shared for Analysis purpose only. Dr Reddy, shriram fin, natco pharma, Hero moto corp,Muthoot Finance have already given more than 10% return in this 1 month,HPCL, BPCL, IOCL, Carysil, MAS Financial Services and BSE . Waaree Energies had an IT raid in its premises in Mid of Nov 2025. Outcome will take the stock forward.
New stocks proposed for watchout for 29-Dec-25 to 02-Jan-26 is Indian Bank and NBCC, buy on dip as market in volatile situation. Both stocks reduced further and in buyable range.
New Stocks ( to watchout For Jan Ist Week 2026) are ITC & Lupin.
For 18-Jan-26, after Q3 Results HDFC AMC ( already provided in the call above), Poly cab, union bank, Tech Mah, Infosys are some of the picks for Watchlist.
All the above stocks can be considered slowly ( as multiple parcels) in case of stock price has fallen.
RSI, MACD, Stochastic all indicators are in oversold situation and caution to be emphasized till each indicators move past its respective signal.
Nifty Short Term Supports :
25000 ( Milestone)
24900
24700 & 24814 (Trend Line as shown)
Short Term Resistance ( Many from 25000-26320)
1.26329 ( All time High)
25670 (Jun 2025 High)
25360-25420 ( Sep high and trendline support as shown in chart)
25300-25350 (Two Fibonacci resistance shown ) - Major Support
Hence 25300- 25420 acts as major short term support.
25500 ( 25441 Sep 18th 2025 High )
25450 ( 25442 is the Aug 2025 high)
25200 ( 25154 Aug 2025 high)
Medium Term Support:
1. 24000-24170 (Fibonacci Retracements Supports- Two Supports in this zone 24116 & 24171 as shown)
2. 23500-23700 (Fibonacci Retracements Supports- Two Supports in this zone 23608 & 23707 as shown)
3. 23000
Medium Term Resistance:
1.27000 ( Need to decisively break 26269 all time high) This resistance is based on Fibonacci resistance at 27034
2. 26500
3. 26700 ( Finonacci 1.618 as shown in graph)
Long term resistance:
1.28000 ( Need to decisively break and move up 27000)This resistance is based on Fibonacci resistance at 28106
Long Term Support
1.22700-23000 ( Trend line and Mar 2024 High)
2.Big support at 20000 (Sep 2023 high)

Nifty Analysis EOD – January 23, 2026 – Friday🟢 Nifty Analysis EOD – January 23, 2026 – Friday 🔴
106-Day Support Snaps: Bears Breach the Gate ?
🗞 Nifty Summary
The Nifty started with a mild 27-point Gap Up, entering a high-voltage battle zone between 25,250 ~ 25,350. This 100-point range saw wild intraday swings that trapped both sides before a clear direction emerged.
At 11:35 AM, the bulls finally gave up, leading to a decisive IB Low breakout. The bearish sentiment accelerated as the PDL (Previous Day Low) was breached at 1:15 PM.
Despite a brief attempt to hold the 25,180 level, the index plummeted to its “last resort” support of 25,060, closing the session at 25,048.65 (-0.95%). This marks the lowest close in 72 sessions (106 days), dragging the index back to levels last seen on October 8, 2025.
🛡 5 Min Intraday Chart with Levels
🛡 Intraday Walk
Today was a session of systematic distribution.
The morning’s 100-point “tug-of-war” served as a distribution phase before the floodgates opened. Once the 25,250 floor was lost, the slide was relentless.
The most significant technical event was the daily close below the channel’s bottom band. While the Jan 21 low of 24,920 still stands as the final line of defense, today’s close has significantly weakened the reversal thesis, shifting the focus toward a potential bearish continuation.
📉 Daily Time Frame Chart with Intraday Levels
🕯 Daily Candle Breakdown
Open: 25,344.60
High: 25,347.95
Low: 25,025.30
Close: 25,048.65
Change: -241.25 (-0.95%)
🏗️ Structure Breakdown
Type: Strong Bearish candle (Marubozu-style).
Range: ≈ 323 points — High intraday volatility.
Body: ≈ 296 points — Aggressive, unchecked selling pressure.
Upper Wick: ≈ 3 points — Absolute lack of buying strength at the open.
Lower Wick: ≈ 23 points — Minimal demand even at the extreme lows.
📚 Interpretation
This is a high-conviction Bearish Breakdown candle. Opening at the day’s high and closing near the day’s low suggests that the market is in a “Sell on Rise” mode. The breach of the 106-day closing low indicates that the medium-term trend has been severely damaged, and the previous recovery attempts are being invalidated.
🕯 Candle Type
Bearish Marubozu-Style / Breakdown Candle — Signals powerful downside momentum; further weakness is expected unless the index reclaims the channel bottom immediately.
🛡 5 Min Intraday Chart
⚔️ Gladiator Strategy Update
ATR: 256.30
IB Range: 98.85 → Medium
Market Structure: Balanced
Trade Highlights:
10:18 Long Trade: SL Hit (Caught in the morning battle whipsaw).
11:38 Short Trade: Target Hit (R:R 1:1.73) (IBL Breakout).
13:16 Short Trade: Target Hit (R:R 1:3.03) (PDL Breakout).
Trade Summary: A disciplined performance despite the early stop-loss. The strategy correctly pivoted to the short side as the balance shifted. The PDL breakout trade was the star of the session, capturing the vertical drop to the 25,060 support zone with a strong 1:3.03 R:R.
🧱 Support & Resistance Levels
Resistance Zones:
25180
25270
25310 ~ 25335
25430
Support Zones:
25025 ~ 25000
24970
24920 (Critical Floor)
24840
24770 ~ 24740
🧠 Final Thoughts
“The 24,920 level is now the only shield left.”
The daily close below the channel is a major red flag.
If the 24,920 low is breached in the upcoming sessions, the bullish reversal sign from January 21 will be completely negated.
At that point, the structure will confirm a bearish continuation with targets shifting toward the 24,600 ~ 24,400 zone. Until then, expect the bears to maintain their grip, using every minor bounce as a supply window.
✏️ Disclaimer
This is just my personal viewpoint. Always consult your financial advisor before taking any action.

Tanla Platforms – Long-Term Elliott Wave PerspectiveTanla Platforms – Long-Term Elliott Wave Perspective
Tanla Platforms appears to have completed a full impulsive structure from the 2013 low, followed by a higher-degree corrective phase. The decline from the 2021 peak is unfolding as a complex W–X–Y correction, where wave (W) ended near the 2023 low, wave (X) formed a downward-sloping corrective structure, and the current leg is developing as wave (Y) . Price has recently tested the 0.786 Fibonacci retracement (~450–460 zone), which is a typical termination area for wave (2) or wave (Y) in a corrective setup.
Structurally, the ongoing decline shows an A–B–C internal formation, and a decisive break and sustain above 771 would confirm completion of the corrective phase and signal the start of a higher-degree impulsive move. Upon confirmation, the projected path suggests wave (3) unfolding toward previous all-time highs and beyond, in line with Elliott Wave guidelines of wave expansion. Momentum (RSI) remains subdued, supporting the view that the market is still in a basing/transition phase rather than a confirmed uptrend.
⚠️ Disclaimer
This analysis is based solely on Elliott Wave theory , price structure, and Fibonacci relationships and represents a personal market view. It is not financial advice. Markets are subject to risk and uncertainty. Always confirm with price action, volume, and your own risk management before taking any trade. The author is not responsible for any profit or loss arising from the use of this analysis.

nifty for 23.01.2026today nifty stayed confused with buyers and sellers fighting for dominance. the session ended on a bullish note, but momentum still needs liquidity support. a gap down opening below 25150 may set up an interesting trading opportunity.

Nifty: Buyers Are Back — Preparation Phase in ProgressSo today NSE:NIFTY played out exactly the way we planned yesterday.
Now if you look closely at today’s Nifty candle, the body is red but the volume label clearly shows buyers’ dominance.
Buyers’ volume is higher by 13.9 million. This tells us that today’s bounce was not short covering. It was genuine buying buildup from lower levels.
The Pivot has also moved up, which means liquidity from the lower zone has been absorbed.
That said, this is still a preparation phase, not confirmation. Overconfidence here would be a mistake.
If the index decisively crosses 25349, then we can expect a sharp bullish move with an upside target near 25666.
Immediate support stands at 25298.
Positional support is at 25245. As long as this zone holds, the structure remains constructive.
Sectors showing bullish buildup are Banks, Finance, FMCG, and PSU Defence.
For now, let the market confirm. React to levels, not expectations.
📊 Levels at a glance:
Resistance: 25349
Upside target: 25666
Immediate support: 25298
Positional support: 25245
Bias: Cautiously bullish, wait for confirmation
Sector focus: NSE:BANKNIFTY , NSE:CNXFINANCE , NSE:CNXFMCG , NSE:NIFTY_IND_DEFENCE
That’s all I can say with the data available today. Take care. Have a profitable tomorrow.

BTR delivers +50 points | 22 JAN 2026 | BSE LTD🔥BTR delivers +50 points | 22 JAN 2026 | BSE LTD 🔥
Live trade shared in advance.
End of day = CLEAR +50 POINTS PROFIT ✅
No noise. No emotion. Only BTR Price Action.
👉 Follow for LIVE trading setups
💰 +50 POINTS DONE & DUSTED | BTR POWER 💰
22 Jan 2026 — Live setup → Clean execution → 50 POINTS PROFIT
This is what discipline + structure looks like.
📌 Follow BTR for real-time trade setups
🚀 BTR HITS +50 POINTS TODAY (LIVE TRADE) 🚀
Setup shared live.
Market respected BTR levels.
End result = +50 POINTS PROFIT 🔥
Trade less. Trade smarter.
➡️ Follow for daily live setups
📊 FROM LIVE SETUP TO +50 POINTS PROFIT 📊
22 Jan 2026
BTR Price Action Indicator → Accurate entry & clean exit
No overtrading. No guesswork.
💥 +50 POINTS BANKED
🧠 PROOF > PROMISES | +50 POINTS WITH BTR 🧠
Live trade shared in the morning.
End of day result: +50 POINTS PROFIT ✅
Consistency beats prediction.
🔔 Follow for live BTR trade setups

NIFTY 50Today was a blood bath in broader market, but the good thing is nifty has completed its retracement.
As I mentioned earlier as well on 2nd Jan 2026 when everyone was saying that Nifty broke all time high I said its not high till white trendline is broken.
Now again I would say NIFTY IS AT ITS SUPPORT and could bounce back from here for making a new ATH
In case it breaks there is support of Green trendline also
Therefore, low risk High reward trade

Happy Diwali 2026! Nifty @ 28000Nifty is Currently at 25232 as on today ie 29th Jan 2026
I see Nifty to go further low till 24500 - 24800 and find it support there before Budget
after Budget it should start a new journey and if it this time breaks the resistance of 26250 - 26500 then it should be near 28000 on around 6th Nov 2026 which is Diwali 2026!
How can i see this?
1. Before Budget IV is to go up and the best way for IV to increase is Market to fall which is happening
2. FII are net sellers since last 1 year now, They have invested heavily in Gold, Silver, Dolor, US, China ect ect.
3. its time for FII honeymoon to get over with silver and gold so they should start coming back
4. Budget is going to be good as planning is for exception of income tax from 12Lac - 17lac and if it is closed @ 15 lac it also should be a good factor
5. if we see technically, we can find the monthly EMA 20 @ 24500 and also there is a monthly demand zone there. If we can see a Parallel upward channel it also indicate for nifty to reach 28000 and then 30000
6. on monthly time frame there is a very nice breakout expected @ 26250 - 26500 which is in formation since sept 2024 its like a cup and handle pattern.
so, I am going to wait and let Nifty take a Support @ 24500 - 24800 and then once i get a buliish signal on 75min time frame I will go long with nifty till 28000 with Hedges on and off
Happy Diwali 2026! (Nifty @ 28000_

Nifty Short & Medium Term Support&Resistance_19-Jan-26 to 23-JanNifty 25694 (last week 25683 )(Last week 26328)
Nifty dipped upto 25473 last week (near to major support mentioned 25420 mentioned in last week report) due to global tension related to US- Greenland, Iran internal riots, US-Iran & China- Taiwan issue continuing for last two weeks.
Nifty touched 25623 and bounced back to 25694 ( Closed above 2nd Short term Support 25670 provided for last few weeks). Market expected to go sideways consoldiation or dip furthermore till the major support provided( 25300-25420) in the coming week but there is good short term support are there for indian market as mentioned below. Hence the broad movement will be between 25300-26000. It will be good opportunity for bottom fish the stocks and to buy mutual funds if it dips.
As far as India is concerned, economy is moderate, Q3 results are slowly coming out. public sector banks like union bank, punjab sind, Federal & IOB posted good results. Reliance moderate 1% up, hdfc bank posted 12% up, ICICI bank -3%, IDBI Bank is flat, Yes Bank is up but sales and EBIT are negative, South indian bank 9%, Infosys 11%, wipro -7% and Tech Mah 33%, Polycab 36%, HDB Fin Services 36% , HDFC Life -1% and ICICI Pru Life 12% and ICICI AMC 45% up and budget for 2026-27 to be proposed on Ist Feb 2026. So far Q3 results are Mixed.
Other Q3 Results and 1St Feb Budget will take the market to next level.
Since it is a Volatile situation SIP route or buy in multiple parcel route (On Dips) with a goal of 3-5 years ( Medium to Long term) will workout.
Considering the global situation, diversify the portfolio with Debt and liquid fund ( approx 20-30% portfolio) and 10-20% in Gold & Silver for Year 2026, this funds ( especially liquid funds will create funds availability for further buying opportunity incase of market dips like a Systematic transfer plan.
Some of the stocks to watchout given last week are HDFC AMC, NMDC, Apar, Sharda Crop, VRL Logistics, krishna Phos chem, Cipla, Dr Reddy, Natco pharma, Apl Apollo Tubes, Muthoot Finance ( On Dips) , tata Steel ( Contra Stock due to Business Cycle), Bank of Mah, BPCL, CG Power, hero motor, shriram finance and NRB bearings. Shared for Analysis purpose only. Dr Reddy, shriram fin, natco pharma, Hero moto corp,Muthoot Finance have already given more than 10% return in this 1 month,HPCL, BPCL, IOCL, Carysil, MAS Financial Services and BSE . Waaree Energies had an IT raid in its premises in Mid of Nov 2025. Outcome will take the stock forward.
New stocks proposed for watchout for 29-Dec-25 to 02-Jan-26 is Indian Bank and NBCC, buy on dip as market in volatile situation. Both stocks reduced further and in buyable range.
New Stocks ( to watchout For Jan Ist Week 2026) are ITC & Lupin.
For 18-Jan-26, after Q3 Results HDFC AMC ( already provided in the call above), Poly cab, union bank, Tech Mah, Infosys are some of the picks for Watchlist.
All the above stocks can be considered slowly ( as multiple parcels) in case of stock price has fallen.
RSI, MACD, Stochastic all indicators are in oversold situation and caution to be emphasized till each indicators move past its respective signal.
Nifty Short Term Supports (Multiple Supports are there between 25000-25500):
25670 (Jun 2025 High)
25360-25420 ( Sep high and trendline support as shown in chart)
25300-25350 (Two Fibonacci resistance shown ) - Major Support
Hence 25300- 25420 acts as major short term support.
25500 ( 25441 Sep 18th 2025 High )
25450 ( 25442 is the Aug 2025 high)
25200 ( 25154 Aug 2025 high)
25000 ( Milestone)
Short Term Resistance
1.26329 ( All time High)
2. 26500
3. 26700 ( Finonacci 1.618 as shown in graph)
Medium Term Support:
1.24700 (Trend Line as shown)
2. 24000-24170 (Fibonacci Retracements Supports- Two Supports in this zone 24116 & 24171 as shown)
3. 23500-23700 (Fibonacci Retracements Supports- Two Supports in this zone 23608 & 23707 as shown)
2. 23000
Medium Term Resistance:
1.27000 ( Need to decisively break 26269 all time high) This resistance is based on Fibonacci resistance at 27034
Long term resistance:
1.28000 ( Need to decisively break and move up 27000)This resistance is based on Fibonacci resistance at 28106
Long Term Support
1.22700-23000 ( Trend line and Mar 2024 High)
2.Big support at 20000 (Sep 2023 high)

NIFTY 50 | 1H | BTR Price Action –LONG TRADE ACTIVE📊 NIFTY 50 | 1H | BTR Price Action – TRADE ACTIVE
BTR Price Action Indicator has generated a LONG signal on NIFTY 50 (1-Hour timeframe) after a strong bearish move and momentum shift.
🔹 Market Context
Strong downside move followed by price stabilization
Bullish reaction from demand zone
Momentum candle confirms short-term trend shift
🔹 Trade Plan (As marked on chart)
Entry: On BTR Buy Signal
Stop Loss: Below recent swing low
Target 1: Near previous resistance zone
Target 2: Higher resistance / supply area
🔹 Execution Logic
This setup is based purely on price action + structure, with risk clearly defined. Partial profit booking near Target-1 is preferred, and trade management is key if volatility increases.
⚠️ This is a live market view, not a prediction.
⚠️ Always follow proper risk management.
NSE:NIFTY

BTR Update | 16 Jan 2026 |+30 POINTS PROFIT | BSE LTD📉 BTR Update | 16 Jan 2026 | Clean Short Trade
Stock: BSE LTD
Timeframe: Intraday
Indicator: BTR Price Action
🔴 Trade Execution
Signal: Short
Entry: 2840
Exit: 2810
Points Gained: +30 Points
🧠 Why This Trade Worked
✔ Clear trend confirmation
✔ No overthinking
✔ No early exit
✔ No revenge trade
✔ Followed BTR rules step by step
This was a textbook BTR short —
clean entry, clean exit, zero emotion.
📌 Key Message
❝ Profits don’t come from prediction,
they come from discipline & execution. ❞
BTR doesn’t chase price.
BTR waits for structure.
When signal appears — action is simple.

nifty 14.01.2026nifty price action is extremely volatile in this expiry week. ahead of tomorrows sensex expiry expiry, nifty has formed a wide 250-points range. upside resistance is placed around 25800-25830, while downside support lies near 25550-25580. a strong directional move is expected only after a clear breakout from this range.

BTR Price Action Indicator –Trade on NIFTY 50 600 POINTS DONE🔥 BTR Price Action Indicator – First Ever Trade on NIFTY 50 (1H) | 600 POINTS DONE 🔥
For the first time, we applied the BTR Price Action Indicator on the NIFTY 50 Index (Hourly timeframe) — and the result was nothing short of PERFECT. 🎯
📉 BTR Generated Short Signal at 26,170
The market respected pure price action, and BTR guided the trade step-by-step with precision.
✅ Trade Breakdown (Premium Setup):
Entry: 26,170 (BTR Short Signal)
Target 1: +200 points ✔️
Target 2: +400 points ✔️
Target 3: +600 points ✔️
Final Exit: 25,570
📊 Total Gain: 600 POINTS in a single directional move
💎 No guesswork. No overtrading. Only clean price action.
🔥 BTR Price Action Indicator – First Ever Trade on NIFTY 50 (1H) | 600 POINTS DONE 🔥
For the first time, we applied the BTR Price Action Indicator on the NIFTY 50 Index (Hourly timeframe) — and the result was nothing short of PERFECT. 🎯
📉 BTR Generated Short Signal at 26,170
The market respected pure price action, and BTR guided the trade step-by-step with precision.
✅ Trade Breakdown (Premium Setup):
Entry: 26,170 (BTR Short Signal)
Target 1: +200 points ✔️
Target 2: +400 points ✔️
Target 3: +600 points ✔️
Final Exit: 25,570
📊 Total Gain: 600 POINTS in a single directional move
💎 No guesswork. No overtrading. Only clean price action.
⚠️ Educational purpose only. Trade with proper risk management.
BTR – Let Price Action Do the Talking. 📈 NSE:NIFTY

Nifty Analysis EOD – January 12, 2026 – Monday🟢 Nifty Analysis EOD – January 12, 2026 – Monday 🔴
The Phoenix Recovery: Bulls Resurrect Nifty with 340-Point V-Shape Swing!
🗞 Nifty Summary
After hitting multi-month lows, the Nifty performed a spectacular “Phoenix Recovery.”
The session started flat but quickly turned into a bloodbath as the index plunged 172 points to find initial support at 25,530. A symmetrical triangle formed near the lows, eventually breaking down to test the 25,473 level.
However, as noted in previous sessions, the market was deeply oversold. Fueled by short covering and potential positive news, Nifty executed a vertical reversal, reclaiming the 25,750 ~ 25,780 resistance zone with ease.
The index closed at 25,790.25 (with intraday highs hitting 25,806.10), effectively wiping out the morning panic and signaling a powerful structural reversal.
🛡 5 Min Intraday Chart with Levels
🛡 Intraday Walk
The day was a tale of two halves. The morning belonged to the bears, who exploited the initial flat open to drive a high-velocity sell-off toward the 25,470 zone.
The symmetrical triangle breakdown looked like a final flush-out of weak hands. The afternoon, however, saw one of the sharpest recoveries in recent history.
The vertical ascent crossed the 25,750 barrier without any significant pullback, leaving late-entry bears trapped at the bottom.
The close near the day’s high confirms that the “oversold” spring has finally uncoiled.
📉 Daily Time Frame Chart with Intraday Levels
🕯 Daily Candle Breakdown
Open: 25,669.05
High: 25,813.15
Low: 25,473.40
Close: 25,790.25
Change: +106.95 (+0.42%)
🏗️ Structure Breakdown
Type: Bullish Rejection Candle.
Range (High–Low): ≈ 340 points — extreme intraday volatility.
Body: ≈ 121 points — reflecting strong bullish participation in the second half.
Upper Wick: ≈ 196 points — massive rejection of lower prices, signaling a potential bottom.
Lower Wick: ≈ 23 points — minimal resistance at the close.
📚 Interpretation
The massive lower wick (nearly 200 points) is a classic “Hammer” signal appearing after a prolonged downtrend. It indicates that supply has been exhausted and demand has aggressively returned. The close above the opening price, despite the deep early plunge, is a high-conviction signal that the short-term sentiment has flipped from “Sell on Rise” to “Buy on Dip.”
🕯 Candle Type
Bullish Rejection / Hammer-Like Recovery Candle — Traditionally marks the end of a bearish sequence; follow-through above 25,820 is now critical.
🛡 5 Min Intraday Chart
⚔️ Gladiator Strategy Update
ATR: 204.84
IB Range: 171.90 → Medium
Market Structure: ImBalanced
Trade Highlights:
10:58 Short Trade: Target Hit (R:R 1:1.71) (Symmetrical Triangle Breakout)
12:04 Long Trade: Target Hit (R:R 1:6.34) (Trendline Breakout)
Trade Summary: A legendary day for the Gladiator Strategy. While the morning short trade captured the final flush-out, the 12:04 PM Long signal on the trendline breakout was the star performer. It captured the entire V-shape reversal, delivering a massive 1:6.34 R:R as Nifty relentlessly marched toward the day’s high
🧱 Support & Resistance Levels
Resistance Zones:
25820
25855 ~ 25880
25940 (Crucial)
Support Zones:
25600
25550
25475
🧠 Final Thoughts
“The bulls have found their spine.”
Technically, this is a perfect reversal setup, but caution is still the word of the day.
I am staying neutral-to-bullish but will remain cautious until we get a decisive daily close above 25,940. As for the weekend “Trump Fate,” it seems the market decided not to wait for a tweet to start the recovery! Let’s see if he provides the “HUGE” momentum needed to cross the 26K hurdle again, or if this was just a short-covering bounce. For now, let’s watch the opening tick tomorrow with a smile.
✏️ Disclaimer
This is just my personal viewpoint. Always consult your financial advisor before taking any action.

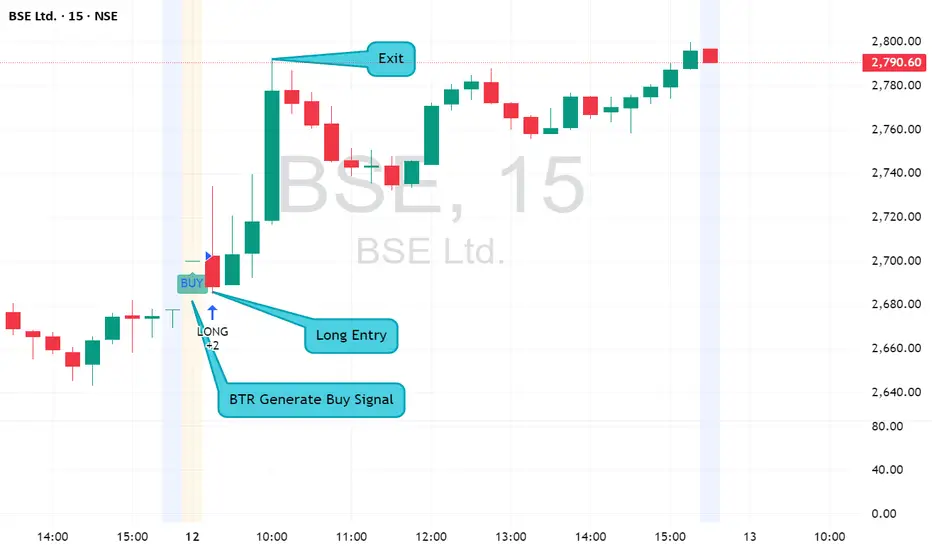
BTR Perfect Trade in BSE LTD| +100 Points in Just 4 Candles🚀 BTR Perfect Trade | +100 Points in Just 4 Candles
Stock: BSE LTD
Timeframe: Intraday
Indicator: BTR Price Action
🔔 Trade Details
Signal: 🟢 Buy (Long)
Entry: 2690
Exit: 2790
Points Captured: 🔥 +100 Points
Time Taken: Only 4 Candles
📈 Why This Trade Was Special
✔ Clean trend initiation
✔ Strong momentum confirmation
✔ No whipsaw, no noise
✔ Fast move → quick profit
✔ Textbook BTR execution
This is exactly how price action + structure should behave when the trend is real.
🧠 BTR Logic in Action
Entry came after confirmation, not anticipation
Exit respected target / structure, not greed
Trade delivered high reward in short time
❝ You don’t need many trades —
you need the right trade. ❞
📊 Market Insight
After several volatile and loss-recovery days,
BTR waited patiently and then attacked with precision.
This trade alone:
Covered previous losses
Restored confidence
Reinforced trust in the system
✅ Trader’s Discipline Checklist
NSE:BSE
✔ Followed signal
✔ No early exit
✔ No overtrading
✔ Let profits run
📍 Follow for Daily BTR Price Action Updates
📊 Indicator available in my profile → Scripts section
💬 DM for intraday & option trading guidance with BTR