Banknifty looks very interesting for the next week - check out!We anticipated the trapping on October 22nd when profit booking started building up and the market refused to give any pullback.
Refer the commentary of 22nd October.
On Friday, NSE:NIFTY closed below its first support, which was mentioned at 25800.
However, that candle was a clear shakeout — not a full bearish one.
Hence, the approach should be to buy near support when the index shows signs of a bounce. The first support stands at 25666 and the next one at 25525.
Resistance is placed at 25800–25850. Any bounce that fails to sustain above this zone should be treated as a sell-on-rise opportunity — unless the bounce happens from the mentioned supports.
Plus, the trend is currently gone Orange. Wait for it to turn Green again before going all in.
The good part is that the major trend still remains bullish, and this dip looks like a healthy opportunity to add longs near supports.
One thing to note: while long-term breadth continues to improve slowly, short-term breadth has started to slip. So, expect some short-term volatility in large-cap stocks.
NSE:BANKNIFTY 's Friday candle looks very interesting — a classic example of liquidity buildup with a shakeout.
Even though the candle looks deep bearish, buyers’ volume exceeded sellers’ by nearly 40 million. 🔥🎯
However, since the price action still shows a bearish tone, we should wait for confirmation of a reversal from the support at 57600. The next support lies at 57200.
Sectors that look good for next week are #Banks and NSE:NIFTY_IND_DEFENCE
📊Levels at a glance:
Nifty Support: 25666 / 25525
Nifty Resistance: 25800 / 25850
BankNifty Support: 57600 / 57200
Bias: Bullish major trend, short-term volatility expected
Sectors to watch: Banks, Defence
Strategy: Buy near support on bounce, sell on rise if resistance holds
That’s all for the day. Take care and have a profitable tomorrow.
Niftyprediction

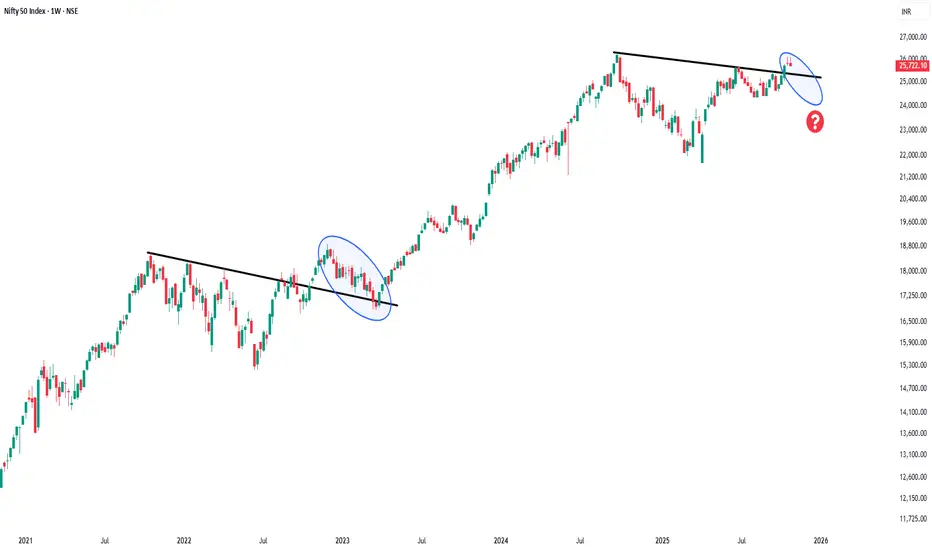
Will history repeat this time ?Previously nifty after breakout retest its support . Will history repeatthis time ?
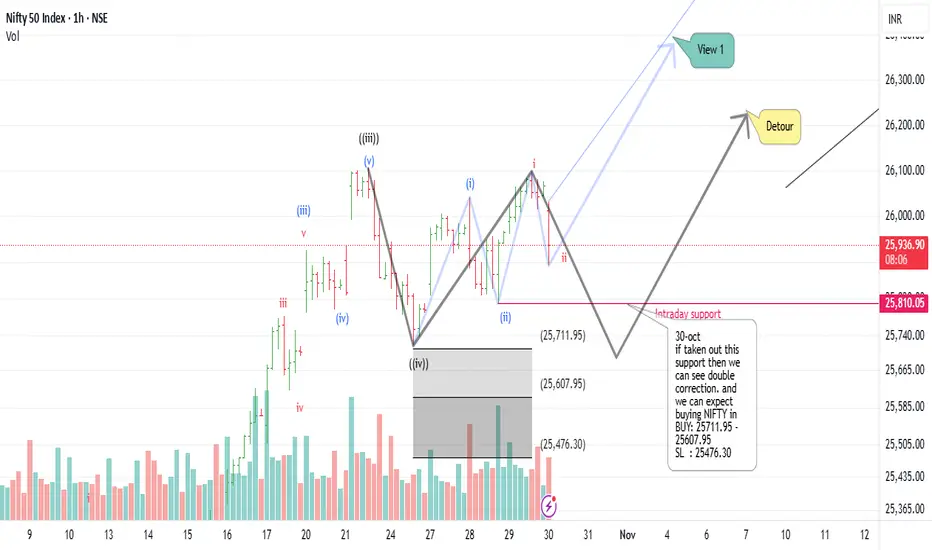
Nifty Intraday DetourIncase Nifty doesn't hold 25810 then will have to tweak the wave count and expect Nifty to correct upto 25712-25476. If that happens then we will plan to buy in Range of 25712-25608 and keep stop loss for 25476
Nifty’s candle today looks quite interesting!Nifty’s candle today looks quite interesting.
The color is red. The volume belongs to buyers. And it’s a clear shakeout.
Even with such a big red candle, buyers’ volume was 12 million higher than sellers, and the collective volume was higher too — so what’s really going on here?
It’s simple — accumulation. Bulls are still strong and active.
This pullback is just normal profit booking, which was already expected after the recent rally.
Pivot sits at 25918 and support is at 25800.
If NSE:NIFTY bounces from the support and sustains above the pivot, it can move up to 26100. But if the support breaks, the pullback could extend toward 25669.
No matter how deep the pullback goes on the index, stock-level buildup continues — which means this is a great opportunity for cash traders to pick strong short-term stocks.
Long-term breadth is improving faster than the short-term trend, showing broader strength.
Intraday breadth ratio stood at 0.76 today — negative for the second consecutive session. Until it turns positive, it’s better to avoid intraday trading.
On the sectoral side, NSE:CNXIT showed clear buildup today, and NSE:NIFTY_CONSR_DURBL stocks also displayed good momentum.
📊Levels at a glance:
Pivot: 25918
Support: 25800 (break = dip to 25669)
Resistance: 26100 (bounce target)
Market Breadth Ratio (intraday): 0.76 (negative)
Bias: Accumulation phase, healthy pullback
Sectors to watch: IT, Consumer Discretionary
That’s all for the day. Take care and have a profitable tomorrow.

Nifty Short & Medium Term Support&Resistance_30-Oct to 7-Nov-25Nifty Short & Medium Term Support&Resistance_30-Oct to 7-Nov-25
Nifty 25909
Long call ( Buy) was given three weeks before at 24896, Nifty crossed 26000 last week and this week.
Recently china was announced 100% additional tarrif for rare earth restriction by china, but after meeting XI, trump reduced current tarrif from 57% to 47%
Quarterly results of company released so far are average expecting GST 2.0 and festive sale to boost in Q3, HDFC Bank posted 10% profit, ICICI Bank posted 5% profit, Reliance posted 10% profit.
HDFC AMC, Persistent Systems,Dixon, Waaree Energies, Waaree Renewables, KEI, Polycab, Havells, Indian Renewable, NMDC, Bank of Mah, ICICI Lombard and ICICI Pru posted good results. Few stocks are already gone up and PE is high.
Overall, the Qtrly Results and Tariffs deal will decide the future path of the Nifty. Since it is a Volatile situation SIP route or buy in multiple parcel route with a goal of 3-5 years will workout.
Pending Qtrly results and Tarriff Deal ill take the Index Further.
Hence the strategy can be shifted to long considering medium to long and use the opportunity to buy on dips similar to SIP.
Current Short Term Resistance are 26000 and 26269 ( all time high). It need to break the resistance 26269 decisively to move up to 27000 target in med-long term.
Nifty Short Term Supports ( Multiple Supports are there between 25000-25670):
1.25900 ( Trend line support)
2. 25670 ( Jun 2025 High) Should cross this resistance in short term decisively inorder to move up.
3. 25500 ( 25441 Sep 18th 2025 High )
4.25450 ( 25442 is the Aug 2025 high)
5.25350 ( Fibonacci resistance shown )
6.25200 ( 25154 Aug 2025 high)
7.25000 ( Milestone)
Short Term Resistance
1.26098 ( Recent last week high)
2.26269 ( All time High)
Medium Term Support:
1.24700 (Trend Line as shown)
2. 24000-24170 (Fibonacci Retracements Supports- Two Supports in this zone 24116 & 24171 as shown)
3. 23500-23700 (Fibonacci Retracements Supports- Two Supports in this zone 23608 & 23707 as shown)
2. 23000
Medium Term Resistance:
1.27000 ( Need to decisively break 26269 all time high) This resistance is based on Fibonacci resistance at 27034
Long term resistance:
1.28000 ( Need to decisively break and move up 27000)This resistance is based on Fibonacci resistance at 28106
Long Term Support
1.22700-23000 ( Trend line and Mar 2024 High)
2.Big support at 20000 (Sep 2023 high)

ALLCARGO MAKING STRONG BASE FOR HUGE BREAKOUT SOONAllcargo Logistics operates as a global integrated logistics solutions provider, specializing in multimodal transport, container freight stations, contract logistics, and project cargo. It plays a pivotal role in global trade, with a presence in over 180 countries.
Yes, Allcargo Logistics is showing signs of short-term strength. The stock is currently trading around 33.30, slightly above key pivot and resistance levels , a VCP pattern is emerging and waiting for full confirmation ,
- 📈 Bullish trigger: Sustained close above 33.76 (100-day EMA) with volume
- 📉 Bearish risk: Breakdown below 31.20 could invite further downside
short to mid term it may show good upside as risk and reward ratio looking good at current levels .

Nifty Reversal Zones for 29 OCT 2025Nifty reversal zones for intraday, usually these area/zone act as supply or demand areas, Price tend to take support or rejections from these area's also these areas are good only for 29 OCT 2025, There are 2 Zone types Major and Minor, Major to target big trends and minor to target small trends and can be used for scalping

United Spirits Limited chart analysis: BUY Setup Entry: ₹1,359-1,365 (Current Level)
Target 1: ₹1,393-1,400
Target 2: ₹1,420-1,425
Target 3: ₹1,450+ (Extended)
Stop Loss: ₹1,338

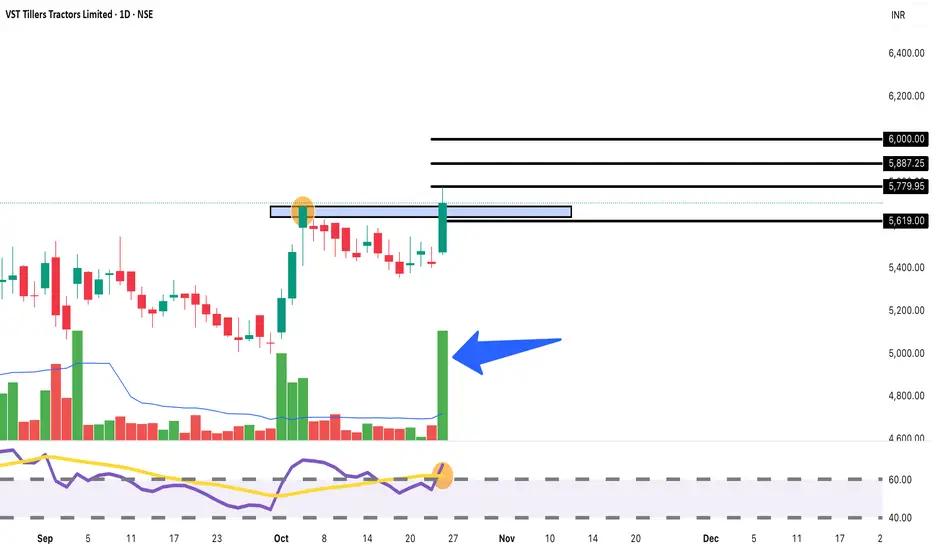
VST Tillers: Explosive Volume Breakout! Target 5,900+BUY Setup 🚜
Entry: ₹5,703-5,720 (Current Level)
Target 1: ₹5,779-5,800
Target 2: ₹5,887-5,900
Target 3: ₹6,000+ (Extended)
Stop Loss: ₹5,620
Technical Rationale:
Massive volume spike (8.71K) - highest in recent period, highlighted with blue arrow
Strong bullish momentum with +5.23% surge today
Breaking out from consolidation range (5,460-5,700)
Price moving above resistance zone marked at 5,700
Rounding bottom formation visible - classic bullish reversal
RSI around 65, showing strength with room for upside
Volume confirmation is exceptional - institutional buying evident
Agricultural/tractor sector showing renewed interest
Two major resistance levels clearly marked at 5,779 and 5,887
Support established at breakout zone (5,650-5,680)
Risk-Reward: Strong 1:3+ ratio
Pattern: Rounding bottom breakout with exceptional volume - highly reliable bullish signal
Strategy: Short to medium-term swing - Book 30% at T1 (5,790), 30% at T2 (5,890), trail remaining with SL at 5,720 after T1
Key Catalysts:
Volume explosion indicating smart money accumulation
Agricultural sector tailwinds
Festive season demand
Key Levels:
Strong Resistance: 5,779, 5,887
Support: 5,650, 5,620, 5,600
education purpose only
NIFTY | Twin Bullish Patterns Signaling Market ConfidenceNIFTY | Dual Bullish Pattern on 15-Minute Timeframe
This is the 15-minute timeframe chart of NIFTY.
NIFTY is currently forming two bullish patterns — a triangle pattern and a falling flag pattern.
If the triangle pattern support breaks, the next strong support lies near the ₹25,550–₹25,600 zone, aligned with the lower boundary of the falling flag.
As long as this support zone holds, NIFTY is likely to resume its upward momentum, potentially heading toward a new high in the ₹26,250–₹26,300 range.
Thank You !!

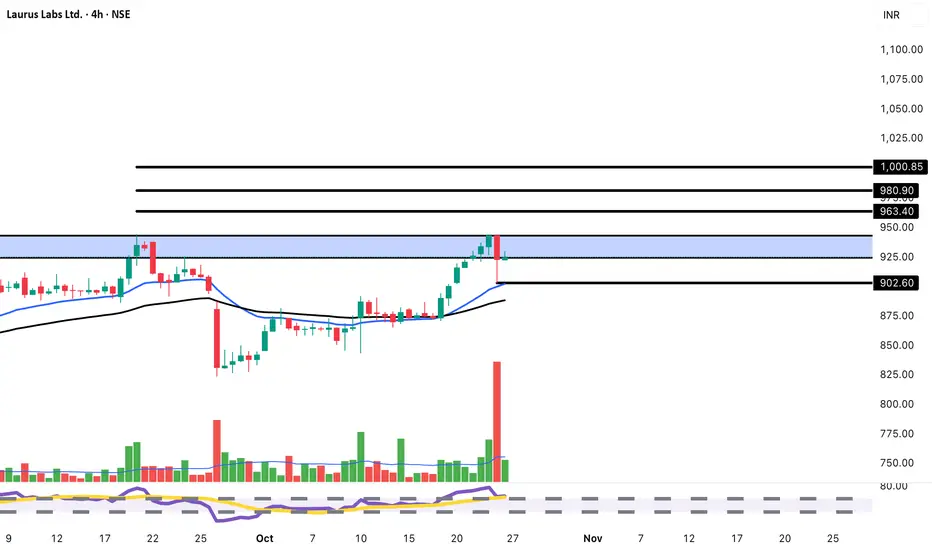
LAURUSLABS: 4H Chart Reversal | Target 980-1,000BUY Setup 💊
Entry: ₹924-930 (Current Level)
Target 1: ₹963-970
Target 2: ₹980-990
Target 3: ₹1,000+ (Extended)
Stop Loss: ₹902
Technical Rationale:
Breaking above key resistance at 925 level with momentum
Strong recovery from recent dip with +0.24% gain
4-hour chart showing bullish reversal pattern
Price reclaiming position above both EMAs
W-pattern (double bottom) formation visible - bullish reversal
RSI trending upward around 70, showing momentum
Volume at 1.35M supporting the breakout
Clear support established at 902 level
Multiple resistance levels: 950, 963, 980, 1,000
Pharma sector showing resilience
Breaking above previous high at 950 zone
Risk-Reward: Good 1:3+ ratio
Pattern: Double bottom/W-pattern breakout - classic bullish reversal on 4H timeframe
Strategy: Intraday to short-term swing - Book 35% at T1 (965), 35% at T2 (985), trail remaining with SL at 930 after T1
Key Levels:
Breakout Zone: 925 (now support)
Strong Resistance: 950, 963, 980, 1,000
Critical Support: 902, 875
For educational purposes only. Not SEBI registered. 4H chart analysis for short-term trades. Watch 902 support closely. Conduct your own research before investing.
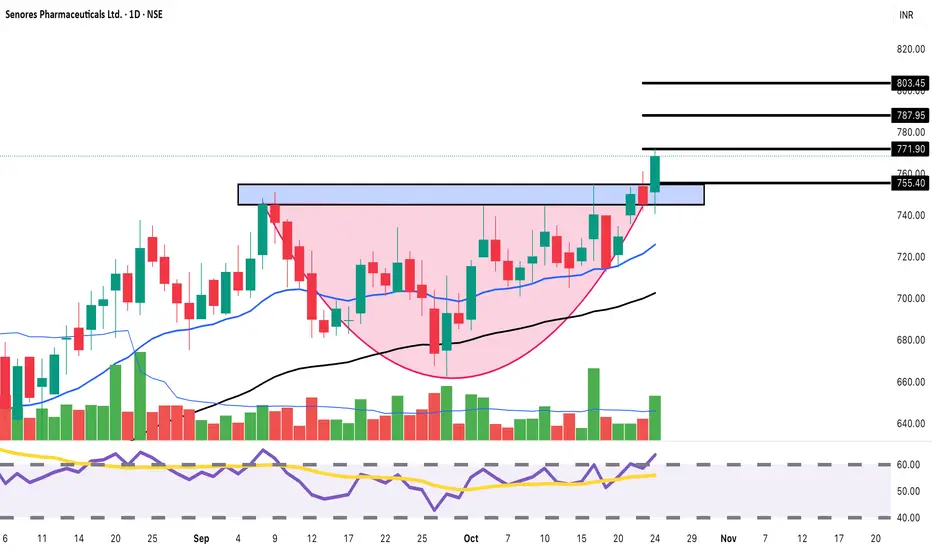
Senores Pharma: Cup & Handle Breakout! Target 803+BUY Setup 💊
Entry: ₹768-775 (Current Level)
Target 1: ₹787-795
Target 2: ₹803-810
Target 3: ₹830+ (Extended)
Stop Loss: ₹752
Technical Rationale:
Powerful breakout from rectangular consolidation (740-770)
Strong bullish momentum with +3.10% surge today
Breaking above resistance zone with conviction
Cup and Handle pattern visible - classic bullish continuation
Price breaking above descending trendline (pink shaded area)
Rising above both EMAs indicating trend reversal
High volume (378.97K) confirming breakout strength
RSI spiking above 60, showing momentum building
Clear support established at 755-760 level
Multiple resistance levels marked: 771, 787, 803
Ascending triangle formation breakout
Risk-Reward: Excellent 1:3+ ratio
Pattern: Cup & Handle + Ascending Triangle breakout - highly reliable bullish signals combined
Strategy: Short to medium-term swing - Book 30% at T1 (790), 35% at T2 (805), trail remaining with SL at 770 after T1
Key Levels:
Breakout Zone: 771 (now support)
Strong Resistance: 787, 803
Support: 755, 752, 740
Sector: Pharma sector showing strength amid market volatility
For educational purposes only. Not SEBI registered. Multiple bullish patterns converging - strong setup but manage risk. Conduct your own research before investing.Retry
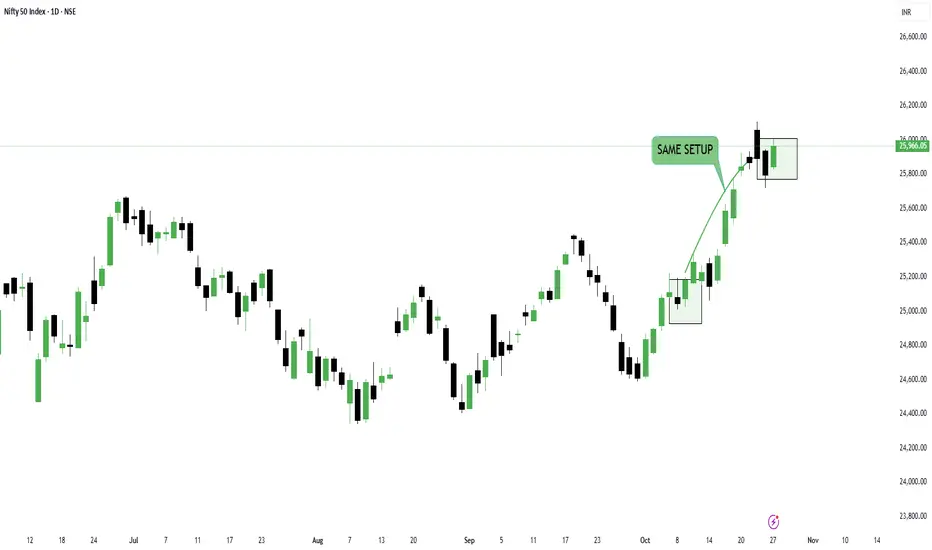
Buyers dominating Nifty ready to break all time high?Friday’s candle was a shakeout, and today that shakeout got completely absorbed.
This is the same combination we caught on October 8-9.
But note this — the recent five candles have continuously been signaling profit-booking levels, meaning the index could give a dip anytime.
Also, the October 9 candle had a clear pivot low, which today’s candle doesn’t have — that’s worth noticing.
However, the short-term undertone still remains bullish. Institutions are buying every dip, and that’s why we aren’t seeing any sharp pullback.
Today, buyers’ volume in #Nifty was higher by nearly 50 million compared to sellers, which should reflect tomorrow.
The PP is tight, which means the upcoming move will be sharp.
Which direction? That will depend on which level breaks first.
For tomorrow, resistance will be 26135 and support will be 25900.
Now, if we talk about market breadth — the ratio stands at 1.08, which clearly shows that buildup has started in the broader market.
That means the stocks in your portfolio should start moving now.
If they’re still not performing, it’s time to replace the inactive ones.
Dump the laggards and ride the trend.
On the sectoral front, the strongest momentum is visible in Auto Parts and Finance.
Overall, the market looks positive for tomorrow, but risk management remains equally important.
---
Levels at a glance:📊
Pivot: Tight (sharp move expected)
Support: 25900
Resistance: 26135
Market Breadth Ratio: 1.08 (broader buildup visible)
Bias: Short-term bullish, institutions buying dips
Sectors to watch: Auto Parts, Finance
Strategy: Replace inactive stocks and ride the trend
That’s all for today. Take care and have a profitable tomorrow.
Nifty Analysis EOD – October 27, 2025 – Monday🟢 Nifty Analysis EOD – October 27, 2025 – Monday 🔴
Bulls return after the festive break, eyeing 26,000 with renewed strength
Diwali Greetings and Happy New Year to all Indian followers! ✨
After a long Diwali vacation with family, I’m finally back at the desk. Although I was tracking and trading daily, I couldn’t find time to write notes.
During the holiday stretch (7th–24th Oct), Nifty rallied more than 1000 points, hitting our 25,900 pattern target — a smooth ride for intraday traders, except for a few choppy sessions.
🗞 Nifty Summary
Last week’s candle shaped like an inverted hammer/shooting star, hinting at either a pause or a short-term reversal. But today, backed by positive global cues, Nifty opened gap-up by 48 points, showed no intent to fill the gap, and rallied sharply upward.
The index faced resistance around 25,944–25,977, and after several failed breakout attempts beyond 25,977, it briefly marked a new day high at 26,005 before slipping back into the resistance zone.
The final two hours turned volatile — both bulls and bears fought for control. Eventually, Nifty closed at 25,974, just below the intraday high yet comfortably above the previous day’s high — a sign of bullish continuation with caution ahead.
While the close above PDH is positive, sustained strength will only come if bulls breach and hold 25,977–26,020 on the upcoming monthly expiry session.
🛡 5 Min Intraday Chart with Levels
🛡 Intraday Walk
Nifty opened Gap-Up 48 points above PDH.
Rally extended straight to 25,944–25,977 resistance zone.
26,005 marked as intraday high — brief breakout attempt failed.
Last two hours saw heavy volatility within resistance band.
Closed strong at 25,974, maintaining higher-high structure.
🕯 Daily Candle Breakdown
Open: 25,843.20
High: 26,005.95
Low: 25,827.00
Close: 25,966.05
Change: +170.90 (+0.66%)
🏗️ Structure Breakdown
Green candle with solid momentum.
Body ≈ 122.85 pts → decent bullish body.
Range ≈ 178.95 pts → healthy intraday activity.
Upper wick ≈ 39.9 pts, Lower wick ≈ 16.2 pts.
📚 Interpretation
Market opened gap-up and held gains throughout.
Strong follow-through buying above 25,850.
Close near upper quartile of range → bullish conviction intact.
Minor upper wick shows temporary supply at 26,000 psychological mark.
🕯Candle Type
Bullish Marubozu variant (small top wick).
Indicates buying continuation after breakout-driven rally.
🛡 5 Min Intraday Chart
⚔️ Gladiator Strategy Update
ATR: 204.01
IB Range: 119.70 → Medium
Market Structure: Balanced
Trade Highlights:
09:20 – Long Trade → Target Achieved (R:R 1:1.85)
10:06 – Long Trade → Target Achieved (R:R 1:0.79)
📌 What’s Next? / Bias Direction
Bias: Mildly Bullish
As long as 25,850–25,865 holds, the bias remains positive.
A breakout above 26,020 may extend targets to 26,085–26,150, while failure could lead to a sideways consolidation.
📌 Support & Resistance Levels
Resistance Zones:
25996
26010 ~ 26020
26085 ~ 26100
Support Zones:
25865
25828
25790
25725 ~ 25715
💡 Final Thoughts
“Momentum loves clarity — hesitation builds only where conviction weakens.”
The market tone stays upbeat, but resistance near 26,000 will test whether bulls have the stamina to carry forward the festive rally.
✏️ Disclaimer
This is just my personal viewpoint. Always consult your financial advisor before taking any action.

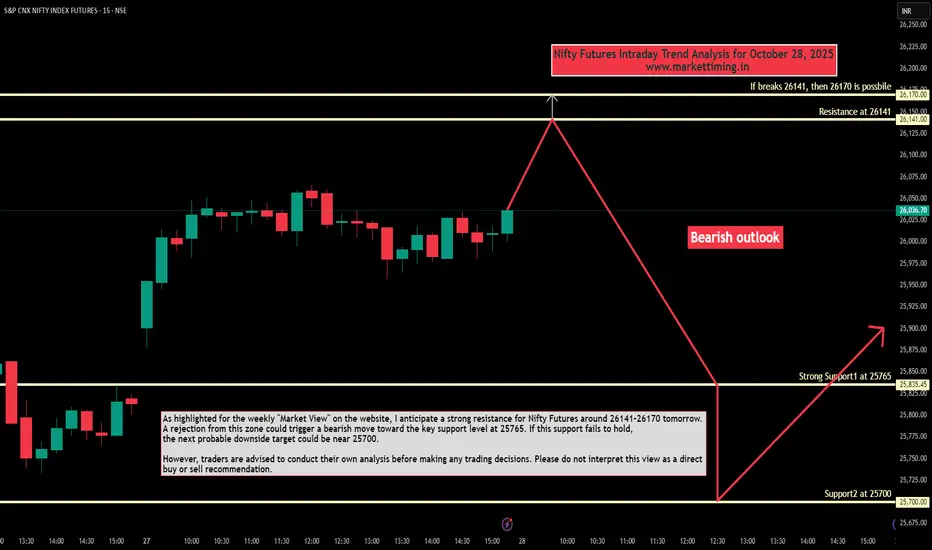
Nifty Futures Intraday Trend Analysis for October 28, 2025As highlighted for weekly "Market View" outlook on the website, I anticipate a strong resistance for Nifty Futures around 26141–26170 tomorrow. A rejection from this zone could trigger a bearish move toward the key support level at 25765. If this support fails to hold, the next probable downside target could be near 25700.
However, traders are advised to conduct their own analysis before making any trading decisions. Please do not interpret this view as a direct buy or sell recommendation.
Nifty - A shakeout to go more higher or a Bull trap?So on Friday, NSE:NIFTY fell as profit booking started after that sharp rally which we spotted earlier on October 9.
Big congrats to all the ones who trusted the analysis and traded it well.
Now, on Friday we saw both-side buildup on the index, but sellers’ volume was higher — that’s important to note.
For tomorrow, we only need to focus on one thing — whether Nifty breaks above 25850 or below 25750. These two levels hold massive OI buildups and will decide the next move.
If Nifty breaks above 25850, expect a sharp short rally (sharp because the PP is tight) that could push the index to new highs in the coming days.
But if it breaks below 25750 and sustains for one hour, we could see a drop toward 25666 / 25445.
However, my view stays Sell-on-Rise unless the index gives a strong close above 25850.
Why? Look at the attached chart — Friday’s candle was a clear shakeout candle, and there’s visible selling pressure buildup. This combination suggests that while accumulation is happening, buyers still lack the strength to dominate the sellers.
This weakness might reflect tomorrow. And remember — this view fails if Nifty breaks 25850 and sustains above it for one hour.
In trading, execution always beats opinion. So I’ll execute based on how the market behaves tomorrow — because I’d rather lose my view than lose my money.
Pivot stays at 25819, you guys already know what to do with that information.
On the sectoral front, NSE:CNXFINANCE , NSE:BANKNIFTY , and NSE:CNXMETAL continue to look strong.
That’s all for today. Take care and have a profitable tomorrow.
📊Levels at a glance:
Pivot: 25819
Support: 25750 (below = 25666 / 25445)
Resistance: 25850 (above = sharp short rally to new highs)
Pivot Percentile: Tight (volatile breakout/breakdown possible)
Bias: Sell-on-Rise until close above 25850
Market view: Shakeout candle with selling buildup
Sectors to watch: Financials, Banks, Steel
Nifty 50 @ 52 Week high but Could not Break ATH!What is there for Nifty 50 Now?
Nifty 50 went up till 52 week High @ 26104
but Could not Cross the ATH of 26277
missed by 173 points
There is a Hammer Candle formation on weekly charts from Controlling Supply Zone at the top. Which means bears are not interested to turn to bulls right now.
There is a Strong Resistance @ 26250
and if we talk about Support it is @ 25500 & 25000 and if it breaks it then @ 24500
As per my analysis
1. It should test 25500 and then turn bullish and try top break 26200-26250 Strong Resistance and it it breaks it then we will find a new ATH.
2. it cant hold on 25500 then next Support will be 25000. if it takes support from there it can find resistance much more near @ 25500 then and if it breaks it then it can rally again up till 26200 - 26250 strong resistance or otherwise drop till 24500.
3. If Nifty 50 cant hold on to 25500 & 25000 then it can settle @ 24500 then. It will be a strong Support as then it will be @ Controlling Demand Zone of Monthly. it will take some time then to reach this level monthly EMA 20 will also be near then and it should take Support from it and Start a new Bullish Journey
if it reaches 24500 then it will be a very good opportunity for investors to invest in major shares as they also be at very good level to buy then.

Shipping Corporation of India Limited chart analysisBUY Setup ⚓
Entry: ₹250-252 (Current Level)
Target 1: ₹260-265
Target 2: ₹275-280
Target 3: ₹290+ (Extended)
Stop Loss: ₹242
Technical Rationale:
Explosive breakout with +7.93% surge on massive volume
Exceptional volume spike (38M) - highest in the chart period
Breaking out from consolidation range (225-240)
RSI spiking above 60, indicating strong bullish momentum
Price crossing above key resistance at 245-246 level
Gap-up opening showing strong institutional buying
Shipping sector momentum with global trade trends
Support established at breakout zone (245)
Risk-Reward: Strong 1:4+ ratio
Sector Catalyst: PSU shipping stocks showing strength, potential government policy support
Strategy: Momentum trade - Book 30% at T1 (260), 30% at T2 (275), trail SL to 255 after T1 achieved
Caution: High volatility expected - avoid overexposure. Watch for profit booking after sharp rally

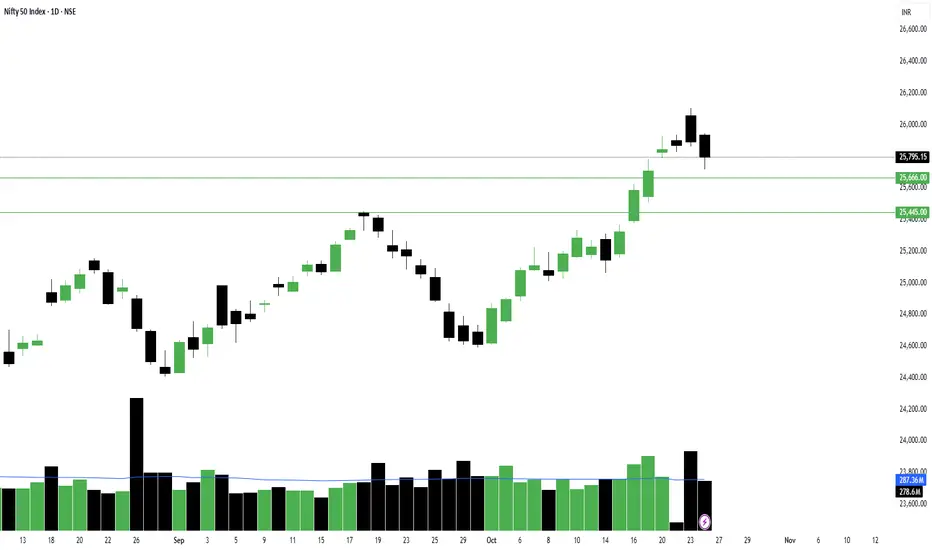
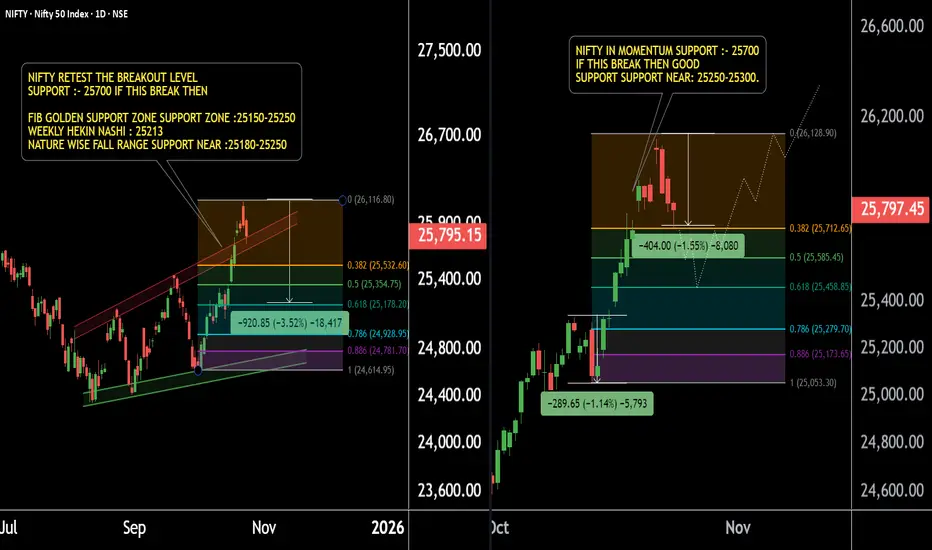
NIFTY SUPPORT LEVELS – Time to Focus for Potential ReversalNIFTY – Focus on Key Buying Levels (Daily & 4H Timeframe Analysis)
NIFTY is currently showing strong support zones for both momentum and safe buying opportunities.
Timeframe: Daily & 4H
Primary Momentum Buying Level: Around 25,700
Based on Fibonacci levels and short-term price action.
If NIFTY breaks below 25,700, we may see a further decline of 200–250 points.
Next Support Zone: 25,450–25,500 (Daily Timeframe)
Heikin Ashi Candle Support: 25,213, with a broader support range of 25,150–25,250 — confirmed by multiple price action setups.
Key Insight:
If NIFTY holds above these key supports, a reversal or bullish momentum is highly possible. Stay focused on the mentioned levels and trade with patience and discipline.
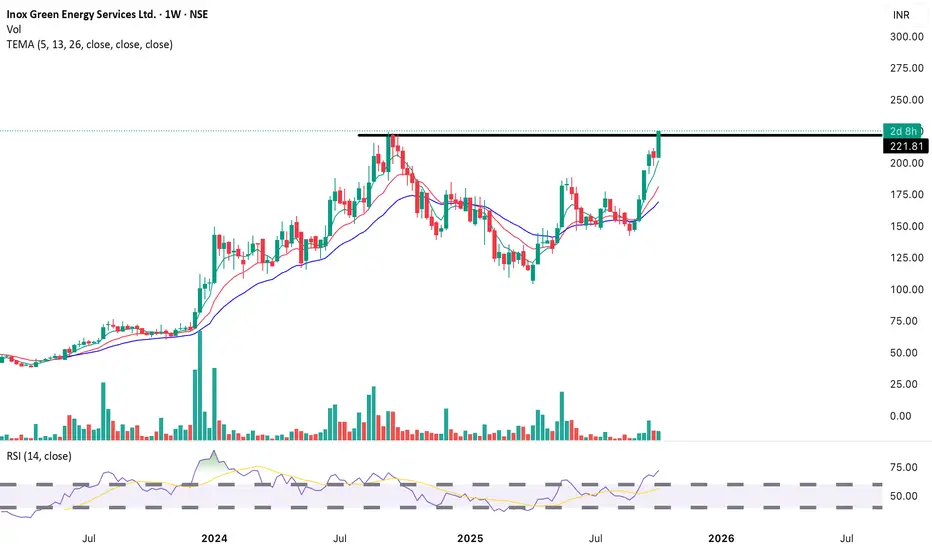
Long (Bullish) – Continuation expected if price sustains Resistance Turned Support: ₹221
Next Target Zone: ₹250–₹275
Stop-loss: Below ₹201 (recent swing low and major moving average)
Nifty Short & Medium Term Support&Resistance_22-Oct to 23-Oct-25Nifty Short & Medium Term Support&Resistance_22-Oct to 23-Oct-25
Nifty 25868
Long call was given two weeks before, Nifty very decisively crossed the 25000 resitance and moved up 1000 Points in the last week.
Current Short Term Resistance are 26000 and 26269 ( all time high). It need to break the resistance 26269 decisively to move up to 28000 target in med-long term.
Quarterly result started coming out slowly, HDFC Bank posted 10% profit, ICICI Bank posted 5% profit, Reliance posted 10% profit. HDFC AMC, Persistent Systems,Dixon, Waree Energies and Renewables, KEI, Polycab, ICICI Lombard and ICICI Pru posted good results. All these stocks are already gone up and PE is high. Hence the market also moved up last week. Forthcoming results will take the Index further up or down.
Hence the strategy can be shifted to neutral from long.
Overall, the Qtrly Results and Tariffs deal will decide the future path of the Nifty. Since it is a Volatile situation SIP route or buy in multiple parcel route with a goal of 3-5 years will workout.
Recent 100% additional tariff on China got severe effect on US market on Friday, it will affect global other trade markets too on Monday. Mainly due to the uncertainty prevailing over.
However, for India though initial drop market tend to move up to 25670 ( Jun 2025 all time high).
Repo and FD rate reduction by RBI, people mandatorily have to choose Debt/Commodity/Equity as alternate in order to beat the inflation.
Apart from that Low Cost ULIPs (2.5 L Limit per person) as one of the option to save the tax- ICICI & HDFC ULIPs are doing well, ULIPs are simplified and charges are lesser compared to MFs in terms of long term, Various fund option including passive funds are introduced.
GST 2.0 is a reform which can aid in Auto/ FMCG / Home Appliances sales will get a boost due to the festival season.
Since market is volatile, use the dips (Opportunity) and buy through SIP or through multiple parcel in these uncertain times with a goal of 3-5 years.
Nifty Short Term Supports:
1.25200 ( 25154 Aug 2025 high)
2.25350 ( Fibonacci resistance shown )
3.25450 ( 25442 is the Aug 2025 high)
4. 25500 ( 25441 Sep 18th 2025 High )
5. 24700 (Trend Line as shown)
6. 24000-24170 (Fibonacci Retracements Supports- Two Supports in this zone 24116 & 24171 as shown)
Medium Term Support:
1. 23500-23700 (Fibonacci Retracements Supports- Two Supports in this zone 23608 & 23707 as shown)
2. 23000
Resistance ( Multiple Resistances are there between 25000-25650):
1. 25000
2.
Medium Term:
1.25670 ( Jun 2025 High) Should cross this resistance in short term decisively inorder to move up.
2.26269 ( Sep 2024 High)


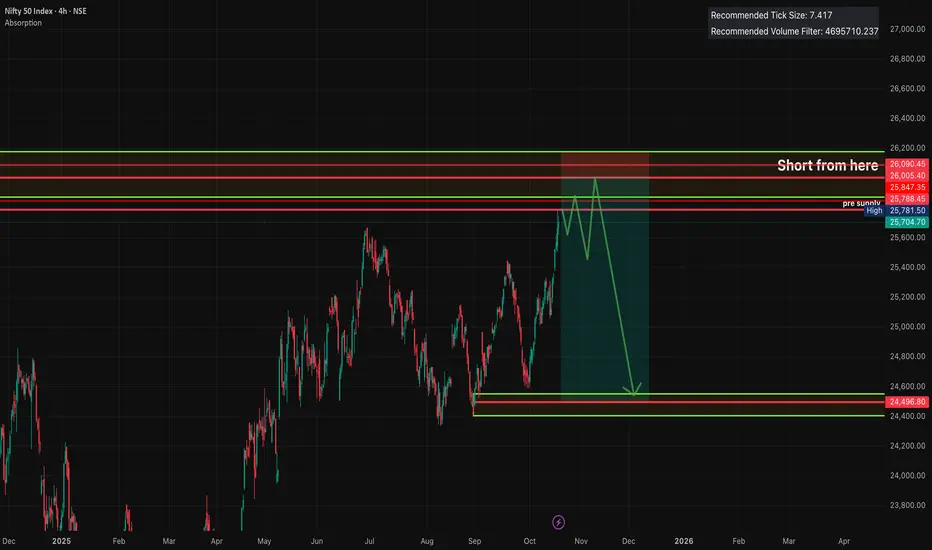
Short Nifty From 26000 for huge sharp sell offShort Nifty From 26000 for huge sharp sell off. Creating double top pattern with lifetime high, with sharp rally upwards expecting huge orders to sell from 26000 levels. SL is at 1.5% higher to Lifetime high or check the trade plotted on the chart for Entry. SL and target.
This is all for study purpose, dont take trade based on this idea.