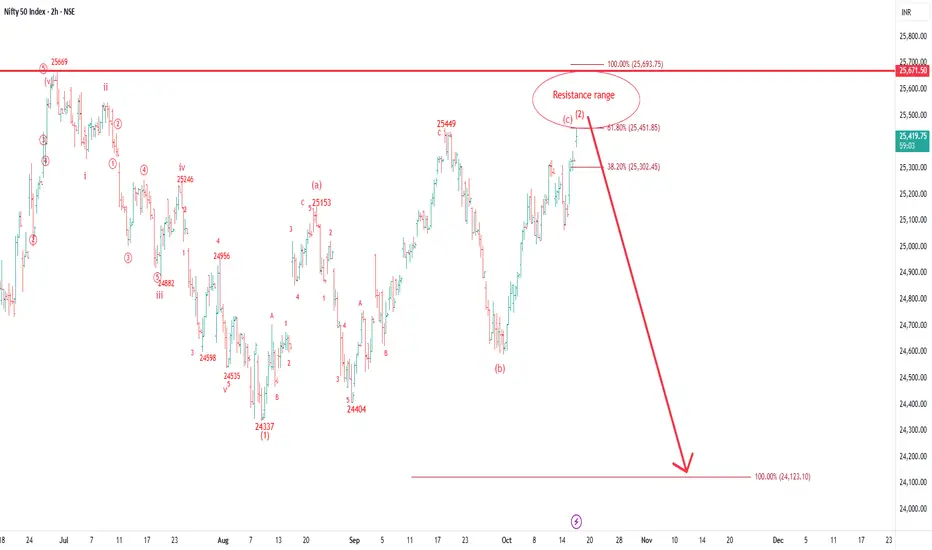
ALERT:Nifty is in Resistance range. Stay Cautious on Buying sideIn this 2hour chart Nifty formed a corrective pattern from 24337 and now it is near to its completion range and soon may decline below 24300 in coming days/weeks.
This analysis is based on Elliott wave Theory so If you have not understand Elliott wave then kindly ignore it.
Thank you.
Niftyprediction
Nifty - Expecting a minor dip with short term bullishnessSo as we studied yesterday, a sharp move was under development — and that’s exactly what played out today.
Today’s move in NSE:NIFTY was genuine as it was backed by strong buyers’ volume of nearly 70 million.
However, I believe that’s just half the action I was expecting. Since today’s Pivot Percentile is again tight, we may see another sharp move soon.
Intraday momentum looks a bit exhausted, so a small dip can’t be ruled out.
Pivot has now moved up to 25300, which will act as intraday support tomorrow.
If this level breaks, we can see 25250–25180 levels being tested — that would be a good opportunity to collect longs.
A crucial support remains at 25100. The short-term trend stays clearly bullish as long as this level holds.
Next important resistance stands at 25355 — if Nifty breaks this, we could see another rally toward 25500 or even higher.
NSE:BANKNIFTY also looks strong after crossing its short-term resistance at 56156.
With this setup, we’re actively trading in NSE:CNXPSUBANK
Another short-term theme looking good right now is NSE:NIFTY_IND_DEFENCE
That’s all for the day. Take care and have a profitable tomorrow.
📊 Levels at a glance:
Pivot: 25300
Support 1: 25250–25180 (buy zone on dip)
Support 2: 25100 (crucial level)
Resistance: 25355 (break = rally to 25500+)
Pivot Percentile: Tight (sharp move likely)
Bias: Short-term bullish with minor intraday dip expected
Sectors to watch: PSU Banks, Defence


NIFTY 13th Oct'2025 | LONG | BULLISH Nifty : Bullish Trend
Long Entry
15m after sell-side lq sweep market likely move to bullish trend until above zone.

Nifty Short & Medium Term Support&Resistance_13-Oct to 17-Oct-25Nifty Short & Medium Term Support&Resistance_13-Oct to 17-Oct-25
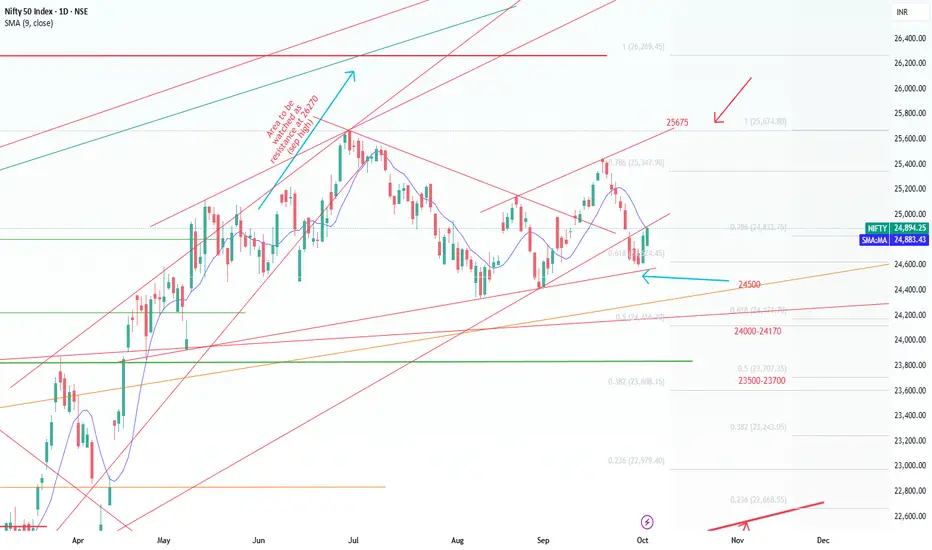
Nifty 24894
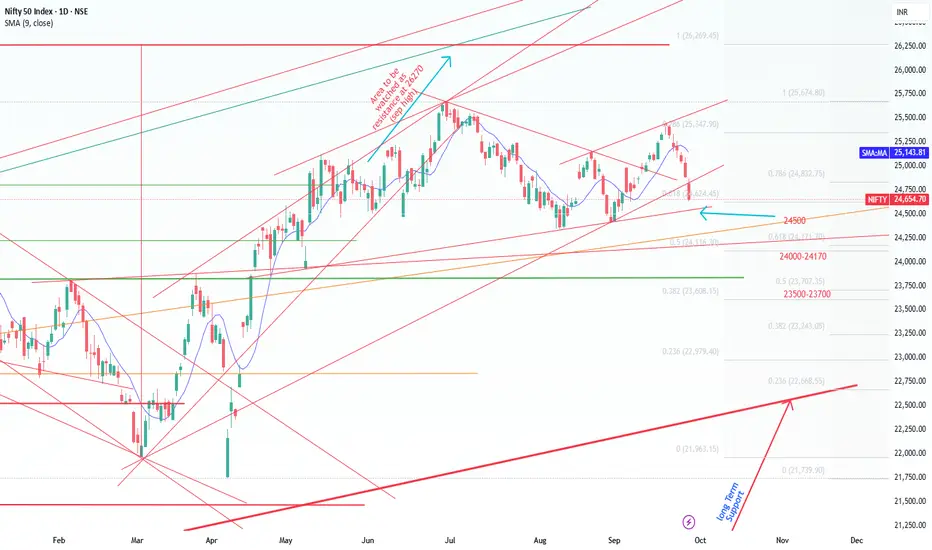
As predicted last week, Nifty very well hold the 24500 Support and currently moved near to the first resistance 25000.
One more positive decisive break above Ist Short Term Resistance as given below in order market to move up.
Quarterly result started coming out slowly, TCS posted average result, Warree Renewables posted vgood results (PE is very high) .
Qtrly Results and Tariffs deal will decide the future path of the Nifty. Since it is a Volatile situation SIP route or buy in multiple parcel route with a goal of 3-5 years will workout.
Recent 100% additional tariff on China got severe effect on US market on Friday, it will affect global other trade markets too on Monday. Mainly due to the uncertainty prevailing over.
However, for India though initial drop market tend to move up to 25670 ( Jun 2025 all time high).
Repo and FD rate reduction by RBI, people may have to choose Debt/Commodity/Equity as alternate in order to beat the inflation.
Apart from that Low Cost ULIPs (2.5 L Limit per person) as one of the option to save the tax- ICICI & HDFC ULIPs are doing well, ULIPs are simplified and charges are lesser compared to MFs in terms of long term, Various fund option including passive funds are introduced.
Market was on decline/ Consolidation mode recently because of new Tariff's imposed by Trump mainly on Pharma and IT - H1 B Visa and Tax for Outsourcing IT and the recent pharma tarrifs imposition.
GST 2.0 is a reform which can aid in Auto/ FMCG / Home Appliances sales will get a boost due to the festival season.
Since market is volatile, use the dips (Opportunity) and buy through SIP or through multiple parcel in these uncertain times with a goal of 3-5 years.
Nifty Short Term Supports:
1. 24500 (Trend Line as shown)
2. 24000-24170 (Fibonacci Retracements Supports- Two Supports in this zone 24116 & 24171 as shown)
Medium Term Support:
3. 23500-23700 (Fibonacci Retracements Supports- Two Supports in this zone 23608 & 23707 as shown)
4. 23000
Resistance ( Multiple Resistances are there between 25000-25650):
1. 25000
2. 25200 ( 25154 Aug 2025 high)
3.25350 ( Fibonacci resistance shown )
4.25450 ( 25442 is the Aug 2025 high)
3. 25500 ( 25441 Sep 18th 2025 High )
Medium Term:
1.25670 ( Jun 2025 High) Should cross this resistance in short term decisively inorder to move up.
2.26269 ( Sep 2024 High)
GMDC Breakout Setup: Buy Above 637Entry: Buy above 637 (recent resistance and Fibonacci breakout spot).
Target 1: 673 (Fibonacci 0.382 retracement).
Target 2: 703 (Fibonacci 0.5 retracement).
Target 3: 733 (Fibonacci 0.618 retracement).
Stoploss: 615 (below recent support and trendline).
Volume spike and RSI uptick signal momentum

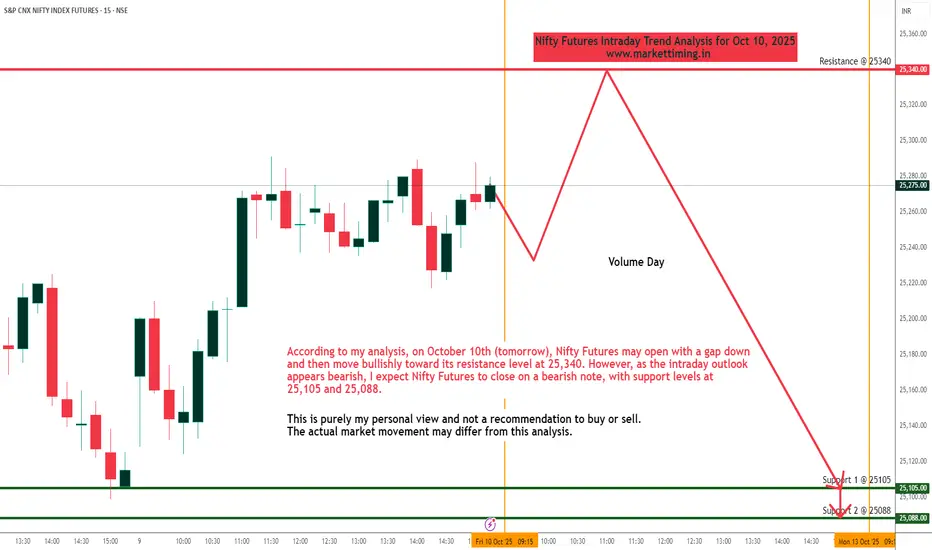
Nifty Futures Intraday Trend Analysis for October 10, 2025According to my analysis, on October 10th (tomorrow), Nifty Futures may open with a gap down and then move bullishly toward its resistance level at 25,340. However, as the intraday outlook appears bearish, I expect Nifty Futures to close on a bearish note, with support levels at 25,105 and 25,088.
This is purely my personal view and not a recommendation to buy or sell. The actual market movement may differ from this analysis.
Nifty - Shd hit 27000 in short termNIFTY - is bullish setup and gave entry around 24600 with SL 24400. we are expecting 27000 in short term.

Bullish Breakout – Monitor for follow-through Support: ₹500–₹570 (previous resistance)
Upside Targets: ₹650, ₹750
Stop-loss: Below ₹499

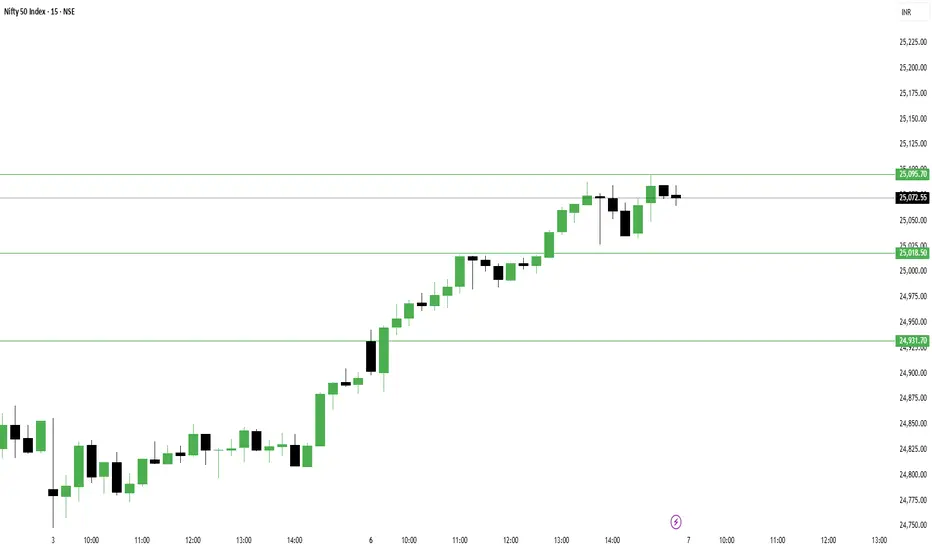
Today's Bullish Move Looks CautiousAs per the price and volume analysis I did yesterday, NSE:NIFTY was expected to give a dip to the support today and then bounce.
But instead, it moved sharply and closed above a very important resistance level — 25000!
However, I’m not fully confident in this move unless we get a follow-up candle of the same strength tomorrow.
Why?
Because there’s a clear pattern suggesting that Smart Money — or say institutions (and I’m not referring to FII data here; I don’t usually trust that) — sold their positions to retailers. The Retail Index went down even on such a strong up day!
That’s not a good sign for the index in the coming days. I think this will soon reflect as a shakeout in the near term.
Now yes, today’s move was backed by buyers’ data and the trend did turn upward — but the momentum didn’t follow through.
Now let’s check what the data says for tomorrow:
– Pivot has risen to 25018, and PP is still tight
– Support for tomorrow: 25025
– Resistance for tomorrow: 25095
According to the data, the index should stay sideways tomorrow.
However, if any of these levels break, here’s my plan:
1. If 25018 breaks on the downside, I’ll short with targets 24930 / 24850
2. If 25095 breaks on the upside, I’ll go long with a target of 25225
Let’s see how it plays out. I’ll stick to my plan as always — no blind chasing.
NSE:BANKNIFTY has broken above its short-term pivot, so I’ll keep my focus there too. Any dip there would be an opportunity to go long.
FnO stocks backed by buyers’ volume:
1. NSE:KEI
2. NSE:BHARATFORG
Sectors to watch tomorrow – Healthcare and Finance.
That’s all for today. Take care and have a profitable tomorrow!
---
📊 Levels at a glance:
- Pivot: 25018
- Support: 25025
- Resistance: 25095
- Downside targets (if pivot breaks): 24930 / 24850
- Upside target (if resistance breaks): 25225
- Pivot Percentile: Tight (range-bound bias)
- Bias: Sideways, watch for shakeout or follow-up confirmation
- Sectors to watch: Healthcare, Finance
Nifty Short & Medium Term Support&Resistance_5-Oct to 10-Oct-25Nifty Short & Medium Term Support&Resistance_5-Oct to 10-Oct-25
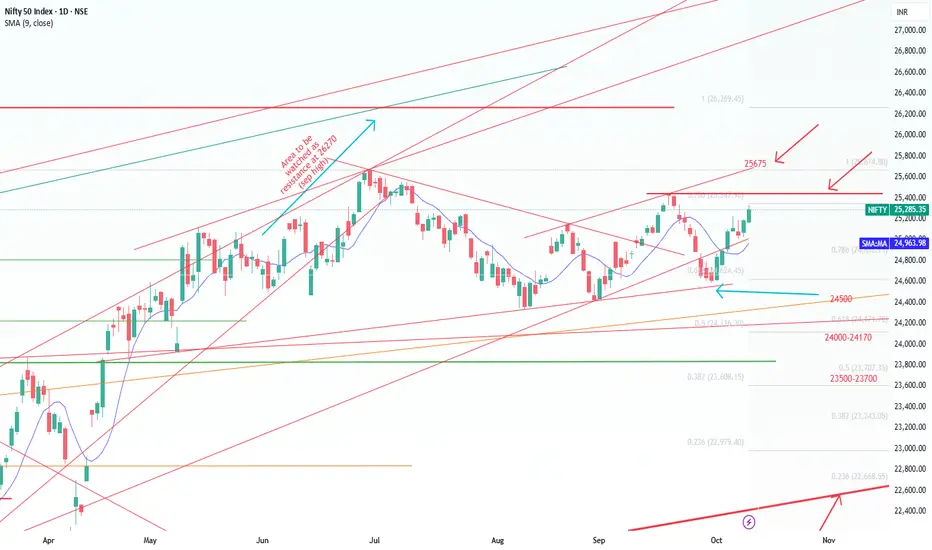
Nifty very well hold the 24500 Support and currently near to the trend line support (as drawn) as mentioned last week.
Repo rate reduction by RBI boosted the market as there will be more liquidity in the market and it will aid more loan disbursal. But there is a small concern is FD rate reduction and inflation may go little higher.
Last two days trade reflected it and market moved up, one more positive decisive break can take to short term resistance.
Quarterly result and Tariffs deal will decide the future path of the Nifty. Since it is a Volatile situation SIP route or buy in multiple parcel route with a goal of 3-5 years will workout.
Since FD rate reduction, people may have to choose Debt/Commodity/Equity as alternate in order to beat the inflation.
Apart from that Low Cost ULIPs (2.5 L Limit per person) as one of the option to save the tax- ICICI & HDFC ULIPs are doing well, ULIPs are simplified and charges are lesser compared to MFs in terms of long term, Various fund option including passive funds are introduced.
Market was on decline/ Consolidation mode recently because of new Tariff's imposed by Trump mainly on Pharma and IT - H1 B Visa and Tax for Outsourcing IT and the recent pharma tarrifs imposition.
GST 2.0 is a reform which can aid in Auto/ FMCG / Home Appliances sales will get a boost due to the festival season.
Since market is volatile, use the dips (Opportunity) and buy through SIP or through multiple parcel in these uncertain times with a goal of 3-5 years.
Nifty Short Term Supports:
1. 24500 (Trend Line as shown)
2. 24000-24170 (Fibonacci Retracements Supports- Two Supports in this zone 24116 & 24171 as shown)
Medium Term Support:
3. 23500-23700 (Fibonacci Retracements Supports- Two Supports in this zone 23608 & 23707 as shown)
4. 23000
Resistance ( Multiple Resistances are there between 25000-25650):
1. 25000
2. 25200 ( 25154 Aug 2025 high)
3.25350 ( Fibonacci resistance shown )
3. 25500 ( 25441 Sep 18th 2025 High )
Medium Term:
1.25670 ( Jun 2025 High) Should cross this resistance in short term decisively inorder to move up.
2.26269 ( Sep 2024 High)
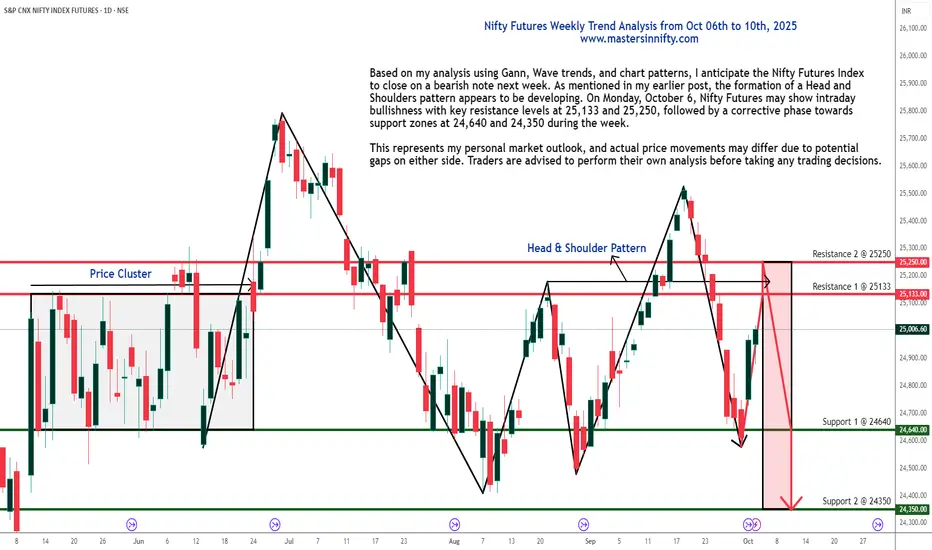
Nifty Index Futures Weekly Outlook from October 06-10, 2025Based on my analysis using Gann, Wave trends, and chart patterns, I anticipate the Nifty Futures Index to close on a bearish note next week. As mentioned in my earlier post, the formation of a Head and Shoulders pattern appears to be developing.
On Monday, October 6, Nifty Futures may show intraday bullishness with key resistance levels at 25,133 and 25,250, followed by a corrective phase towards support zones at 24,640 and 24,350 during the week.
This represents my personal market outlook, and actual price movements may differ due to potential gaps on either side. Traders are advised to perform their own analysis before taking any trading decisions.
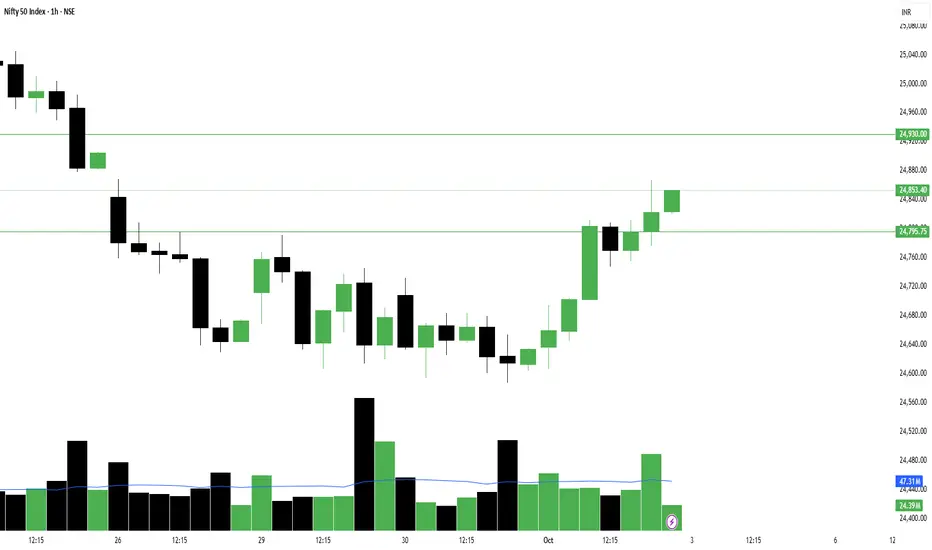
Volume turnaround seen in Nifty on daily chart but...So as we’ve been studying for the past 3 days – NSE:NIFTY ’s candle kept closing red but the volume was with buyers. Yesterday, that clearly reflected with the index jumping +225 points in a sharp, clean move.
Cheers to those who trusted the commentary and took early entries! I did too.
The idea now is simple – hold on to that position until we see sellers’ volume with a green candle.
Now, let’s check the data for tomorrow:
– Pivot has moved up to 24770
– PP is wide, which signals a sideways to trending day with bullish tone intact
– Support for tomorrow is 24800
– Resistance for the day is 24930. Only if this level is breached and sustained for at least 1 hour can we expect a sharp move.
Any dip from here remains a buy opportunity as long as the index stays above the pivot at 24770, because the current candle is backed by buyers’ volume.
But keep this in mind – the net volume of the market is still in red. That means it’s not yet the time to open long-term portfolio positions. Wait for net volume to give a turnaround before building long-term stock holdings. Remember, we are still under the correction zone that began in September 2024.
On the sector front, rotation is being seen in Defence and Media, while Finance and NBFC continue in high momentum for the short term.
FnO stocks with buyers’ volume up are:
NSE:BHARATFORG and NSE:BSE
You can look for intraday opportunities here. But for options trading, be mindful of pivotal entries and IVP. Sometimes these stocks take more than a day to move, so don’t be disheartened if they don’t react immediately. Keep them on watch and plan your entry to manage risk.
That’s all for the day. Take care and have a profitable tomorrow.
I truly hope you learn and earn a lot with me!
---
📊 Levels at a glance:
Pivot: 24770
Support: 24800
Resistance: 24930 (sustain 1 hour = sharp move)
Pivot Percentile: Wide (sideways to trending)
Bias: Bullish as long as index holds above pivot, buy dips backed by volume
Sectors to watch: NSE:NIFTY_IND_DEFENCE , NSE:CNXMEDIA , NSE:CNXFINANCE , NBFC
FnO Focus: #BHARATFORGE, #BSE
Nifty 50: Genuine Rally or Selloff Setup?The Nifty 50 Index went up, but this upward move was likely just a temporary correction, not the start of a new, long-term rise.
Bottom (Wave W): The index first hit a low around 24,377
Bounce (Wave X): It then went up to a high near 25,448. This rise was a clear, three-part corrective move (like an ABC pattern) that stayed inside a rising channel .
Clue: Because the move from the bottom (W) to the peak (X) was corrective, it suggests the overall trend is still bearish (downward).
Points to look at:
1. Reversal: The index is currently around 24,836 and is starting to turn down from the top of that rising channel. This suggests the temporary rise is over.
2. Projected Drop (Wave Y): The main prediction is a significant drop (Wave Y) that will likely break the previous low of 24,377 .
3. Target: This decline is expected to head toward the lower blue trendline on the chart, completing a larger WXY corrective pattern.
4. Projection: Ending point of wave (Y) can act as the ride for the new impulse cycle.
5. Bearish Stance: Traders should be cautiously bearish (expecting the price to fall).
6. Price action perspective: Previous swing is bearish, better to look at short positions for safe entry.
7. Selling Opportunities: Any small upward movements (retracements) are seen as good selling opportunities (betting on the price going down), as long as the price doesn't break above the recent highs or the channel ceiling.24,300 is indeed a strong demand zone.
Stay tuned!
Money Dictators :)

Nifty Analysis EOD – September 30, 2025 – Tuesday🟢 Nifty Analysis EOD – September 30, 2025 – Tuesday 🔴
Expiry drama continues, but no reversal in sight
🗞 Nifty Summary
Nifty opened with a 31-point gap up, quickly filled the gap, and then added 50 points from the low to test 24,731.80 — the same level that acted as strong resistance yesterday. Once again, the index failed to cross this barrier, triggering a sell-off to 24,593, breaking below the PDL.
However, this breakdown turned out to be false, sparking a 90-point recovery back to the PDC at 24,677.50. Multiple attempts to reclaim the PDC failed. Post 2 PM, volatility spiked — with wild candles and sharp shadows around key levels like PDL, trapping both sides of traders.
Eventually, Nifty settled at 24,633.60, marking the 9th consecutive red close. While the fall seems to be slowing, there is still no sign of reversal yet.
🛡 5 Min Intraday Chart with Levels
🛡 Intraday Walk
Gap up +31 pts → gap filled early.
Bounce of +50 pts to test 24,731.80, yesterday’s resistance.
Sharp sell-off to 24,593 (below PDL).
False PDL breakdown → 90-pt recovery to PDC (24,677.5).
Multiple failures to reclaim PDC.
After 2 PM → wild, volatile candles with traps around PDL.
Closed at 24,633.60.
📉 Daily Time Frame Chart with Intraday Levels
🕯 Daily Candle Breakdown
Open: 24,668.55
High: 24,731.80
Low: 24,593.05
Close: 24,633.60
Change: −1.30 (−0.01%)
🏗️ Structure Breakdown
Tiny red body → indecisive close.
Range: ~139 pts → lower than yesterday.
Long shadows on both ends → strong tussle between bulls and bears.
📚 Interpretation
Rejection repeated at 24,731.
False breakdown below PDL shows buyers defending.
Closing near mid-range with tiny body → indicates pause in momentum.
🕯Candle Type
Small-bodied candle with long shadows → Indecision candle / Doji-like structure.
Signals exhaustion but no confirmation of reversal.
🛡 5 Min Intraday Chart
⚔️ Gladiator Strategy Update
ATR: 173.37
IB Range: 95.80 → Medium
Market Structure: Balanced
Trade Highlights:
10:50 Long Trade – Target Achieved (R:R 1:2.1)
12:15 Long Trade – Trailing SL Hit (R:R 1:0.26)
13:20 Short Trade – Target Achieved (R:R 1:1.96)
📌 What’s Next? / Bias Direction
Bias remains bearish below 24,731. A decisive close above this level could trigger a short-term reversal. Until then, sideways-to-downtrend movement dominates with volatility around support zones.
📌 Support & Resistance Levels
Resistance Zones:
24685 ~ 24675
24735
24750 ~ 24775
24868
24890 ~ 24915
Support Zones:
24600 ~ 24572
24500
24430 ~ 24400
💡 Final Thoughts
“In trading, sideways days are often the market’s way of loading energy. The trap candles test patience — the real move begins once levels finally break.”
✏️ Disclaimer
This is just my personal viewpoint. Always consult your financial advisor before taking any action.

Analysis on NIFTY50(short term bearish)1. Index fell sharply from 25400 to 24600
2. it is sitting now at 24600 support zone testing before in early September.
3. Indecision near support.
4. Selling pressure earlier was strong.
NIFTY50 is still in short-term downtrend, holding support at 24600.
Disclaimer:
I am NOT a SEBI registered advisor nor a financial advisor.
Any investments or trades I discuss on my blog are intended solely for educational purposes and do not represent specific financial, trading, or investment advice.
Disclosure:
I, the author of this report, and my immediate family members do not have any financial interest or beneficial ownership in the securities mentioned herein at the time of publication.

nifty50 Analysis | be careful from trapMarket Outlook
Support Zone: 24,550 – 24,400
Resistance Levels: 24,750 – 24,790 and 24,960 – 24,990
A falling wedge pattern is currently forming just above the support zone. The key level to watch is 24,590, as a sweep of this low appears likely. However, before a potential breakdown, price may first retest the immediate resistance area and face rejection, leading back toward the support zone.

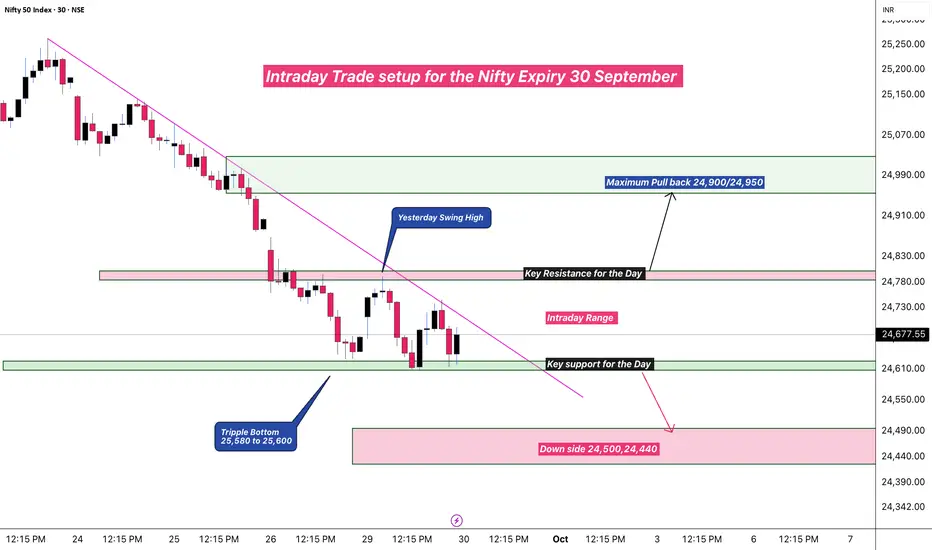
Expiry Trade Setup : 30 September 📊 Nifty Expiry Day Analysis
I’ve prepared a detailed trade setup for today’s Nifty expiry session. The key resistance zone is placed around 24,800, while 24,600 acts as a crucial lower boundary.
It’s advisable to avoid trading within the 24,600–24,800 range, as the market may remain choppy and directionless.
Instead, wait for a clear breakout beyond 24,800 or a breakdown below 24,600 to initiate intraday positions with better risk-reward opportunities.
Stay disciplined and trade with proper risk management.
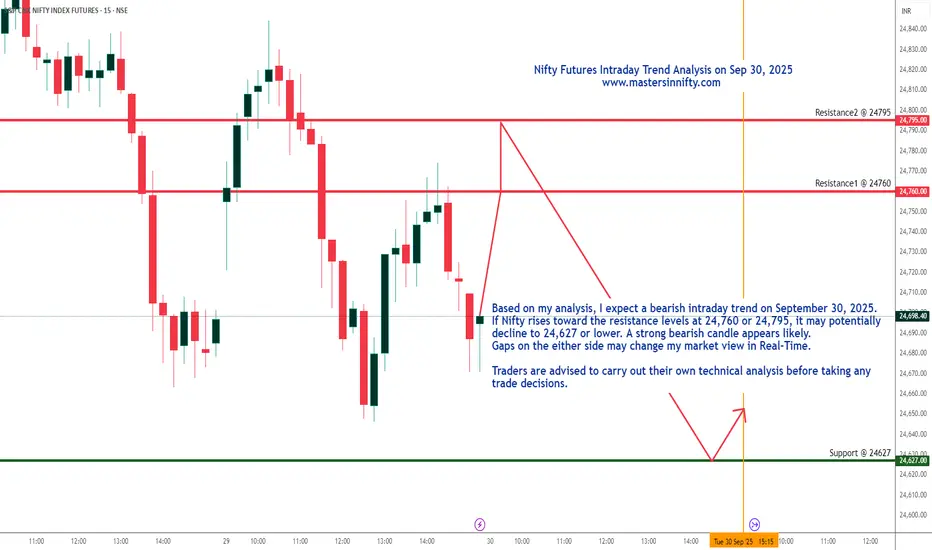
Nifty Futures Intraday Trend analysis on Sept 30, 2025Based on my analysis, I expect a bearish intraday trend on September 30, 2025. If Nifty rises toward the resistance levels at 24,760 or 24,795, it may potentially decline to 24,627 or lower. A strong bearish candle appears likely. Gaps on the either side may change my market view.
Traders are advised to carry out their own technical analysis before taking any trade decisions.
Rectangle breakout with strong volume buildup📈 Buy Above: ₹155
🎯 Target 1: ₹185
🎯 Target 2: ₹210
🛑 Stop Loss: ₹135
⚡Volume confirmation + breakout retest can give momentum move.

Buy Sundaram Finance Holdings Ltd. Buy ₹634
target of ₹720
stoploss at ₹570
based on current technical setup and breakout from consolidation zone.

Nifty Spot Daily Trend Analysis from September 29Nifty spot may find support near 24,530 with a potential rebound toward 25,100, indicating the possibility of a Head and Shoulders formation in the coming sessions.
A gap-up opening on September 29, 2025 cannot be ruled out, which may influence these projected levels. Traders should rely on their own technical assessment before initiating positions.
Adherence to disciplined risk management is strongly recommended.

Nifty Short & Medium Term SupportsNifty on a decline mode because of new Tariff's imposed by Trump mainly on Pharma this week.
Primarily New announcement on IT - H1 B Visa and Tax for Outsourcing IT and the recent pharma tarrifs are the concern.
Use the dips (Opportunity) and buy through SIP or through multiple parcel in this uncertain times with a goal of 3-5 years.
Nifty Short Term Supports:
1. 24500 ( Trend Line as shown )
2. 24000-24170 (Fibonacci Retracements Supports- Two Supports in this zone 24116 & 24171 as shown)
Medium Term Support:
3. 23500-23700 ( Fibonacci Retracements Supports- Two Supports in this zone 23608 & 23707 as shown)
4. 23000
Resistance:
1. 25000
2. 25200 ( 25154 Aug 2025 high)
3. 25500 ( 25441 Sep 18th 2025 High )
Medium Term:
1.25670 ( Jun 2025 High)
2.26269 ( Sep 2024 High)