Couple of good candles in last 2 days.We saw 2 good candles in last 2 days indicating bottom formation and the candle today signifies a trend breakout. Now if Nifty can close the week above today's candle it will lay a path for good budget on Sunday to take us forward.
Supports for Nifty at this juncture remain at: 25167 (Father line support of Daily chart), 24919 and 24610. Closing below 25167 will be very negative for the market and can signal further down trend to continue.
Resistances for Nifty remain at: 25458 (The high that we reached today), 25589 and 25712 (Mother line resistnace). Bulls can breath a sigh of relief only above this level. A good closing above 25712 in the next week will signal a start of another round of Bull rally. We wiat and watch till then.
EU deal has tried to create a bottom and a good budget in favour of Industry, in favour of consumption and in favour of increased spending from government will significantly take things towards positive run ahead. A big bonus will be the US deal if GOI can make it happen some how within next one or 2 months can potentially unlock new limits and new levels. 1 good thing has fallen in favour of investors that is EU deal all eyes on budget now. In the meantime good positive closing tomorrow will be very helpful. Friday and Sunday (Markets are open on Sunday) are 2 key days to watch.
Disclaimer: The above information is provided for educational purpose, analysis and paper trading only. Please don't treat this as a buy or sell recommendation for the stock or index. The Techno-Funda analysis is based on data that is more than 3 months old. Supports and Resistances are determined by historic past peaks and Valley in the chart. Many other indicators and patterns like EMA, RSI, MACD, Volumes, Fibonacci, parallel channel etc. use historic data which is 3 months or older cyclical points. There is no guarantee they will work in future as markets are highly volatile and swings in prices are also due to macro and micro factors based on actions taken by the company as well as region and global events. Equity investment is subject to risks. I or my clients or family members might have positions in the stocks that we mention in our educational posts. We are not a SEBI registered Research analyst. We will not be responsible for any Profit or loss that may occur due to any financial decision taken based on any data provided in this message. Do consult your investment advisor before taking any financial decisions. Stop losses should be an important part of any investment in equity.
Niftyresistances

Nifty bounced from a support but still looking neutral to weak.Nifty today tried to bounce from the support zone existing between 25482 to 25494 region to close just under 25600 at 25585. Although it was a good bounce but still the formation on charts look weak.
If support of 25482 is broken we can see it fall further towards 25325 or even 25232 region. If the support of 25494 or 25482 is not broken and we can clear the resistnaces near 25599 and 25648 we can see Nifty march towards 25748 or 25913 range. Bulls can come back to business only after we get a closing above 25913 or 26003.
So there are lot of hurdles to clear before we Nifty Bulls can be back in business. Shadow of the cnadle right now is neutral.
Disclaimer: The above information is provided for educational purpose, analysis and paper trading only. Please don't treat this as a buy or sell recommendation for the stock or index. The Techno-Funda analysis is based on data that is more than 3 months old. Supports and Resistances are determined by historic past peaks and Valley in the chart. Many other indicators and patterns like EMA, RSI, MACD, Volumes, Fibonacci, parallel channel etc. use historic data which is 3 months or older cyclical points. There is no guarantee they will work in future as markets are highly volatile and swings in prices are also due to macro and micro factors based on actions taken by the company as well as region and global events. Equity investment is subject to risks. I or my clients or family members might have positions in the stocks that we mention in our educational posts. We are not a SEBI registered Research analyst. We will not be responsible for any Profit or loss that may occur due to any financial decision taken based on any data provided in this message. Do consult your investment advisor before taking any financial decisions. Stop losses should be an important part of any investment in equity.

Fresh 500% Tariff threat and geo-political tensions grip Nifty. Fresh Trump Tariff threat has sent investors in a tizzy and craved path for Nifty fall that we saw today. But is there more pain in store? Nifty is currently near a support level of 25864. Which is just a little away from today's closing that whic was at 25876. If we get a closing below 25864 more pain might be instore and the next support levels will be at 25740, 25639, 25544 or even 25427 (which is a channel bottom support).
Resistances for Nifty on the upper side remain at 26033 (Father line) and 26103 (Mother line). If we get a closing above 26103 the next resistnace will be at 26188 and finally channel top of 26360. A proper rally can resume only when we get a closing above 26360.
RSI is indicating that the market is already nearing oversold zone as RSI currently is 21.76. Lot of speculation is going on related to tariffs and other geo-political tensions are gripping happening in South Asia (Iran, Afghanistan, Pakistan, India and Bangladesh). Lot of geo-political tensions are unravelling in EU (Russia, Ukraine, Greenland). Another bunch lot of geo-political tensions are brewing between UAE and KSA with regards to Yeman. We all know what happened in Venenzuela and the tensions are rife due to this between China, Russia and the USA. USA captured Ships with Russian flags on it yesterday and speculators / Bears take advantage of such situation to bring down markets specially the ones moving upwards. That is what happened to Nifty today. DII was still on the buying side.
Long term investors with a horizen of 12 to 24 months will take this oppertunity to add some more blue chips in their portfolio specially with quarterly result starting next week onwards. Keep stocks with good results and strong fundamentals in radar. Most of the dips are portfolio shuffling/new investment and compounding oppertunities for long term investors. This is not a market for Short term investment and making a quick buck through F&O. Only those with patience will survive the churning that is going on as consolidation phase goes on and on in the market. Patience of people with deep focus and egle eye will be rewarded as there is nothing wrong with India's growth story. Threat from valuation perspective and geo-political factors still remains the major concern as we move deeper into 2026. It is a geo-politically volatile time. Time is not conducive for those with shallow pockets and lack patience.
Disclaimer: The above information is provided for educational purpose, analysis and paper trading only. Please don't treat this as a buy or sell recommendation for the stock or index. The Techno-Funda analysis is based on data that is more than 3 months old. Supports and Resistances are determined by historic past peaks and Valley in the chart. Many other indicators and patterns like EMA, RSI, MACD, Volumes, Fibonacci, parallel channel etc. use historic data which is 3 months or older cyclical points. There is no guarantee they will work in future as markets are highly volatile and swings in prices are also due to macro and micro factors based on actions taken by the company as well as region and global events. Equity investment is subject to risks. I or my clients or family members might have positions in the stocks that we mention in our educational posts. We are not a SEBI registered Research analyst. We will not be responsible for any Profit or loss that may occur due to any financial decision taken based on any data provided in this message. Do consult your investment advisor before taking any financial decisions. Stop losses should be an important part of any investment in equity.

Trend line resistance stopped the forward March of Nifty today.Nifty hit a solid trendline resistance today and took a halt closing flat (4.75 Points in Positive). The zone between 26202 and 26307 has 4 resistances in total as you can see them in the chart. Also note at the RSI which was in the overheated zone indicating overbought position of the market indicating the need of consolidation before next forward march.
The supports for Nifty now are near 26131, 26060 followed by Mother and Father line support at 26020 and 25939. A closing below 25939 can be indicative of weakness in the market and can plummet the Nifty towards 25841 or even 25807 levels.
Overall the sentiment will remain positive but there can be stock specific huge moves. Large cap stocks available at bargain prices should remain the prerogative of the buyers. Next closing above 26307 whenever it happens will be a superlative breakout for Nifty. Shadow of the candle is neutral currently.
Disclaimer: The above information is provided for educational purpose, analysis and paper trading only. Please don't treat this as a buy or sell recommendation for the stock or index. The Techno-Funda analysis is based on data that is more than 3 months old. Supports and Resistances are determined by historic past peaks and Valley in the chart. Many other indicators and patterns like EMA, RSI, MACD, Volumes, Fibonacci, parallel channel etc. use historic data which is 3 months or older cyclical points. There is no guarantee they will work in future as markets are highly volatile and swings in prices are also due to macro and micro factors based on actions taken by the company as well as region and global events. Equity investment is subject to risks. I or my clients or family members might have positions in the stocks that we mention in our educational posts. We will not be responsible for any Profit or loss that may occur due to any financial decision taken based on any data provided in this message. Do consult your investment advisor before taking any financial decisions. Stop losses should be an important part of any investment in equity.

Mini Trend Breakout for Nifty. With a resistance nearyby. Nifty gave a strong comeback candle on Friday with FII and DIIs both turning buyers for second straingt day and close at 25966. There is a resistance nearby if that is crossed we can have an upside. The resistnace nearby for Nifty is at 25980. If we get a closing above it next week, Nifty can sail towards next resistances 26120, 26223, 26339, 26533 and finally the trend top resistnace which is near 26651. Supports for Nifty remain near 26774 (Major mother line support), 25701, 25363, 25115 and finally Father line support is near 24992.
There is a mini trend break put as well within an overall bullish trend. Broader market may also catch up soon as many stocks are near their support or are crossing near to cross Mother father line resistances. Shadow of the candle as of now is positive.
Disclaimer: The above information is provided for educational purpose, analysis and paper trading only. Please don't treat this as a buy or sell recommendation for the stock or index. The Techno-Funda analysis is based on data that is more than 3 months old. Supports and Resistances are determined by historic past peaks and Valley in the chart. Many other indicators and patterns like EMA, RSI, MACD, Volumes, Fibonacci, parallel channel etc. use historic data which is 3 months or older cyclical points. There is no guarantee they will work in future as markets are highly volatile and swings in prices are also due to macro and micro factors based on actions taken by the company as well as region and global events. Equity investment is subject to risks. I or my clients or family members might have positions in the stocks that we mention in our educational posts. We will not be responsible for any Profit or loss that may occur due to any financial decision taken based on any data provided in this message. Do consult your investment advisor before taking any financial decisions. Stop losses should be an important part of any investment in equity.

Nifty can sail further only if trend line resistance is broken. After a tipsy turvy week Nifty has again given a good closing above the mid channel resistance and is on the verge of a major trend line breakout. If we can get a closing next week above 26071 then the next resistances for Nifty will be at 26187 and 26333. Channel top for Nifty currently is at 26676. Supports for Nifty now remain at 25896 (Major Mid channel support), 25695 is the major trend line support. Channel bottom support for Nifty is at 25342.
RSI has turned bullish and is currently at 54.4 with median resistance at 55.49. If it is crossed we can see further upsurge towards 70 or 80. Shadow of the candle for next week is neutral due to the trend line resistance and RSI median. If and when they are crossed the shadow will turn positive.
Disclaimer: The above information is provided for educational purpose, analysis and paper trading only. Please don't treat this as a buy or sell recommendation for the stock or index. The Techno-Funda analysis is based on data that is more than 3 months old. Supports and Resistances are determined by historic past peaks and Valley in the chart. Many other indicators and patterns like EMA, RSI, MACD, Volumes, Fibonacci, parallel channel etc. use historic data which is 3 months or older cyclical points. There is no guarantee they will work in future as markets are highly volatile and swings in prices are also due to macro and micro factors based on actions taken by the company as well as region and global events. Equity investment is subject to risks. I or my clients or family members might have positions in the stocks that we mention in our educational posts. We will not be responsible for any Profit or loss that may occur due to any financial decision taken based on any data provided in this message. Do consult your investment advisor before taking any financial decisions. Stop losses should be an important part of any investment in equity.


Mother line provides support to falling Nifty. Mother line or 50 EMA has provided today incredible support to Nifty which rose 111 points from low of the day to close at 25839. Still the Nifty closed 120 points below previous close. Now of the Mother line support is held we can see comeback of Nifty and rally can restart from there on. For the rally to restart we need a closing above 25930. The next resistance if we get a closing above 25930 will be 26062. Further resistance can be at 26194, 26352 and finally the channel top is near 26596. Supports for Nifty will be at 25728 (Mother Line support), Mid-Channel support is near 25608, 25338 is the final support. If this support is broken the father line support is at 24917.
Disclaimer: The above information is provided for educational purpose, analysis and paper trading only. Please don't treat this as a buy or sell recommendation for the stock or index. The Techno-Funda analysis is based on data that is more than 3 months old. Supports and Resistances are determined by historic past peaks and Valley in the chart. Many other indicators and patterns like EMA, RSI, MACD, Volumes, Fibonacci, parallel channel etc. use historic data which is 3 months or older cyclical points. There is no guarantee they will work in future as markets are highly volatile and swings in prices are also due to macro and micro factors based on actions taken by the company as well as region and global events. Equity investment is subject to risks. I or my clients or family members might have positions in the stocks that we mention in our educational posts. We will not be responsible for any Profit or loss that may occur due to any financial decision taken based on any data provided in this message. Do consult your investment advisor before taking any financial decisions. Stop losses should be an important part of any investment in equity.

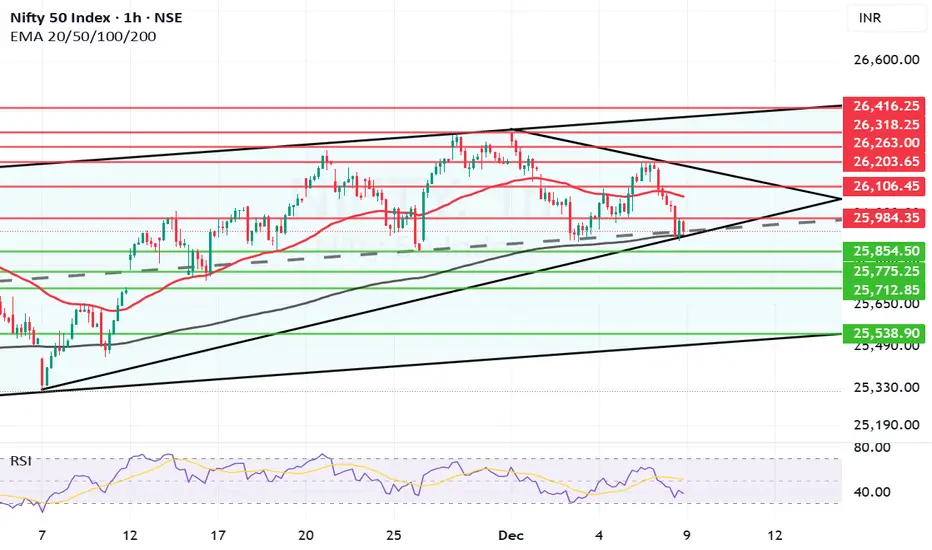
Nifty near father line support on hourly chart.After the drubbing today at browsers where Nifty ended 225.9 points below previous close has closed at 25960. Below the comfort level of 26K. The sell of was global today due to US FED meet later tonight.
Supports for Nifty are at 25915 (Major Father line support). If this support is broken Nifty will become weak and can further plummet towards 25854, 25775 or even 25712. The channel bottom support for Nifty will be near 25538.
Resistances for Nifty are at 25984, 26066 (Mother line resistance), 26203, 26263, 26318 and finally channel top resistance is near 26416.
Shadow of the candle is looking neutral despite the fall today. If the father line support at 25915 is not broken we can see a swift recovery in Nifty.
Disclaimer: The above information is provided for educational purpose, analysis and paper trading only. Please don't treat this as a buy or sell recommendation for the stock or index. The Techno-Funda analysis is based on data that is more than 3 months old. Supports and Resistances are determined by historic past peaks and Valley in the chart. Many other indicators and patterns like EMA, RSI, MACD, Volumes, Fibonacci, parallel channel etc. use historic data which is 3 months or older cyclical points. There is no guarantee they will work in future as markets are highly volatile and swings in prices are also due to macro and micro factors based on actions taken by the company as well as region and global events. Equity investment is subject to risks. I or my clients or family members might have positions in the stocks that we mention in our educational posts. We will not be responsible for any Profit or loss that may occur due to any financial decision taken based on any data provided in this message. Do consult your investment advisor before taking any financial decisions. Stop losses should be an important part of any investment in equity.
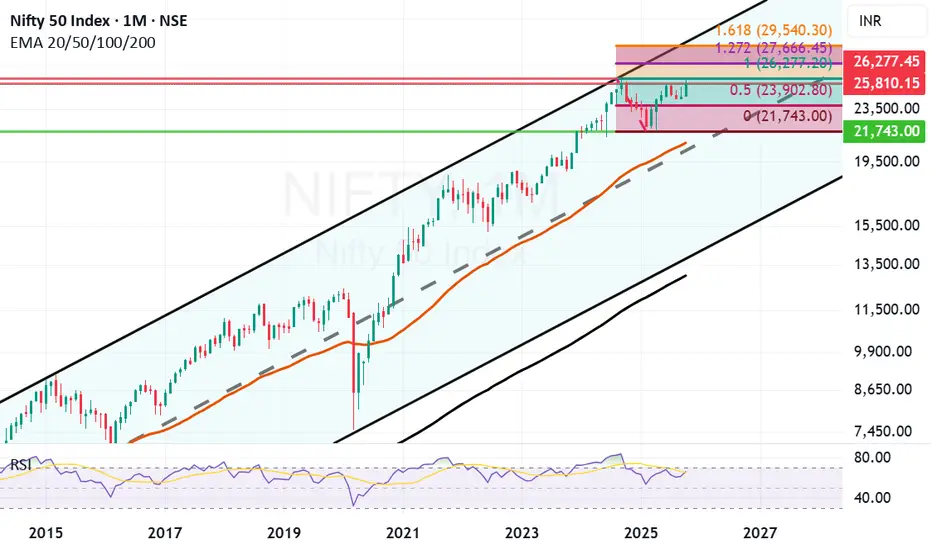
Long Term Nifty Outlook on Weekly chart. The Weekly candles indicate that Nifty is on the verge of major breakout. Once Nifty gives a closing above 26277 it's previous high the next Fibonacci target for it will be 27666 within next 12 to 16 months. If GDP numbers for upcoming quarters are similar to the one we received for Q2 that is 8.2% we may reach there earlier too.
Once we get a closing above 27666 the next long term target 24 to 36 months from now can be 29540. Supports for Nifty are at 25301 and 24622 (Mother line support on Weekly chart (50 Weeks EMA) and finally 23903. A closing below 23903 will invite the bears again and can turn down all upside projections invalid.
As of now the future looks good. There has been a solid consolidation all we need now is a proper monthly closing above previous all time high that is 26277 and recent high which was 26310.
Disclaimer: The above information is provided for educational purpose, analysis and paper trading only. Please don't treat this as a buy or sell recommendation for the stock or index. The Techno-Funda analysis is based on data that is more than 3 months old. Supports and Resistances are determined by historic past peaks and Valley in the chart. Many other indicators and patterns like EMA, RSI, MACD, Volumes, Fibonacci, parallel channel etc. use historic data which is 3 months or older cyclical points. There is no guarantee they will work in future as markets are highly volatile and swings in prices are also due to macro and micro factors based on actions taken by the company as well as region and global events. Equity investment is subject to risks. I or my clients or family members might have positions in the stocks that we mention in our educational posts. We will not be responsible for any Profit or loss that may occur due to any financial decision taken based on any data provided in this message. Do consult your investment advisor before taking any financial decisions. Stop losses should be an important part of any investment in equity.

Nifty makes ATH, Profit Booking strikes thereafter. What next?Nifty made a new ATH today exactly after 14 Months although it is a point to rejoice. On the hindsight there is no growth for last 14 months. Such phases do come even in a Bull market but a closing above Today's ATH that is 26310 will be the real turnaround. Sometimes the indices will not reward you for months years and on some other occasions they will cover it up in few weeks or month. Afterall it is law of averages that catches up.
Nifty has been growing from last 20 years approximately around 15% per year. Last 14 months have been lackluster so if things go well Bulls can have a field day or weeks or months in the coming times. What we need is a weekly or monthly closing above 26310. As you can see in the chart the next resistance after 26310 will be around 26433. Major major Breakout above this zone.
Supports for Nifty are near 26141, 26015, 25834 and finally Mother line support is near 25608 on the daily chart.
Disclaimer: The above information is provided for educational purpose, analysis and paper trading only. Please don't treat this as a buy or sell recommendation for the stock or index. The Techno-Funda analysis is based on data that is more than 3 months old. Supports and Resistances are determined by historic past peaks and Valley in the chart. Many other indicators and patterns like EMA, RSI, MACD, Volumes, Fibonacci, parallel channel etc. use historic data which is 3 months or older cyclical points. There is no guarantee they will work in future as markets are highly volatile and swings in prices are also due to macro and micro factors based on actions taken by the company as well as region and global events. Equity investment is subject to risks. I or my clients or family members might have positions in the stocks that we mention in our educational posts. We will not be responsible for any Profit or loss that may occur due to any financial decision taken based on any data provided in this message. Do consult your investment advisor before taking any financial decisions. Stop losses should be an important part of any investment in equity.

Relentless Profit Booking brings Nifty Further down. What next?The fall in Nifty continued today as again there was again profit booking. However the candles formed in hourly chart indicate that may be a temporary bottom is nearby. The supports nearby are at 25830, 25751 (Father line support, Major Support), 25707, 25613 and finally 25456. The resistance on the upper side for Nifty are at 25913, 25026, 25151 and finally 25288 which can be a new ATH and channel top resistance. (This will be tough to cross.)
The candle still is little bit negative to neutral and MACD is also yet to take a proper turn towards Bullish reversal so little bit of pain still might be there but you never know today's low of 25857 might also work as reversal point.
Disclaimer: The above information is provided for educational purpose, analysis and paper trading only. Please don't treat this as a buy or sell recommendation for the stock or index. The Techno-Funda analysis is based on data that is more than 3 months old. Supports and Resistances are determined by historic past peaks and Valley in the chart. Many other indicators and patterns like EMA, RSI, MACD, Volumes, Fibonacci, parallel channel etc. use historic data which is 3 months or older cyclical points. There is no guarantee they will work in future as markets are highly volatile and swings in prices are also due to macro and micro factors based on actions taken by the company as well as region and global events. Equity investment is subject to risks. I or my clients or family members might have positions in the stocks that we mention in our educational posts. We will not be responsible for any Profit or loss that may occur due to any financial decision taken based on any data provided in this message. Do consult your investment advisor before taking any financial decisions. Stop losses should be an important part of any investment in equity.
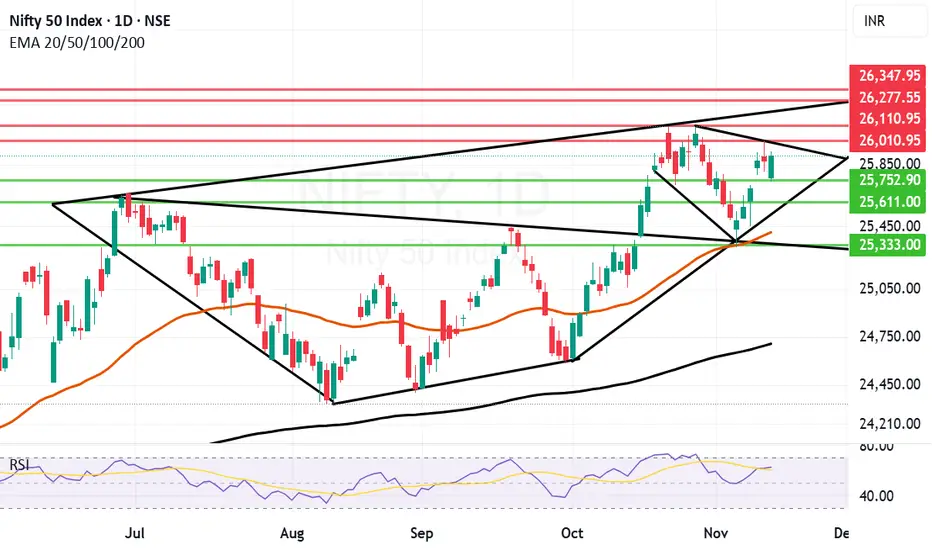
Good for a long haul but can important resistances be crossed? Nifty is good for Long haul and going towards new highs but there are few important resistances to be crossed before that can be achieved. The important resistances up and ahead are at 26010, 26110, 26277 and finally trend top above the previous ATH at 26347. The support for Nifty are at 25752, 25611, 25412 (Mother line support) and finally 25333. 25333 is an important turnaround point a closing below this will bring Nifty into bear grip. Things look ominous for an upsurge but as mentioned and seen in the chart there are few important resistances to be crossed.
To know more about Mother and Father line supports, Mother, Father and Small child theory, Trend lines, supports and resistances you can read my book THE HAPPY CANDLES WAY TO WEALTH CREATION. The book is currently rated 4.8/5 on Amazon. It is reasonably priced and it can work as a handbook to wealth creation through equity. It is a value for money book, do read it.
Disclaimer: The above information is provided for educational purpose, analysis and paper trading only. Please don't treat this as a buy or sell recommendation for the stock or index. The Techno-Funda analysis is based on data that is more than 3 months old. Supports and Resistances are determined by historic past peaks and Valley in the chart. Many other indicators and patterns like EMA, RSI, MACD, Volumes, Fibonacci, parallel channel etc. use historic data which is 3 months or older cyclical points. There is no guarantee they will work in future as markets are highly volatile and swings in prices are also due to macro and micro factors based on actions taken by the company as well as region and global events. Equity investment is subject to risks. I or my clients or family members might have positions in the stocks that we mention in our educational posts. We will not be responsible for any Profit or loss that may occur due to any financial decision taken based on any data provided in this message. Do consult your investment advisor before taking any financial decisions. Stop losses should be an important part of any investment in equity.
Nifty closed above 26,000 mark What next ?Hello Friends,
Today market was bullish and closed above 26,000 mark and what am I expecting from the Market Lets talk
Thank you

Volatile day where Nifty Bulls beat the Bears. Today we saw a volatile session in Nifty where Nifty initially collapsed to 25449 but then again rose to regain level above 25650 closing at 25694. The candle we saw today confirms a bullish trend.
Exit Poll indicative of the Government that Market likes will retain Bihar. Trump is signalling reduction of Tariff. So overall it can trigger a further up trend but you never say never in the market. Market can always surprise you but Shadow of the candles currently is positive.
The resistances for Nifty now remain at 25708, 25819, 26004, 26115, 26277, 26306 and finally the channel top remains at 26498. Supports for Nifty now remain at 25440, 25352, 25239, 24892, 24670 and 24292.
Disclaimer: The above information is provided for educational purpose, analysis and paper trading only. Please don't treat this as a buy or sell recommendation for the stock or index. The Techno-Funda analysis is based on data that is more than 3 months old. Supports and Resistances are determined by historic past peaks and Valley in the chart. Many other indicators and patterns like EMA, RSI, MACD, Volumes, Fibonacci, parallel channel etc. use historic data which is 3 months or older cyclical points. There is no guarantee they will work in future as markets are highly volatile and swings in prices are also due to macro and micro factors based on actions taken by the company as well as region and global events. Equity investment is subject to risks. I or my clients or family members might have positions in the stocks that we mention in our educational posts. We will not be responsible for any Profit or loss that may occur due to any financial decision taken based on any data provided in this message. Do consult your investment advisor before taking any financial decisions. Stop losses should be an important part of any investment in equity.

Good follow up candle but Nifty. Nifty today gave a good follow-up candle after Friday's green candle where it confirmed Mother line support. Nifty today closed at 25574. Nifty made a high of 25653 but could not hold 25650 level which was very important for further progress. Once Nifty gives a closing above 25653 now we can see further positivity in the market. The resistances for Nifty remain at 25653, 25819, 25951 and 26155. The channel top for Nifty is in the zone of 26306 to 26498 if we and when we get a closing above previous all time high of 26277. Supports for Nifty now remain at 25440, 25338 (Mother line support) and 25239. A closing below 25239 can bring further weakness which can drag Nifty towards 24892, Father line support of 24660 or even 24292 which is currently the mid channel support. As of now shadow of the candle looks positive and RSI is also turning bullish.
Disclaimer: The above information is provided for educational purpose, analysis and paper trading only. Please don't treat this as a buy or sell recommendation for the stock or index. The Techno-Funda analysis is based on data that is more than 3 months old. Supports and Resistances are determined by historic past peaks and Valley in the chart. Many other indicators and patterns like EMA, RSI, MACD, Volumes, Fibonacci, parallel channel etc. use historic data which is 3 months or older cyclical points. There is no guarantee they will work in future as markets are highly volatile and swings in prices are also due to macro and micro factors based on actions taken by the company as well as region and global events. Equity investment is subject to risks. I or my clients or family members might have positions in the stocks that we mention in our educational posts. We will not be responsible for any Profit or loss that may occur due to any financial decision taken based on any data provided in this message. Do consult your investment advisor before taking any financial decisions. Stop losses should be an important part of any investment in equity.
Nifty delicately taken the Mother line support what next?Nifty took Mother line support on Friday closed in the negative 17 points at 25492. However it closed 174 above day's low that was 25318. This means 25318 become a major support now going forward. Mother line currently is at 25328. So this 10 point zone is a banger support for Nifty. If we get a closing below 25318 there will be further weakness which can take Nifty towards 24892, Father line 24651 another major support or even mid channel support near 24318. In case 25328 is held the resistances for Nifty going upwards will be high of Friday that is 25551, 25693, 25949, 26155 and finally channel top near 26494. If we reach the channel top it will be a new All Time high.
To know how a Parallel Channel or Mother Father lines and my Mother, Father small Child theory functions or how Fundamental analysis works and how to draw charts or use Techno-Funda analysis do read my book the Happy Candles Way To Wealth Creation rated 4.8/5 on Amazon.
Disclaimer: The above information is provided for educational purpose, analysis and paper trading only. Please don't treat this as a buy or sell recommendation for the stock or index. The Techno-Funda analysis is based on data that is more than 3 months old. Supports and Resistances are determined by historic past peaks and Valley in the chart. Many other indicators and patterns like EMA, RSI, MACD, Volumes, Fibonacci, parallel channel etc. use historic data which is 3 months or older cyclical points. There is no guarantee they will work in future as markets are highly volatile and swings in prices are also due to macro and micro factors based on actions taken by the company as well as region and global events. Equity investment is subject to risks. I or my clients or family members might have positions in the stocks that we mention in our educational posts. We will not be responsible for any Profit or loss that may occur due to any financial decision taken based on any data provided in this message. Do consult your investment advisor before taking any financial decisions. Stop losses should be an important part of any investment in equity.

Nifty delicately placed near Father line. Nifty is delicately placed near the father line now. Starting to look a little oversold. There are chances that we can see a bounce from here tomorrow or next week. Bihar election results will also be looked at many as a barometer to see how the current Government is being seen by larger parts of India. Bihar is usually seen as a litmus test. A result that market would like can certainly drive the next leg of rally. If the result is against market expectation certainly we will see more downside or consolidation.
Supports for Nifty remain at: 25490 (Father line support today low was 25491), 25431 (Mid channel support is around this zone), 25314, 25151, 25024, 24886, 24674 is the channel bottom.
Resistance for Nifty on the upper side are: 25598, 25719 (Mother line resistance), 25904, 26089, 26179 currently is the channel top.
To know more about Mother Father lines and my Mother, Father small Child theory, Fundamental analysis and how to draw charts or use Techno-Funda analysis do read my book the Happy Candles Way To Wealth Creation rated 4.8/5 on Amazon.
Disclaimer: The above information is provided for educational purpose, analysis and paper trading only. Please don't treat this as a buy or sell recommendation for the stock or index. The Techno-Funda analysis is based on data that is more than 3 months old. Supports and Resistances are determined by historic past peaks and Valley in the chart. Many other indicators and patterns like EMA, RSI, MACD, Volumes, Fibonacci, parallel channel etc. use historic data which is 3 months or older cyclical points. There is no guarantee they will work in future as markets are highly volatile and swings in prices are also due to macro and micro factors based on actions taken by the company as well as region and global events. Equity investment is subject to risks. I or my clients or family members might have positions in the stocks that we mention in our educational posts. We will not be responsible for any Profit or loss that may occur due to any financial decision taken based on any data provided in this message. Do consult your investment advisor before taking any financial decisions. Stop losses should be an important part of any investment in equity.

Nifty trying to find a bottom from where it can bounce back.Nifty is trying to search bottom from where it can relaunch. The slide of Nifty continued today where it lost 165 points to close the day at 25597. The next substantial support is near 25527, 25452 and 25314. 25314 is the 50 days EMA or Mother line support. If this support is not held, it can slide further towards 25159, 24872 or even 24634 in unlikely circumstances. Resistance for Nifty remains at 25639, 25791, 25910 and 26072. Once Nifty is able to establish a bottom for relaunch the march upwards can start again. 25314 remains a very clear major level to watch for below it Nifty will become weak.
Disclaimer: The above information is provided for educational purpose, analysis and paper trading only. Please don't treat this as a buy or sell recommendation for the stock or index. The Techno-Funda analysis is based on data that is more than 3 months old. Supports and Resistances are determined by historic past peaks and Valley in the chart. Many other indicators and patterns like EMA, RSI, MACD, Volumes, Fibonacci, parallel channel etc. use historic data which is 3 months or older cyclical points. There is no guarantee they will work in future as markets are highly volatile and swings in prices are also due to macro and micro factors based on actions taken by the company as well as region and global events. Equity investment is subject to risks. I or my clients or family members might have positions in the stocks that we mention in our educational posts. We will not be responsible for any Profit or loss that may occur due to any financial decision taken based on any data provided in this message. Do consult your investment advisor before taking any financial decisions. Stop losses should be an important part of any investment in equity.

Nifty Short term resistances and Supports. Nifty came crumbling down on Profit booking and US trade deal issue not settling down even as another month goes by.
The support currently for Nifty remain near the trend line which is at 25708. If this support is broken Nifty may fall further and the next supports in line are at 25629, 25585, 25512 and a strong Father line support of 200 Hours EMA at 25455.
Resistances on the other hand for Nifty in case of any of the mentioned support is taken remain at 25841 Strong Mother line resistance of 50 Hours EMA and 25880. If these 2 resistances are crossed and we get a closing above them the next resistances in line are at 25956, 26039 and 26108.
After we get a closing above 26108 we can think of Nifty regaining the previous all-time high or even crossing it.
Disclaimer: The above information is provided for educational purpose, analysis and paper trading only. Please don't treat this as a buy or sell recommendation for the stock or index. The Techno-Funda analysis is based on data that is more than 3 months old. Supports and Resistances are determined by historic past peaks and Valley in the chart. Many other indicators and patterns like EMA, RSI, MACD, Volumes, Fibonacci, parallel channel etc. use historic data which is 3 months or older cyclical points. There is no guarantee they will work in future as markets are highly volatile and swings in prices are also due to macro and micro factors based on actions taken by the company as well as region and global events. Equity investment is subject to risks. I or my clients or family members might have positions in the stocks that we mention in our educational posts. We will not be responsible for any Profit or loss that may occur due to any financial decision taken based on any data provided in this message. Do consult your investment advisor before taking any financial decisions. Stop losses should be an important part of any investment in equity.

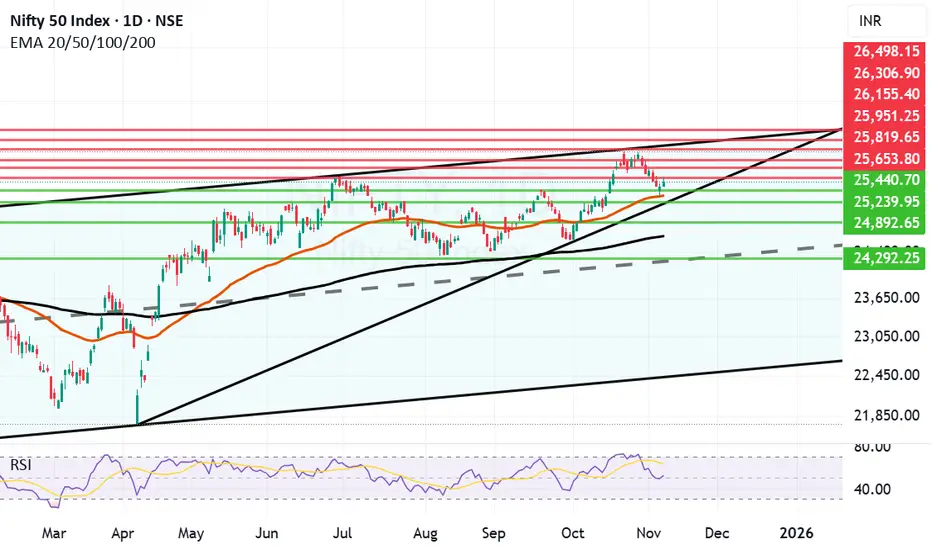
Negative closing today but it was a good monthly closing candle.Despite negative closing for last 2 days of the month it was an overall good monthly candle for Nifty. Previous highest Monthly closing for Nifty was 25810 in September 2024. This month we got a closing slightly below the same at 25722 in October 2025. Once we get a closing above previous all time high in the next month or 2 on in few months time the doors for Next Fibonacci level opens. The next Fibonacci resistance level after we get a closing above previous ATH of 26277 will be at 27666. Golden Fibonacci ratio target in few years time will be 29540.
Very strong Fibonacci support now remains at 23902. Next Fibonacci level support in case of a catastrophic event will be at 21743. Mother line of 50 Months EMA remains at 20853 which is very close to mid-channel support in case there are multiple global or regional situations creating instability.
As of now the shadow of the candle seems positive however there is a chance of little bottom testing for Nifty before we get a new all time high. Sectoral rotations and reshuffling of portfolios of HNIs, MFs and FIIs might also be on card depending on the trade deals and newly emerging tariff scenarios.
Selective stocks which have been giving good results year on year and Quarter on Quarter from Consumption, Defense, Auto, Infrastructure, Banking and Capital Goods sectors including the PSUs themes look good for long term investment currently. While previous superstars of IT, Pharma, Services and other few sectors which lead the previous rally can tend to remain laggard and sideways, specially if the trade deal agreement remain unresolved. If the trade deals with EU and US, specially US goes through even these sectors will fight back and tend to perform.
Overall it was a good month of recovery where Nifty made a comeback from the lows of 24605 to reach 26104 gaining almost 1499 points at one point. Yet it was little disappointing to close below 26K at 25722. Still the positive is that we gained 1117 points this month which is not a bad show at all. Hoping that we get a monthly closing above 26K or previous ATH soon so that doors for next phase of Bull rally can commence swiftly.
Disclaimer: The above information is provided for educational purpose, analysis and paper trading only. Please don't treat this as a buy or sell recommendation for the stock or index. The Techno-Funda analysis is based on data that is more than 3 months old. Supports and Resistances are determined by historic past peaks and Valley in the chart. Many other indicators and patterns like EMA, RSI, MACD, Volumes, Fibonacci, parallel channel etc. use historic data which is 3 months or older cyclical points. There is no guarantee they will work in future as markets are highly volatile and swings in prices are also due to macro and micro factors based on actions taken by the company as well as region and global events. Equity investment is subject to risks. I or my clients or family members might have positions in the stocks that we mention in our educational posts. We will not be responsible for any Profit or loss that may occur due to any financial decision taken based on any data provided in this message. Do consult your investment advisor before taking any financial decisions. Stop losses should be an important part of any investment in equity.
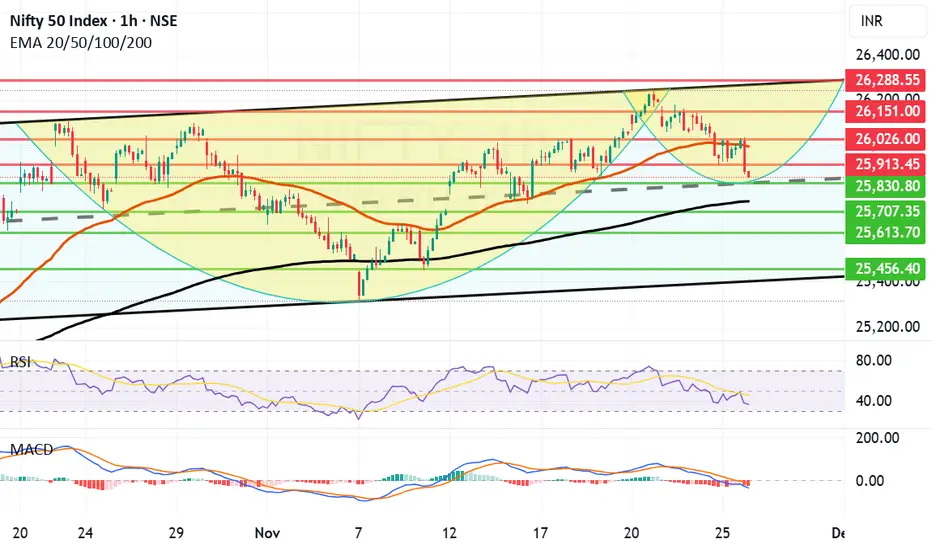
Momentum building but 2 tough resistances ahead before new ATH. Momentum is building in Nifty towards making a new All time high but there are 2 very important resistances to cross before Nifty can scale a new high.
One critical resistance will be 26104 which is the 1 year high. Today again Nifty came close to this level but receded thereafter after making a day high of 26097. If we are able to cross this level the previous ATH of 26277 will act as a ferocious resistance which will not be easy to cross on closing basis. If this will be crossed channel top seems to be near 26424. Trend top for medium term seems to be 26913.
Supports for Nifty at this juncture will be at 25984, 25845 (Mother line support of Hourly EMA), Mid-channel support seems to be near 25694. Father line strong support of hourly EMA seems to be near 25396 and channel bottom seems to be near 25232.
shadow of the candles is neutral but if we get a closing above 26104 it can become very positive.
As a Fresh rally dawns upon us it is mandatory to study and understand investing before you put your hard earned money on equity. I would recommend my book THE HAPPY CANDLES WAY TO WEALTH CREATION at this juncture so that you are able to make a conscious and strong financial decisions while investing in equity.
Disclaimer: The above information is provided for educational purpose, analysis and paper trading only. Please don't treat this as a buy or sell recommendation for the stock or index. The Techno-Funda analysis is based on data that is more than 3 months old. Supports and Resistances are determined by historic past peaks and Valley in the chart. Many other indicators and patterns like EMA, RSI, MACD, Volumes, Fibonacci, parallel channel etc. use historic data which is 3 months or older cyclical points. There is no guarantee they will work in future as markets are highly volatile and swings in prices are also due to macro and micro factors based on actions taken by the company as well as region and global events. Equity investment is subject to risks. I or my clients or family members might have positions in the stocks that we mention in our educational posts. We will not be responsible for any Profit or loss that may occur due to any financial decision taken based on any data provided in this message. Do consult your investment advisor before taking any financial decisions. Stop losses should be an important part of any investment in equity.

Nifty sustains the trendline Breakout on Muhurat day trading. Nifty sustained the trendline breakout gained earlier this week on Flattish trade on Muhurat day. After making a high of 25934 Nifty ended at 25868. Supports for Nifty are at 25652 and 25370. Below this level there is a Mother line support at 25087. Something to worry about is the upcoming resistances 26015, 26277 and 26484 (Golden Fibonacci ratio resistance). If these 3 resistances are crossed and Nifty can go towards 27K or even reach 27394 which can be the new trend top within this Vikram Samvat year if everything goes in line with and in favour of current trend. Wish you all a fabulous Financial success in this festive season and beyond it.
Disclaimer: The above information is provided for educational purpose, analysis and paper trading only. Please don't treat this as a buy or sell recommendation for the stock or index. The Techno-Funda analysis is based on data that is more than 3 months old. Supports and Resistances are determined by historic past peaks and Valley in the chart. Many other indicators and patterns like EMA, RSI, MACD, Volumes, Fibonacci, parallel channel etc. use historic data which is 3 months or older cyclical points. There is no guarantee they will work in future as markets are highly volatile and swings in prices are also due to macro and micro factors based on actions taken by the company as well as region and global events. Equity investment is subject to risks. I or my clients or family members might have positions in the stocks that we mention in our educational posts. We will not be responsible for any Profit or loss that may occur due to any financial decision taken based on any data provided in this message. Do consult your investment advisor before taking any financial decisions. Stop losses should be an important part of any investment in equity.
