Good Closing By Nifty On Hourly ChartNifty has finally closed above the Mother and Father resistance line on the hourly chart. We have tried to draw the Fibonacci retracement based on recent movements of Nifty which can be seen in the chart. We can clearly see the places from where Nifty found resistance recently where Fibonacci lines and places where Nifty took support where also Fibonacci lines.
To know more about Fibonacci retracement and use them for trading/investing you can read my book THE HAPPY CANDLES WAY TO WEALTH CREATION. In this book you can also know more about Trend lines, Supports, Resistances, Mother line and Father line and to draw the same on your chart and for learning Techo-Funda analysis read my Book THE HAPPY CANDLES WAY TO WEALTH CREATION. Heart of the book is my Mother, Father and Small child theory which makes investment easy for those who understand it an use it in their analysis. The book is available on Amazon and will help you in your investing journey whether you are a seasoned investor or a new beginner. The chapters in the book are mostly standalone. The book is rated 4.8/5 on Amazon. It is a value for money book priced at Rs.349/- (Delivery charges extra as charged by Amazon).
Now the next Fibonacci level resistances for Nifty will be at: 24994(Tough Trend line resistnace and Fibonacci resistance, 25152, 25378 and 25669. Above 25669 closing the major Bull run can begin which can take Nifty towards 26K+ levels indicated in the chart.
Mother line and Father line are both supports as of now these are at 24760 and 24783. So the zone between 24760 and 24783 becomes a very strong support zone.
Fibonacci supports for Nifty will be at: 24645 and 24337. A closing below 24337 will create a bear grip on the market which can drag if further downwards.
As of now the shadow of the candles is looking positive and green in colour.
Disclaimer: The above information is provided for educational purpose, analysis and paper trading only. Please don't treat this as a buy or sell recommendation for the stock or index. The Techno-Funda analysis is based on data that is more than 3 months old. Supports and Resistances are determined by historic past peaks and Valley in the chart. Many other indicators and patterns like EMA, RSI, MACD, Volumes, Fibonacci, parallel channel etc. use historic data which is 3 months or older cyclical points. There is no guarantee they will work in future as markets are highly volatile and swings in prices are also due to macro and micro factors based on actions taken by the company as well as region and global events. Equity investment is subject to risks. I or my clients or family members might have positions in the stocks that we mention in our educational posts. We will not be responsible for any Profit or loss that may occur due to any financial decision taken based on any data provided in this message. Do consult your investment advisor before taking any financial decisions. Stop losses should be an important part of any investment in equity.
Niftyshort

Nifty: Correction aheadNifty is likely to correct lower towards 23400-23000 zone before resuming up.

Nifty Spot Daily Trend Analysis from April 25, 2025Technical Outlook:
Nifty Spot is approaching a potential resistance near the Gann 720° level at 24,539. A minor correction appears likely, and we are currently awaiting short signal confirmation from one of our proprietary indicators. Should a decline occur, the index may find support around the Sine Wave level of 23,398. A break below this level could suggest a continuation of the bearish momentum.
At present, most indicators are still trending upwards. However, the bar formations on the chart hint at a possible reversal. Once the MastersSignal confirms a short setup, we will reassess confluence around the Gann 720° value to strengthen conviction.
Disclaimer: This is my personal technical view. Traders should conduct their own analysis and implement strict risk management before initiating any trades.

#16 April Nifty50 trade zone
#Nifty50
99% working trading plan
👉Gap up open 23418 above & 15m hold after positive trade target 23482, 23640
👉Gap up open 23418 below 15 m not break upside after nigetive trade target 23262, 23188
👉Gap down open 23262 above 15m hold after positive trade target 23418 , 23482
👉Gap down open 23262 below 15 m not break upside after nigetive trade target 23188, 23084
💫big gapdown open 23188 above hold 1st positive trade view
💫big Gapup opening 23482 below nigetive trade view
📌 Trade plan for education purpose I'm not responsible your trade
More education following me

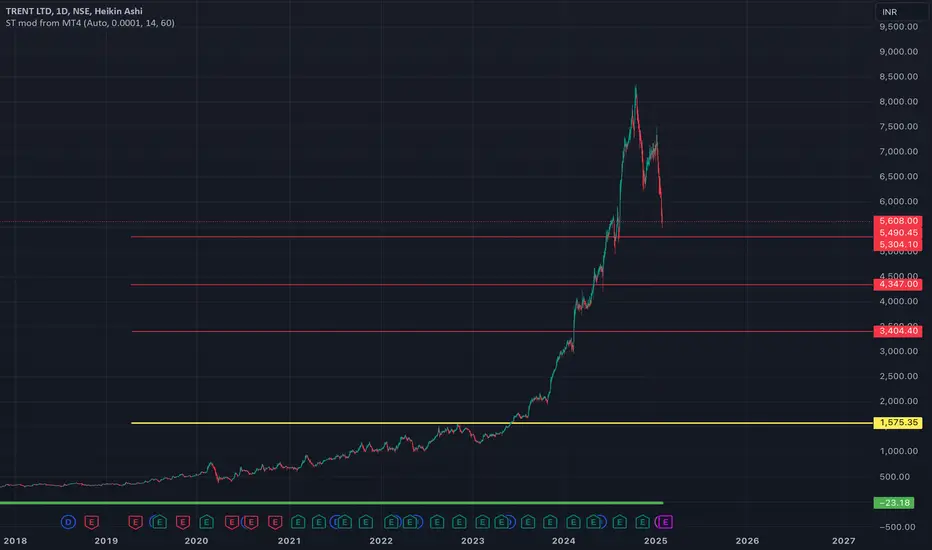
Short The current market price of the stock at 5,490, is significantly inflated compared to its estimated intrinsic value of approximately 1,555, based on the current EPS of 14.43 and the P/E ratio of 107.84. This stark discrepancy suggests that the stock is trading well above its fundamental worth, implying that it may be overvalued.
Such a valuation could be driven by overly optimistic market sentiment or speculative buying, especially given that we are in an environment where market prices have reached unprecedented levels not seen in recent history. If the market corrects, as many analysts anticipate, the stock price could face a significant downward adjustment, leading to what some are predicting could be a bloodbath in the near future.
This scenario highlights the disconnect between the stock’s price and its true intrinsic value, suggesting that the market may be overpricing future growth prospects, or investors are too focused on short-term factors rather than the company’s actual earnings performance and financial health.
ShortI am currently reassessing my targets for the Nifty. If the level of 23,080 is breached and the index closes below this support, I will adjust my target to around 20,200, as this would indicate a more significant market correction is underway.
This level aligns with the 50% Fibonacci retracement of the recent rally, which further strengthens the case for this correction. In my view, this level is not only plausible but inevitable, given the current market dynamics.
The broader market is signaling a potential major top, which suggests that the risk of further downside is increasing. In this environment, simply averaging into the market can be highly risky, as it may expose investors to larger losses if the market continues to decline.
Instead, I recommend adopting a more strategic approach to portfolio construction, focusing on calculated risks. This means selectively building positions based on strong, risk-adjusted opportunities rather than committing large capital indiscriminately. It’s essential to have a clear risk management plan in place, especially in volatile conditions like the current market environment.

ShortFor the past three months, I’ve been closely monitoring the market, anticipating a downturn ever since the formation of the Head and Shoulders (H&S) pattern. As predicted, the market has indeed experienced a decline. A decisive close below the 20,080 level would likely trigger an accelerated sell-off, pushing the market towards the next key support zone around 21,900.
Looking ahead, there’s a strong possibility of a deeper correction, with a potential drop towards the 19,200 range in the coming weeks or months. This correction could present an opportunity for those who are prepared to enter at more favorable levels.
It’s crucial to recognize that the current market environment is a classic trap for speculators. The temptation to jump in and chase market moves, especially during volatile periods, can lead to poor entry points and significant losses. Patience is key; it’s far more advantageous to wait for optimal buying levels rather than succumbing to the urge to act impulsively.
The most prudent approach now is to stay disciplined, avoid chasing rallies, and instead look for solid entry points when the market shows signs of stabilizing. Risk management should be a top priority, and investors should always be prepared for potential volatility and unexpected market movements. In these types of conditions, making informed decisions based on solid technical analysis and market structure is critical, rather than getting swayed by short-term noise or emotions.
The market will offer opportunities in time, but it’s essential to remember that timing and patience often make the difference between success and failure in volatile markets.

NIFTY Crash Coming or Minor Pullback?NSE:NIFTY gave a monthly negative close after a clear 5 wave rise. Does it mean we are going to see a crash or it might be just a regular pullback? In this video, I have covered both alternatives with possible levels to watch out for.

NIFTY trading precariously - Down move head?NSE:NIFTY daily chart is looking bearish with multiple confluences signaling down move.
Trend line break
Head and Shoulders
5 waves down
If we get a negative close below H&S neckline then it would be second close below neckline and might trigger downfall. On the positive side, ideally we should see a deeper retracement of the 5 waves down-move before the down slide starts. At the minimum 38.2% which would also coincide with downward sloping 20 day moving average, currently around 25300.
Would this happen or not, only time will tell.

Nifty Next MoveNifty almost gave a massive down trend its likely a retracement and we can see its already brake a trend line liquidity we can expect 60 %retracement or full retracement as Extreme ob area we can expect buy area from these ob areas
happy trading 🥰
📌 Please support me with your likes 🤞🏻 and comments 💬 to motivate me to share more analysis with you and share your any opinion about the possible trend of this chart with me !
Best Regards , Davis 🥰
Hit the like 🤞🏻 button to !! Motive some energy !!🥇
📌 Note :
⨻ Check the live market updates and analysis yourself before buy 📈🔺 or sell 📉🔻
⨺ Am not giving any advisory or signals its just my idea for upgrade my knowledge 📚 in trading
⨹ This is my pre and post market analysis to improve my trading journey 🚀
⨂ Am Not suggesting anyone to buy or sell ❌ am just giving my views 👀
⫸ You are responsible for your trading ✅ not me ❌ ⫷
HAPPY TRADING 🥰

Nifty Positional Trading PlanThe market continued to consolidate while maintaining its upward momentum
for the ninth consecutive session and hit a new Nifty 50 closing high on 28th August.
The rise of 0. 14 per cent to 25,052 points formed a doji like
candlestick pattern indicating consolidation and indecision among buyers and
sellers on future market trends. US stock markets fell across the board
overnight and Asia opened today with a correction, creating instability in the domestic market. The bulls may weaken after consecutive rallies and the
market is expected to remain consolidated on the monthly F&O expiry date.
Important resistance above is at 25, 100 pips,
while short-term key support
appears at 24,950 pips, at 5-day EMA level.
Nifty Options
For call option data, the highest number of open positions is at 25,500 strike, which can act as a key
resistance level for Nifty in the short term. In put options, the highest number of open positions is at
25,000 strike, which can act as a key support level for Nifty.
August F&O expires and can be shifted to September F&O to open new positions. Longs have shown weakness and remain short for the next few
sessions, today one can focus on NIFTY SEP 24500 PE and enter new position at 135-150 with scheduled profit of 15%.

Nifty Levels For 1st August-2nd AugustImportant support and Resistance Levels For Nifty.
When Market touches the level, the price action plays important roles.
For More Learning Reach out to us.

Nifty Update for next week 22 July - 26 JulyHello Traders,
Checkout the latest update on Nifty for upcoming week. Also note down they levels we have mentioned in our video

Quick Update on Nifty Hello Traders,
Checkout the quick update on Nifty and check our previous video what we told you in yesterday's video

Quick Update on NiftyHello Traders,
Checkout the quick update on Nifty. We have posted 24800-25100 levels in our previous posts. So look at previous analysis also. We are hoping a downfall from red zone

Nifty & banknifty June & July 2024Both nifty and banknifty are making a hanging man pattern on weekly chart, which is indicating a caution ahead in the market as the general budget will also be presented in July month . Be ready for the corrective declines and cash to get new holdings and exit from weak fundamental and oversold category stocks.

Down Trend start, Next Target is the Channel Bottom.Nifty 50 coming down side, because Trendline breakout is the one of the Confirmation and also did not closing above the Channel Pattern.
I want to help people to Make Profit all over the World.
Refer this link :

nifty short analysis As we can see in the chart symmetrical triangle pattern are creating in nifty.
risk reward mentioned in chart
p.s. not a trading advice.

NIFTY VIEW , SELL YOUR HOLDINGSif you have any holdings make sure you book your profits. you have to know when to book profits and when to not.

Nifty Downtrend Consolidation 30-10-23Hey Folks My nifty Update is here
As we can see we are retestion the previous low of 25th october and can see the sellers moving in .We can see lots of side ways action for some days or maybe more downward continuation
As we can see the rsi levels are oversold buyers should starting to develop the interest but for short term my target is around 18900 like i can see it going there in monday if we didnt get some news that may reverse the trend

Nifty - Ready for another dropNSE:NIFTY
NSE:NIFTY1!
NSEIX:NIFTY1!
Nifty - Seems like its ready for final correction wave.
for educational purposes only

NIFTY 11.09.2023 LEVELNifty Spot : 19819.95
Dear Followers Kindly Don't Take Any Buy or Sell Trades Today... Please Watch My Option Level One Week.
Draw Buy, Sl, T1 to T5 Lines In Your Broker Application
Trailing Purpose Only.
Option Strike : 19800 CE :
Buy At : 98, Sl : 64
Target : 122
Target : 147
Target : 172
Target : 196
Target : ++++++++
Option Strike 20150 PE :
Buy At : 95, Sl :62
Target : 119
Target : 143
Target : 166
Target : 196
Target : +++++++++
Every Target Is An Entry Point. First You Conform The Trend..
Market Goes Uptrend Or Downtrend. Then Only You Entre or buy The Strike.
If You Enter Stop Loss is Below The Target 20 To 30 Points.. Otherwise You Loss The Money.
Kindly Watch My Break Even Point. Every Day.
Above The Break Even Point UPTREND Starts
Below The Break Even Point DOWNTREND Starts.
Don"t Enter Blindly.

NIFTY--Up or Down??The nifty index is at important zone of support..price tested the same zone multiple times and now showing strong bullishness towards upside.
If this rally continues price will again reach to the top side..
If price breaks the support and retest or retrace will enter in in short side.
wait until break above or break below to continue upside or bottom side.
