Nifty Short term resistances and Supports. Nifty came crumbling down on Profit booking and US trade deal issue not settling down even as another month goes by.
The support currently for Nifty remain near the trend line which is at 25708. If this support is broken Nifty may fall further and the next supports in line are at 25629, 25585, 25512 and a strong Father line support of 200 Hours EMA at 25455.
Resistances on the other hand for Nifty in case of any of the mentioned support is taken remain at 25841 Strong Mother line resistance of 50 Hours EMA and 25880. If these 2 resistances are crossed and we get a closing above them the next resistances in line are at 25956, 26039 and 26108.
After we get a closing above 26108 we can think of Nifty regaining the previous all-time high or even crossing it.
Disclaimer: The above information is provided for educational purpose, analysis and paper trading only. Please don't treat this as a buy or sell recommendation for the stock or index. The Techno-Funda analysis is based on data that is more than 3 months old. Supports and Resistances are determined by historic past peaks and Valley in the chart. Many other indicators and patterns like EMA, RSI, MACD, Volumes, Fibonacci, parallel channel etc. use historic data which is 3 months or older cyclical points. There is no guarantee they will work in future as markets are highly volatile and swings in prices are also due to macro and micro factors based on actions taken by the company as well as region and global events. Equity investment is subject to risks. I or my clients or family members might have positions in the stocks that we mention in our educational posts. We will not be responsible for any Profit or loss that may occur due to any financial decision taken based on any data provided in this message. Do consult your investment advisor before taking any financial decisions. Stop losses should be an important part of any investment in equity.
Niftyshorttermanalysis

Nifty Short Term Analysis: Nifty Next Week. Nifty on chart looks very close to being oversold. some It and few Pharma companies are reaching the range were they seem oversold but when the chips are down they can stay that way for a long time. So we cant be sure if the fall will continue or persist. But some IT companies are already trading at mouth watering levels irrespective of H1B visa restriction/fee hike announcements. Pharma manufacturers have also taken the fall due to 100% Tariff on pharma announcement. However the point to be noted is that majority of Indian Pharma export to US is generic in nature and generic pharma is exempt from Tariff! Auto sector was still doing quite well in comparison. There is a new related to 20% stake sale to foreign investors in PSU Banks. Additionally there is a news related of Mega-merger of PSU Banks. Most of Auto purchase whether institutional or personal or corporate happens via Auto loans. So those who provide these loans can benefit. With reduction of GST and relief on Income tax front consumption will also increase. There are many NBFC which can also benefit because there is an increasing trend in buying goods on loan along with holidaying and leisure on loans. Defence spending is also set to increase for sure with ongoing tense environment in the neighbourhood. These are the sectors in my opinion which one must look at. With all these things in mind medium term outlook and long term outlook for India still remains positive.
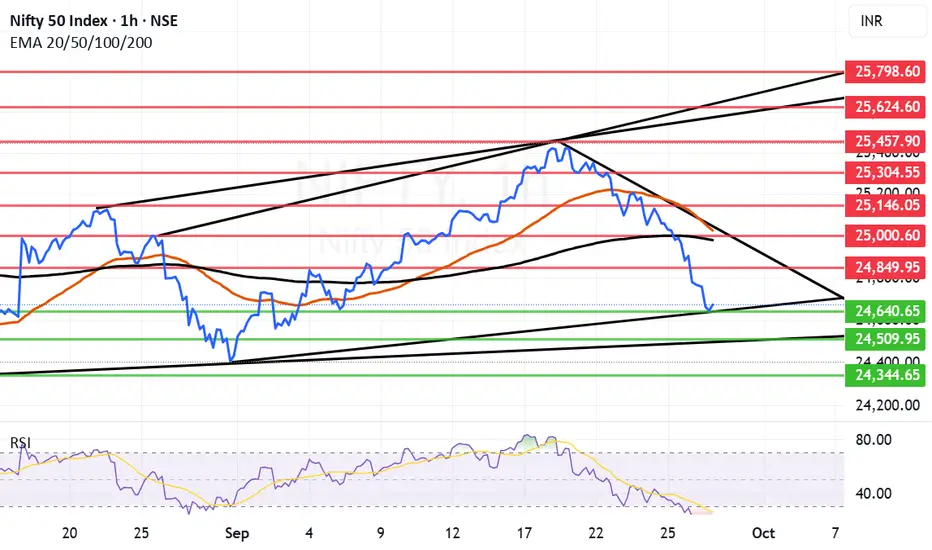
Resistance zone for Nifty with short term perspective seem to be at: 24849, 24980 is the father line, 25000 is an important resistance level and 25026 is the mother line. All the three resistances are close by. So once we get a closing above 25026 things will smoothen out and move towards 25146 or even 25304+ levels.
Support level for Nifty with short term perspective are at: 24640, 24509 and 24344.
Disclaimer: The above information is provided for educational purpose, analysis and paper trading only. Please don't treat this as a buy or sell recommendation for the stock or index. The Techno-Funda analysis is based on data that is more than 3 months old. Supports and Resistances are determined by historic past peaks and Valley in the chart. Many other indicators and patterns like EMA, RSI, MACD, Volumes, Fibonacci, parallel channel etc. use historic data which is 3 months or older cyclical points. There is no guarantee they will work in future as markets are highly volatile and swings in prices are also due to macro and micro factors based on actions taken by the company as well as region and global events. Equity investment is subject to risks. I or my clients or family members might have positions in the stocks that we mention in our educational posts. We will not be responsible for any Profit or loss that may occur due to any financial decision taken based on any data provided in this message. Do consult your investment advisor before taking any financial decisions. Stop losses should be an important part of any investment in equity.
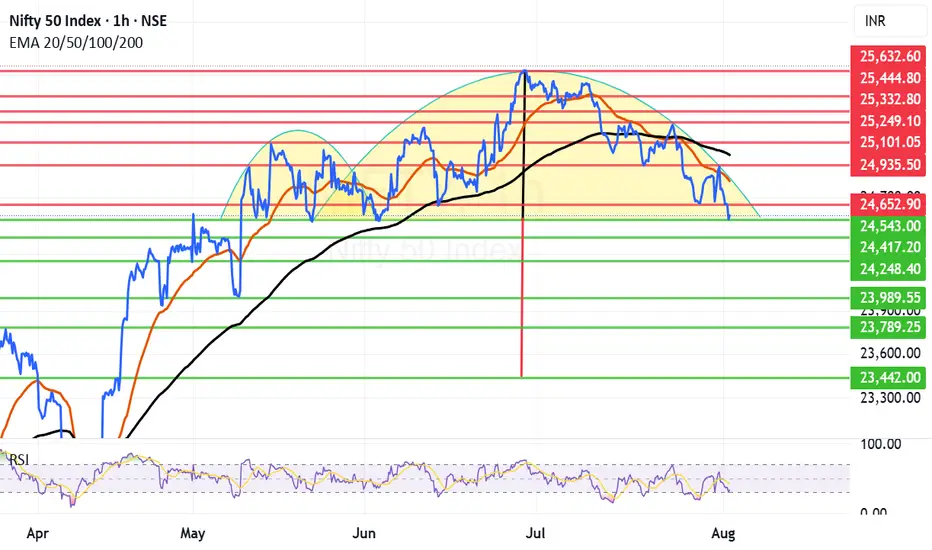
Reverse cup and Handle kind of structure formed in NiftyIn the short term time frame Nifty is seen to be forming reverse cup and handle kind of structure this is considered very bearish structure. However for this bear fest to manifest Nifty needs to close below 24543 or 24417. These 2 levels can save Nifty if not we will see it going into the bear grip.
Thus the most important supports for Nifty remain at 24543 and 24417. Below this level the supports for Nifty will be at 24248, 23989, 23789 and finally major support are is near 23442.
Important resistance areas for Nifty remain at 24652, 24821 (Mother Line Resistance), 24935, 25011 (Father Line Resistance), 25101 and finally 25249. Above 25249 Bulls can become very active.
Till the trade deal chess board and Tariffs do not relent or there is some other very important positive news Nifty will remain under pressure. Let us hope that 24253 or 24417 save us. Long term outlook on Nifty still remains positive. Long term investors should look at the tariff related event as a news that will slowly subside and give way to the Bullish outlook which has been prevailing in the market for decades all together.
Disclaimer: The above information is provided for educational purpose, analysis and paper trading only. Please don't treat this as a buy or sell recommendation for the stock or index. The Techno-Funda analysis is based on data that is more than 3 months old. Supports and Resistances are determined by historic past peaks and Valley in the chart. Many other indicators and patterns like EMA, RSI, MACD, Volumes, Fibonacci, parallel channel etc. use historic data which is 3 months or older cyclical points. There is no guarantee they will work in future as markets are highly volatile and swings in prices are also due to macro and micro factors based on actions taken by the company as well as region and global events. Equity investment is subject to risks. I or my clients or family members might have positions in the stocks that we mention in our educational posts. We will not be responsible for any Profit or loss that may occur due to any financial decision taken based on any data provided in this message. Do consult your investment advisor before taking any financial decisions. Stop losses should be an important part of any investment in equity.
Nifty Short Term Analysis. Nifty today has given a poor closing below 200 days EMA but the only saving grace can be that the closing is just above Mid-Channel support of 23500 and Important Fibonacci support of 23263.
These Two supports are broken then more hell can break loose and we can get to see the next Fibonacci supports being tested. The next Fibonacci supports can be near 22509 or 21585. On the positive side if either of the support is held and then we can see a new rally in Nifty wit resistances at 24718 and 25347. It looks like Nifty will take some time to reach new highs as the the mode is bottom searching and consolidation as of now.
Fresh rally and Bullish recovery can start only after we get a closing above these 2 levels. However, this can be a good time to go long by picking good blue chip stocks available at good valuations.
Disclaimer: The above information is provided for educational purpose, analysis and paper trading only. Please don't treat this as a buy or sell recommendation for the stock. We do not guarantee any success in highly volatile market or otherwise. Stock market investment is subject to market risks which include global and regional risks. We will not be responsible for any Profit or loss that may occur due to any financial decision taken based on any data provided in this message.
