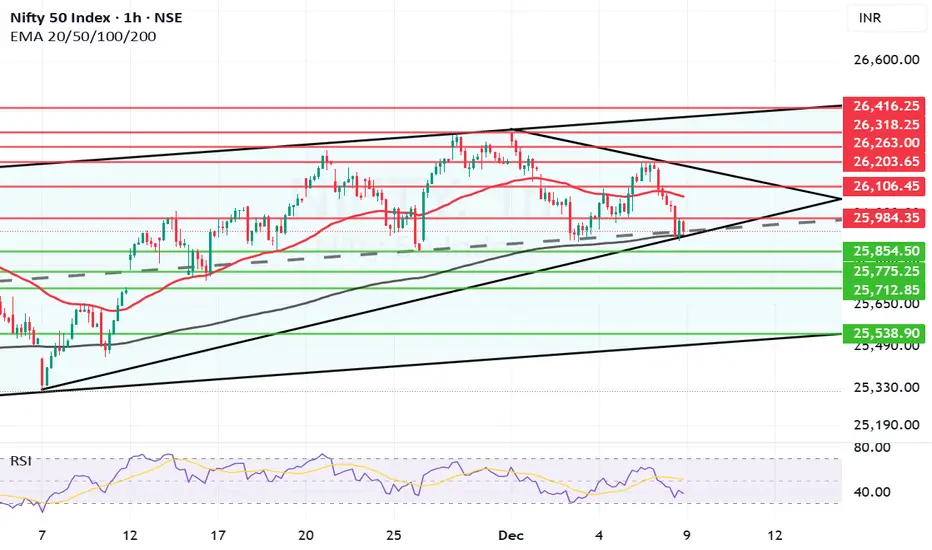
Nifty near father line support on hourly chart.After the drubbing today at browsers where Nifty ended 225.9 points below previous close has closed at 25960. Below the comfort level of 26K. The sell of was global today due to US FED meet later tonight.
Supports for Nifty are at 25915 (Major Father line support). If this support is broken Nifty will become weak and can further plummet towards 25854, 25775 or even 25712. The channel bottom support for Nifty will be near 25538.
Resistances for Nifty are at 25984, 26066 (Mother line resistance), 26203, 26263, 26318 and finally channel top resistance is near 26416.
Shadow of the candle is looking neutral despite the fall today. If the father line support at 25915 is not broken we can see a swift recovery in Nifty.
Disclaimer: The above information is provided for educational purpose, analysis and paper trading only. Please don't treat this as a buy or sell recommendation for the stock or index. The Techno-Funda analysis is based on data that is more than 3 months old. Supports and Resistances are determined by historic past peaks and Valley in the chart. Many other indicators and patterns like EMA, RSI, MACD, Volumes, Fibonacci, parallel channel etc. use historic data which is 3 months or older cyclical points. There is no guarantee they will work in future as markets are highly volatile and swings in prices are also due to macro and micro factors based on actions taken by the company as well as region and global events. Equity investment is subject to risks. I or my clients or family members might have positions in the stocks that we mention in our educational posts. We will not be responsible for any Profit or loss that may occur due to any financial decision taken based on any data provided in this message. Do consult your investment advisor before taking any financial decisions. Stop losses should be an important part of any investment in equity.
Niftysupports
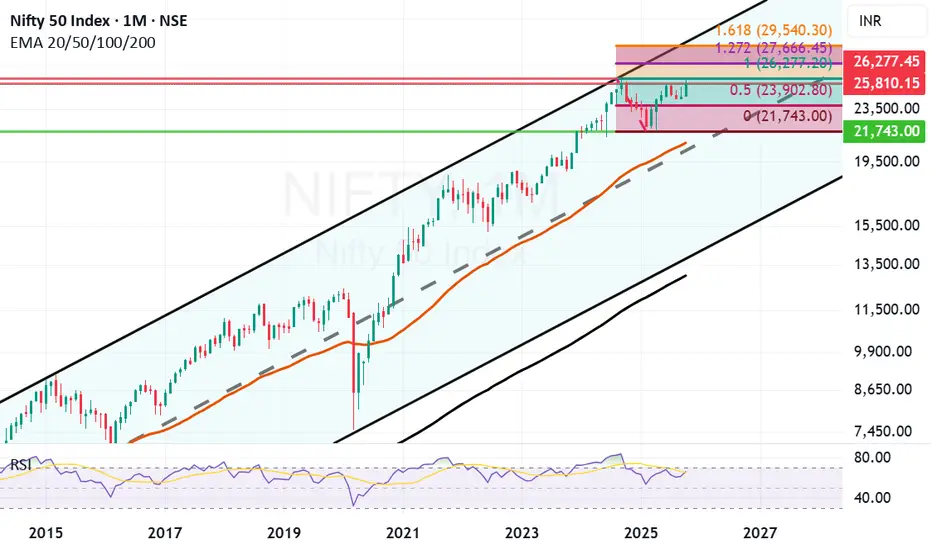
Long Term Nifty Outlook on Weekly chart. The Weekly candles indicate that Nifty is on the verge of major breakout. Once Nifty gives a closing above 26277 it's previous high the next Fibonacci target for it will be 27666 within next 12 to 16 months. If GDP numbers for upcoming quarters are similar to the one we received for Q2 that is 8.2% we may reach there earlier too.
Once we get a closing above 27666 the next long term target 24 to 36 months from now can be 29540. Supports for Nifty are at 25301 and 24622 (Mother line support on Weekly chart (50 Weeks EMA) and finally 23903. A closing below 23903 will invite the bears again and can turn down all upside projections invalid.
As of now the future looks good. There has been a solid consolidation all we need now is a proper monthly closing above previous all time high that is 26277 and recent high which was 26310.
Disclaimer: The above information is provided for educational purpose, analysis and paper trading only. Please don't treat this as a buy or sell recommendation for the stock or index. The Techno-Funda analysis is based on data that is more than 3 months old. Supports and Resistances are determined by historic past peaks and Valley in the chart. Many other indicators and patterns like EMA, RSI, MACD, Volumes, Fibonacci, parallel channel etc. use historic data which is 3 months or older cyclical points. There is no guarantee they will work in future as markets are highly volatile and swings in prices are also due to macro and micro factors based on actions taken by the company as well as region and global events. Equity investment is subject to risks. I or my clients or family members might have positions in the stocks that we mention in our educational posts. We will not be responsible for any Profit or loss that may occur due to any financial decision taken based on any data provided in this message. Do consult your investment advisor before taking any financial decisions. Stop losses should be an important part of any investment in equity.

Nifty makes ATH, Profit Booking strikes thereafter. What next?Nifty made a new ATH today exactly after 14 Months although it is a point to rejoice. On the hindsight there is no growth for last 14 months. Such phases do come even in a Bull market but a closing above Today's ATH that is 26310 will be the real turnaround. Sometimes the indices will not reward you for months years and on some other occasions they will cover it up in few weeks or month. Afterall it is law of averages that catches up.
Nifty has been growing from last 20 years approximately around 15% per year. Last 14 months have been lackluster so if things go well Bulls can have a field day or weeks or months in the coming times. What we need is a weekly or monthly closing above 26310. As you can see in the chart the next resistance after 26310 will be around 26433. Major major Breakout above this zone.
Supports for Nifty are near 26141, 26015, 25834 and finally Mother line support is near 25608 on the daily chart.
Disclaimer: The above information is provided for educational purpose, analysis and paper trading only. Please don't treat this as a buy or sell recommendation for the stock or index. The Techno-Funda analysis is based on data that is more than 3 months old. Supports and Resistances are determined by historic past peaks and Valley in the chart. Many other indicators and patterns like EMA, RSI, MACD, Volumes, Fibonacci, parallel channel etc. use historic data which is 3 months or older cyclical points. There is no guarantee they will work in future as markets are highly volatile and swings in prices are also due to macro and micro factors based on actions taken by the company as well as region and global events. Equity investment is subject to risks. I or my clients or family members might have positions in the stocks that we mention in our educational posts. We will not be responsible for any Profit or loss that may occur due to any financial decision taken based on any data provided in this message. Do consult your investment advisor before taking any financial decisions. Stop losses should be an important part of any investment in equity.

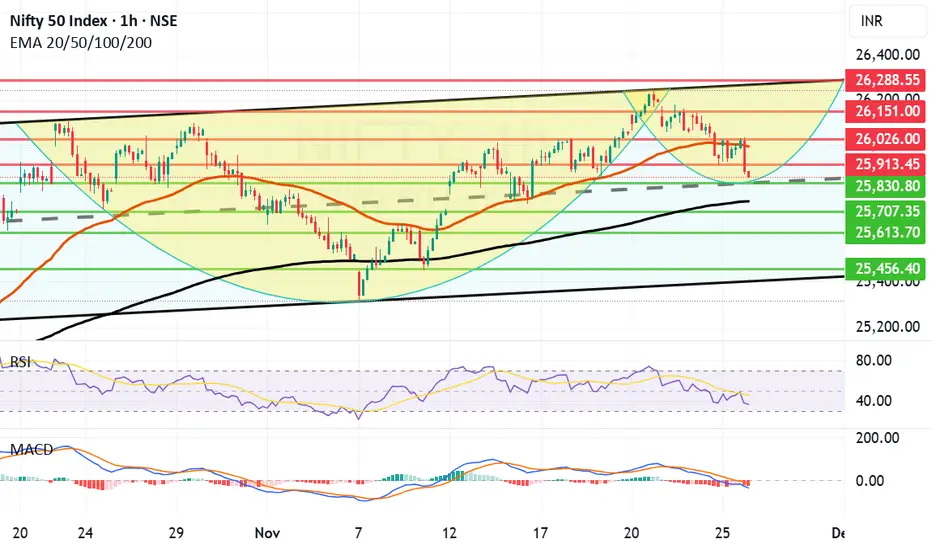
Relentless Profit Booking brings Nifty Further down. What next?The fall in Nifty continued today as again there was again profit booking. However the candles formed in hourly chart indicate that may be a temporary bottom is nearby. The supports nearby are at 25830, 25751 (Father line support, Major Support), 25707, 25613 and finally 25456. The resistance on the upper side for Nifty are at 25913, 25026, 25151 and finally 25288 which can be a new ATH and channel top resistance. (This will be tough to cross.)
The candle still is little bit negative to neutral and MACD is also yet to take a proper turn towards Bullish reversal so little bit of pain still might be there but you never know today's low of 25857 might also work as reversal point.
Disclaimer: The above information is provided for educational purpose, analysis and paper trading only. Please don't treat this as a buy or sell recommendation for the stock or index. The Techno-Funda analysis is based on data that is more than 3 months old. Supports and Resistances are determined by historic past peaks and Valley in the chart. Many other indicators and patterns like EMA, RSI, MACD, Volumes, Fibonacci, parallel channel etc. use historic data which is 3 months or older cyclical points. There is no guarantee they will work in future as markets are highly volatile and swings in prices are also due to macro and micro factors based on actions taken by the company as well as region and global events. Equity investment is subject to risks. I or my clients or family members might have positions in the stocks that we mention in our educational posts. We will not be responsible for any Profit or loss that may occur due to any financial decision taken based on any data provided in this message. Do consult your investment advisor before taking any financial decisions. Stop losses should be an important part of any investment in equity.
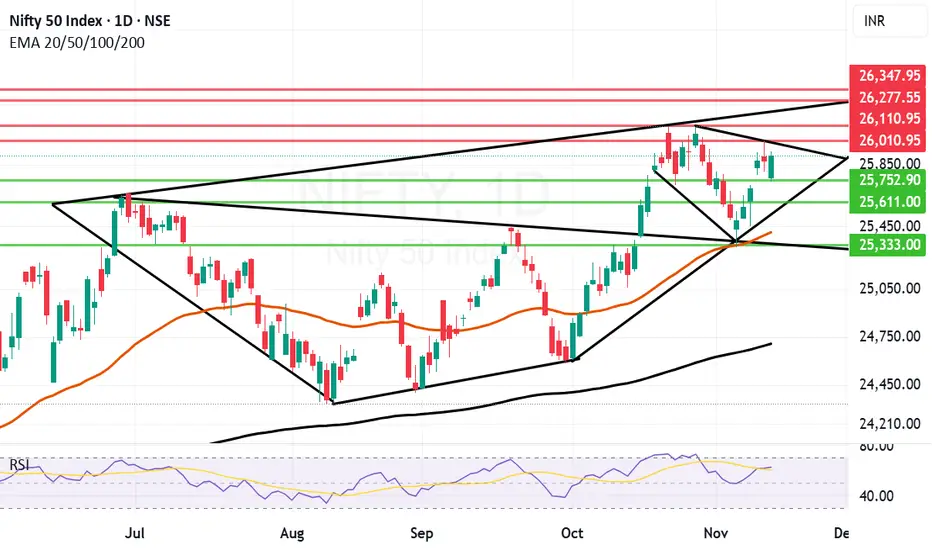
Good for a long haul but can important resistances be crossed? Nifty is good for Long haul and going towards new highs but there are few important resistances to be crossed before that can be achieved. The important resistances up and ahead are at 26010, 26110, 26277 and finally trend top above the previous ATH at 26347. The support for Nifty are at 25752, 25611, 25412 (Mother line support) and finally 25333. 25333 is an important turnaround point a closing below this will bring Nifty into bear grip. Things look ominous for an upsurge but as mentioned and seen in the chart there are few important resistances to be crossed.
To know more about Mother and Father line supports, Mother, Father and Small child theory, Trend lines, supports and resistances you can read my book THE HAPPY CANDLES WAY TO WEALTH CREATION. The book is currently rated 4.8/5 on Amazon. It is reasonably priced and it can work as a handbook to wealth creation through equity. It is a value for money book, do read it.
Disclaimer: The above information is provided for educational purpose, analysis and paper trading only. Please don't treat this as a buy or sell recommendation for the stock or index. The Techno-Funda analysis is based on data that is more than 3 months old. Supports and Resistances are determined by historic past peaks and Valley in the chart. Many other indicators and patterns like EMA, RSI, MACD, Volumes, Fibonacci, parallel channel etc. use historic data which is 3 months or older cyclical points. There is no guarantee they will work in future as markets are highly volatile and swings in prices are also due to macro and micro factors based on actions taken by the company as well as region and global events. Equity investment is subject to risks. I or my clients or family members might have positions in the stocks that we mention in our educational posts. We will not be responsible for any Profit or loss that may occur due to any financial decision taken based on any data provided in this message. Do consult your investment advisor before taking any financial decisions. Stop losses should be an important part of any investment in equity.
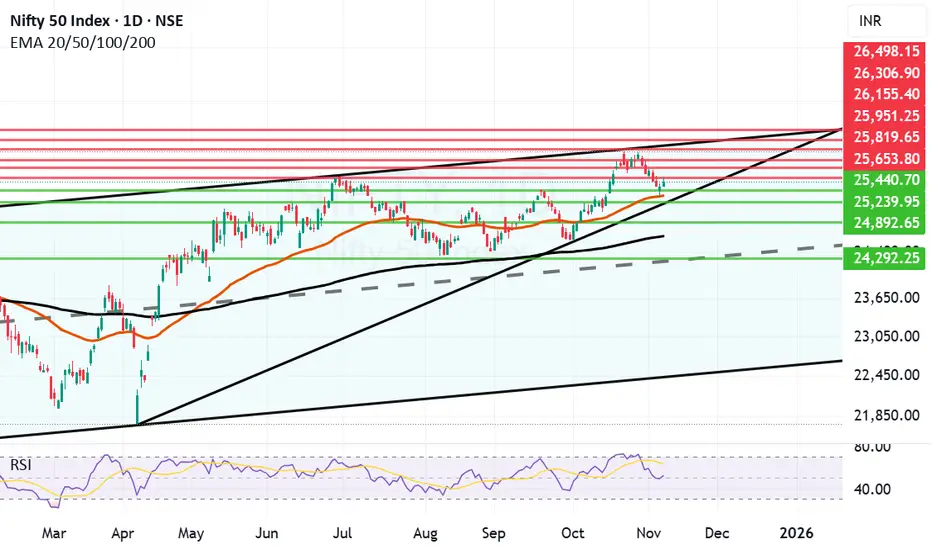
Volatile day where Nifty Bulls beat the Bears. Today we saw a volatile session in Nifty where Nifty initially collapsed to 25449 but then again rose to regain level above 25650 closing at 25694. The candle we saw today confirms a bullish trend.
Exit Poll indicative of the Government that Market likes will retain Bihar. Trump is signalling reduction of Tariff. So overall it can trigger a further up trend but you never say never in the market. Market can always surprise you but Shadow of the candles currently is positive.
The resistances for Nifty now remain at 25708, 25819, 26004, 26115, 26277, 26306 and finally the channel top remains at 26498. Supports for Nifty now remain at 25440, 25352, 25239, 24892, 24670 and 24292.
Disclaimer: The above information is provided for educational purpose, analysis and paper trading only. Please don't treat this as a buy or sell recommendation for the stock or index. The Techno-Funda analysis is based on data that is more than 3 months old. Supports and Resistances are determined by historic past peaks and Valley in the chart. Many other indicators and patterns like EMA, RSI, MACD, Volumes, Fibonacci, parallel channel etc. use historic data which is 3 months or older cyclical points. There is no guarantee they will work in future as markets are highly volatile and swings in prices are also due to macro and micro factors based on actions taken by the company as well as region and global events. Equity investment is subject to risks. I or my clients or family members might have positions in the stocks that we mention in our educational posts. We will not be responsible for any Profit or loss that may occur due to any financial decision taken based on any data provided in this message. Do consult your investment advisor before taking any financial decisions. Stop losses should be an important part of any investment in equity.

Good follow up candle but Nifty. Nifty today gave a good follow-up candle after Friday's green candle where it confirmed Mother line support. Nifty today closed at 25574. Nifty made a high of 25653 but could not hold 25650 level which was very important for further progress. Once Nifty gives a closing above 25653 now we can see further positivity in the market. The resistances for Nifty remain at 25653, 25819, 25951 and 26155. The channel top for Nifty is in the zone of 26306 to 26498 if we and when we get a closing above previous all time high of 26277. Supports for Nifty now remain at 25440, 25338 (Mother line support) and 25239. A closing below 25239 can bring further weakness which can drag Nifty towards 24892, Father line support of 24660 or even 24292 which is currently the mid channel support. As of now shadow of the candle looks positive and RSI is also turning bullish.
Disclaimer: The above information is provided for educational purpose, analysis and paper trading only. Please don't treat this as a buy or sell recommendation for the stock or index. The Techno-Funda analysis is based on data that is more than 3 months old. Supports and Resistances are determined by historic past peaks and Valley in the chart. Many other indicators and patterns like EMA, RSI, MACD, Volumes, Fibonacci, parallel channel etc. use historic data which is 3 months or older cyclical points. There is no guarantee they will work in future as markets are highly volatile and swings in prices are also due to macro and micro factors based on actions taken by the company as well as region and global events. Equity investment is subject to risks. I or my clients or family members might have positions in the stocks that we mention in our educational posts. We will not be responsible for any Profit or loss that may occur due to any financial decision taken based on any data provided in this message. Do consult your investment advisor before taking any financial decisions. Stop losses should be an important part of any investment in equity.
Nifty delicately taken the Mother line support what next?Nifty took Mother line support on Friday closed in the negative 17 points at 25492. However it closed 174 above day's low that was 25318. This means 25318 become a major support now going forward. Mother line currently is at 25328. So this 10 point zone is a banger support for Nifty. If we get a closing below 25318 there will be further weakness which can take Nifty towards 24892, Father line 24651 another major support or even mid channel support near 24318. In case 25328 is held the resistances for Nifty going upwards will be high of Friday that is 25551, 25693, 25949, 26155 and finally channel top near 26494. If we reach the channel top it will be a new All Time high.
To know how a Parallel Channel or Mother Father lines and my Mother, Father small Child theory functions or how Fundamental analysis works and how to draw charts or use Techno-Funda analysis do read my book the Happy Candles Way To Wealth Creation rated 4.8/5 on Amazon.
Disclaimer: The above information is provided for educational purpose, analysis and paper trading only. Please don't treat this as a buy or sell recommendation for the stock or index. The Techno-Funda analysis is based on data that is more than 3 months old. Supports and Resistances are determined by historic past peaks and Valley in the chart. Many other indicators and patterns like EMA, RSI, MACD, Volumes, Fibonacci, parallel channel etc. use historic data which is 3 months or older cyclical points. There is no guarantee they will work in future as markets are highly volatile and swings in prices are also due to macro and micro factors based on actions taken by the company as well as region and global events. Equity investment is subject to risks. I or my clients or family members might have positions in the stocks that we mention in our educational posts. We will not be responsible for any Profit or loss that may occur due to any financial decision taken based on any data provided in this message. Do consult your investment advisor before taking any financial decisions. Stop losses should be an important part of any investment in equity.

Nifty delicately placed near Father line. Nifty is delicately placed near the father line now. Starting to look a little oversold. There are chances that we can see a bounce from here tomorrow or next week. Bihar election results will also be looked at many as a barometer to see how the current Government is being seen by larger parts of India. Bihar is usually seen as a litmus test. A result that market would like can certainly drive the next leg of rally. If the result is against market expectation certainly we will see more downside or consolidation.
Supports for Nifty remain at: 25490 (Father line support today low was 25491), 25431 (Mid channel support is around this zone), 25314, 25151, 25024, 24886, 24674 is the channel bottom.
Resistance for Nifty on the upper side are: 25598, 25719 (Mother line resistance), 25904, 26089, 26179 currently is the channel top.
To know more about Mother Father lines and my Mother, Father small Child theory, Fundamental analysis and how to draw charts or use Techno-Funda analysis do read my book the Happy Candles Way To Wealth Creation rated 4.8/5 on Amazon.
Disclaimer: The above information is provided for educational purpose, analysis and paper trading only. Please don't treat this as a buy or sell recommendation for the stock or index. The Techno-Funda analysis is based on data that is more than 3 months old. Supports and Resistances are determined by historic past peaks and Valley in the chart. Many other indicators and patterns like EMA, RSI, MACD, Volumes, Fibonacci, parallel channel etc. use historic data which is 3 months or older cyclical points. There is no guarantee they will work in future as markets are highly volatile and swings in prices are also due to macro and micro factors based on actions taken by the company as well as region and global events. Equity investment is subject to risks. I or my clients or family members might have positions in the stocks that we mention in our educational posts. We will not be responsible for any Profit or loss that may occur due to any financial decision taken based on any data provided in this message. Do consult your investment advisor before taking any financial decisions. Stop losses should be an important part of any investment in equity.

Nifty trying to find a bottom from where it can bounce back.Nifty is trying to search bottom from where it can relaunch. The slide of Nifty continued today where it lost 165 points to close the day at 25597. The next substantial support is near 25527, 25452 and 25314. 25314 is the 50 days EMA or Mother line support. If this support is not held, it can slide further towards 25159, 24872 or even 24634 in unlikely circumstances. Resistance for Nifty remains at 25639, 25791, 25910 and 26072. Once Nifty is able to establish a bottom for relaunch the march upwards can start again. 25314 remains a very clear major level to watch for below it Nifty will become weak.
Disclaimer: The above information is provided for educational purpose, analysis and paper trading only. Please don't treat this as a buy or sell recommendation for the stock or index. The Techno-Funda analysis is based on data that is more than 3 months old. Supports and Resistances are determined by historic past peaks and Valley in the chart. Many other indicators and patterns like EMA, RSI, MACD, Volumes, Fibonacci, parallel channel etc. use historic data which is 3 months or older cyclical points. There is no guarantee they will work in future as markets are highly volatile and swings in prices are also due to macro and micro factors based on actions taken by the company as well as region and global events. Equity investment is subject to risks. I or my clients or family members might have positions in the stocks that we mention in our educational posts. We will not be responsible for any Profit or loss that may occur due to any financial decision taken based on any data provided in this message. Do consult your investment advisor before taking any financial decisions. Stop losses should be an important part of any investment in equity.

Nifty Short term resistances and Supports. Nifty came crumbling down on Profit booking and US trade deal issue not settling down even as another month goes by.
The support currently for Nifty remain near the trend line which is at 25708. If this support is broken Nifty may fall further and the next supports in line are at 25629, 25585, 25512 and a strong Father line support of 200 Hours EMA at 25455.
Resistances on the other hand for Nifty in case of any of the mentioned support is taken remain at 25841 Strong Mother line resistance of 50 Hours EMA and 25880. If these 2 resistances are crossed and we get a closing above them the next resistances in line are at 25956, 26039 and 26108.
After we get a closing above 26108 we can think of Nifty regaining the previous all-time high or even crossing it.
Disclaimer: The above information is provided for educational purpose, analysis and paper trading only. Please don't treat this as a buy or sell recommendation for the stock or index. The Techno-Funda analysis is based on data that is more than 3 months old. Supports and Resistances are determined by historic past peaks and Valley in the chart. Many other indicators and patterns like EMA, RSI, MACD, Volumes, Fibonacci, parallel channel etc. use historic data which is 3 months or older cyclical points. There is no guarantee they will work in future as markets are highly volatile and swings in prices are also due to macro and micro factors based on actions taken by the company as well as region and global events. Equity investment is subject to risks. I or my clients or family members might have positions in the stocks that we mention in our educational posts. We will not be responsible for any Profit or loss that may occur due to any financial decision taken based on any data provided in this message. Do consult your investment advisor before taking any financial decisions. Stop losses should be an important part of any investment in equity.

Negative closing today but it was a good monthly closing candle.Despite negative closing for last 2 days of the month it was an overall good monthly candle for Nifty. Previous highest Monthly closing for Nifty was 25810 in September 2024. This month we got a closing slightly below the same at 25722 in October 2025. Once we get a closing above previous all time high in the next month or 2 on in few months time the doors for Next Fibonacci level opens. The next Fibonacci resistance level after we get a closing above previous ATH of 26277 will be at 27666. Golden Fibonacci ratio target in few years time will be 29540.
Very strong Fibonacci support now remains at 23902. Next Fibonacci level support in case of a catastrophic event will be at 21743. Mother line of 50 Months EMA remains at 20853 which is very close to mid-channel support in case there are multiple global or regional situations creating instability.
As of now the shadow of the candle seems positive however there is a chance of little bottom testing for Nifty before we get a new all time high. Sectoral rotations and reshuffling of portfolios of HNIs, MFs and FIIs might also be on card depending on the trade deals and newly emerging tariff scenarios.
Selective stocks which have been giving good results year on year and Quarter on Quarter from Consumption, Defense, Auto, Infrastructure, Banking and Capital Goods sectors including the PSUs themes look good for long term investment currently. While previous superstars of IT, Pharma, Services and other few sectors which lead the previous rally can tend to remain laggard and sideways, specially if the trade deal agreement remain unresolved. If the trade deals with EU and US, specially US goes through even these sectors will fight back and tend to perform.
Overall it was a good month of recovery where Nifty made a comeback from the lows of 24605 to reach 26104 gaining almost 1499 points at one point. Yet it was little disappointing to close below 26K at 25722. Still the positive is that we gained 1117 points this month which is not a bad show at all. Hoping that we get a monthly closing above 26K or previous ATH soon so that doors for next phase of Bull rally can commence swiftly.
Disclaimer: The above information is provided for educational purpose, analysis and paper trading only. Please don't treat this as a buy or sell recommendation for the stock or index. The Techno-Funda analysis is based on data that is more than 3 months old. Supports and Resistances are determined by historic past peaks and Valley in the chart. Many other indicators and patterns like EMA, RSI, MACD, Volumes, Fibonacci, parallel channel etc. use historic data which is 3 months or older cyclical points. There is no guarantee they will work in future as markets are highly volatile and swings in prices are also due to macro and micro factors based on actions taken by the company as well as region and global events. Equity investment is subject to risks. I or my clients or family members might have positions in the stocks that we mention in our educational posts. We will not be responsible for any Profit or loss that may occur due to any financial decision taken based on any data provided in this message. Do consult your investment advisor before taking any financial decisions. Stop losses should be an important part of any investment in equity.
Momentum building but 2 tough resistances ahead before new ATH. Momentum is building in Nifty towards making a new All time high but there are 2 very important resistances to cross before Nifty can scale a new high.
One critical resistance will be 26104 which is the 1 year high. Today again Nifty came close to this level but receded thereafter after making a day high of 26097. If we are able to cross this level the previous ATH of 26277 will act as a ferocious resistance which will not be easy to cross on closing basis. If this will be crossed channel top seems to be near 26424. Trend top for medium term seems to be 26913.
Supports for Nifty at this juncture will be at 25984, 25845 (Mother line support of Hourly EMA), Mid-channel support seems to be near 25694. Father line strong support of hourly EMA seems to be near 25396 and channel bottom seems to be near 25232.
shadow of the candles is neutral but if we get a closing above 26104 it can become very positive.
As a Fresh rally dawns upon us it is mandatory to study and understand investing before you put your hard earned money on equity. I would recommend my book THE HAPPY CANDLES WAY TO WEALTH CREATION at this juncture so that you are able to make a conscious and strong financial decisions while investing in equity.
Disclaimer: The above information is provided for educational purpose, analysis and paper trading only. Please don't treat this as a buy or sell recommendation for the stock or index. The Techno-Funda analysis is based on data that is more than 3 months old. Supports and Resistances are determined by historic past peaks and Valley in the chart. Many other indicators and patterns like EMA, RSI, MACD, Volumes, Fibonacci, parallel channel etc. use historic data which is 3 months or older cyclical points. There is no guarantee they will work in future as markets are highly volatile and swings in prices are also due to macro and micro factors based on actions taken by the company as well as region and global events. Equity investment is subject to risks. I or my clients or family members might have positions in the stocks that we mention in our educational posts. We will not be responsible for any Profit or loss that may occur due to any financial decision taken based on any data provided in this message. Do consult your investment advisor before taking any financial decisions. Stop losses should be an important part of any investment in equity.

Nifty sustains the trendline Breakout on Muhurat day trading. Nifty sustained the trendline breakout gained earlier this week on Flattish trade on Muhurat day. After making a high of 25934 Nifty ended at 25868. Supports for Nifty are at 25652 and 25370. Below this level there is a Mother line support at 25087. Something to worry about is the upcoming resistances 26015, 26277 and 26484 (Golden Fibonacci ratio resistance). If these 3 resistances are crossed and Nifty can go towards 27K or even reach 27394 which can be the new trend top within this Vikram Samvat year if everything goes in line with and in favour of current trend. Wish you all a fabulous Financial success in this festive season and beyond it.
Disclaimer: The above information is provided for educational purpose, analysis and paper trading only. Please don't treat this as a buy or sell recommendation for the stock or index. The Techno-Funda analysis is based on data that is more than 3 months old. Supports and Resistances are determined by historic past peaks and Valley in the chart. Many other indicators and patterns like EMA, RSI, MACD, Volumes, Fibonacci, parallel channel etc. use historic data which is 3 months or older cyclical points. There is no guarantee they will work in future as markets are highly volatile and swings in prices are also due to macro and micro factors based on actions taken by the company as well as region and global events. Equity investment is subject to risks. I or my clients or family members might have positions in the stocks that we mention in our educational posts. We will not be responsible for any Profit or loss that may occur due to any financial decision taken based on any data provided in this message. Do consult your investment advisor before taking any financial decisions. Stop losses should be an important part of any investment in equity.

Trendline Breakout and 1year high for NiftyNifty is at 1 year high at 25709 after making an yearly high of 25781.50. The trendline breakout has been achieved. All that we need for Nifty to grow from here is that the breakout should sustain. Also no negative news on Tariff front or any Geopolitical issue will be required for Nifty to forge its way ahead.
Supports For Nifty: Supports for Nifty are at 25378 (Important Fibonacci support), 24865 and 24333 (Strong Mother line support of 52 weeks.)
Resistances for Nifty are at: 25843, 26044 (Important Fibonacci resistance), 26277 (Previous All time high), 26529 (Fibonacci Golden ratio strong resistance) and finally 27470. After closing above 27470 doors for 28K will open directly.
To know more about Fibonacci retracement, Mother Father lines and my Mother, Father small Child theory, Fundamental analysis and how to draw charts or use Techno-Funda analysis do read my book the Happy Candles Way To Wealth Creation rated 4.8/5 on Amazon.
Things are looking good after a long time. Shadow of weekly candle is positive (Green). Hope some Geopolitical event or Tariff related news or weak earnings season does not spoil the chart again.
Disclaimer: The above information is provided for educational purpose, analysis and paper trading only. Please don't treat this as a buy or sell recommendation for the stock or index. The Techno-Funda analysis is based on data that is more than 3 months old. Supports and Resistances are determined by historic past peaks and Valley in the chart. Many other indicators and patterns like EMA, RSI, MACD, Volumes, Fibonacci, parallel channel etc. use historic data which is 3 months or older cyclical points. There is no guarantee they will work in future as markets are highly volatile and swings in prices are also due to macro and micro factors based on actions taken by the company as well as region and global events. Equity investment is subject to risks. I or my clients or family members might have positions in the stocks that we mention in our educational posts. We will not be responsible for any Profit or loss that may occur due to any financial decision taken based on any data provided in this message. Do consult your investment advisor before taking any financial decisions. Stop losses should be an important part of any investment in equity.

Strong Breakout for Nifty as it becomes a runaway train.After crossing the mid-channel resistance. Nifty has become a runaway train which has entered and overbought zone on hourly chart as it closed at 25585 with few critical resistances coming to fore. Channel top seems to be just near 26K at 25956. Other critical resistances are at 25586, 25698 and 25786 before it reaches 25956 or 26K. Support for Nifty at this juncture are at 25442, 25323, 25252 (Mother line support and the mid-channel support). Father line support is at 25064. Much required closing above 25500 has lifted the spirits of investors. With key resistances ahead and Nifty being overbought little correction or consolidation would be ideal before it can scale further heights.
Disclaimer: The above information is provided for educational purpose, analysis and paper trading only. Please don't treat this as a buy or sell recommendation for the stock or index. The Techno-Funda analysis is based on data that is more than 3 months old. Supports and Resistances are determined by historic past peaks and Valley in the chart. Many other indicators and patterns like EMA, RSI, MACD, Volumes, Fibonacci, parallel channel etc. use historic data which is 3 months or older cyclical points. There is no guarantee they will work in future as markets are highly volatile and swings in prices are also due to macro and micro factors based on actions taken by the company as well as region and global events. Equity investment is subject to risks. I or my clients or family members might have positions in the stocks that we mention in our educational posts. We will not be responsible for any Profit or loss that may occur due to any financial decision taken based on any data provided in this message. Do consult your investment advisor before taking any financial decisions. Stop losses should be an important part of any investment in equity.

Uncertainty can prevail with latest Trump Tariff Tantrum.The chart indicates a Trend line resistance near 25323 which Nifty was set to overhaul but latest Trump Tariff Tantrum has potential to derail the progress again. This time the announcement is 100% tariff on China. Global markets, Crypto and Gift Nifty is showing weakness due to the announcement which will be effective from 1st November.
Resistance for Nifty are at 25323 (Trend line resistance), 25438, 25565 and finally channel top at 25702. Supports for Nifty are at 25215, 25087 (Mother line support), 24987 (Father line support), 24922 and 24750 is the channel bottom support. Shadow of the candle was positive to neutral but this tariff announcement has turned it negative as of now. Let us see how the cookie crumbles next week.
To know mover about Mother line, Father line, Mid channel support / resistance, Chanel top resistnace and channle bottom support, trend line support and resistance (To understand the role of Mother line and Father line) or to be able to draw resistances and supports based on historic peaks and valleys you can read my book THE HAPPY CANDLES WAY TO WEALTH CREATION. The book is available in Amazon in paperback or Kindle version and is rated 4.8/5. This book teaches you Techno-Funda investing. (Techno Funda investing means Knowing which are Fundamentally strong companies and investing / booking profits / staying invested in them based on Technical analysis). The book has some more unique features like rating a stock with the help of Happy Candles Number wherein you can give a stock marks out of 100 based on Techincal and Fundamental analysis you have learned by reading it. Thus you can know if the stock is currently investible or not based on the marks it scores out of 100. The book also covers various aspect of behavioural finance. Lot of people who have read the book consider it as a hand book to equity investing. Buy the book you will not be dissapointed as the book is reasonably priced. Search by the key words The Happy Candles Way to wealth creation and you will get it.
Disclaimer: The above information is provided for educational purpose, analysis and paper trading only. Please don't treat this as a buy or sell recommendation for the stock or index. The Techno-Funda analysis is based on data that is more than 3 months old. Supports and Resistances are determined by historic past peaks and Valley in the chart. Many other indicators and patterns like EMA, RSI, MACD, Volumes, Fibonacci, parallel channel etc. use historic data which is 3 months or older cyclical points. There is no guarantee they will work in future as markets are highly volatile and swings in prices are also due to macro and micro factors based on actions taken by the company as well as region and global events. Equity investment is subject to risks. I or my clients or family members might have positions in the stocks that we mention in our educational posts. We will not be responsible for any Profit or loss that may occur due to any financial decision taken based on any data provided in this message. Do consult your investment advisor before taking any financial decisions. Stop losses should be an important part of any investment in equity.

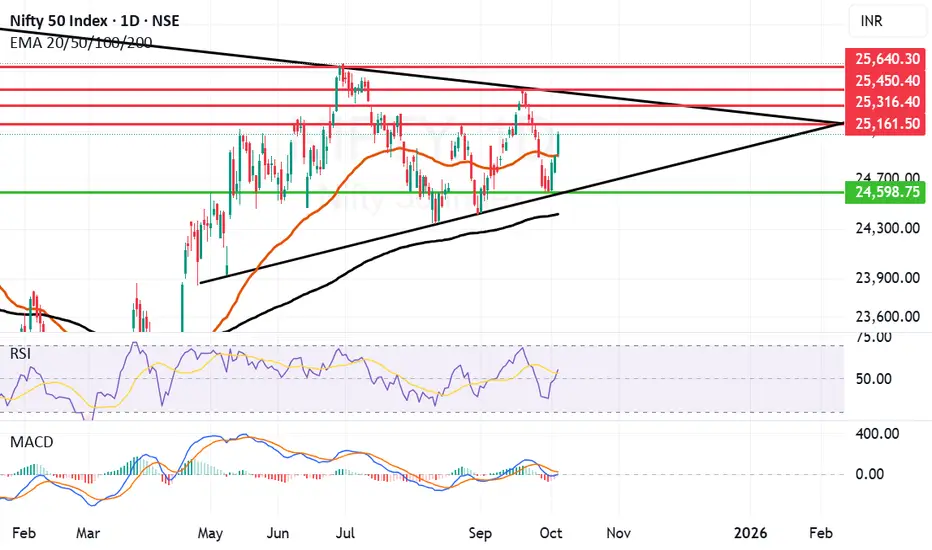
Nifty on the verge of a Trendline breakout. Nifty did a great job today by closing above a very important resistance of 25128. Now the major hurdle seems to be near the trendline which is near 25228. Once this range is crossed the next hurdles will be at 25306, 25431 and channel top near 25579. The supports for Nifty are at 25128. Mother line support near 25021 which is also a mid channel support. (Making this area a very strong support). Followed by 24965 (Father line support). If by chance father line support is broken we can see Nifty falling towards 24806 or even 24601 which is the channel bottom support. As of now the shadow of the candle seems to be positive (Green).
To know mover about Mother line, Father line, Mid channel support / resistance, Chanel top resistnace and channle bottom support, trend line support and resistance (To understand the role of Mother line and Father line) or to be able to draw resistances and supports based on historic peaks and valleys you can read my book THE HAPPY CANDLES WAY TO WEALTH CREATION. The book is available in Amazon in paperback or Kindle version and is rated 4.8/5. This book teaches you Techno-Funda investing. (Techno Funda investing means Knowing which are Fundamentally strong companies and investing / booking profits / staying invested in them based on Technical analysis). The book has some more unique features like rating a stock with the help of Happy Candles Number wherein you can give a stock marks out of 100 based on Techincal and Fundamental analysis you have learned by reading it. Thus you can know if the stock is currently investible or not based on the marks it scores out of 100. The book also covers various aspect of behavioural finance. Lot of people who have read the book consider it as a hand book to equity investing. Buy the book you will not be dissapointed as the book is reasonably priced. Search by the key words The Happy Candles Way to wealth creation and you will get it.
Disclaimer: The above information is provided for educational purpose, analysis and paper trading only. Please don't treat this as a buy or sell recommendation for the stock or index. The Techno-Funda analysis is based on data that is more than 3 months old. Supports and Resistances are determined by historic past peaks and Valley in the chart. Many other indicators and patterns like EMA, RSI, MACD, Volumes, Fibonacci, parallel channel etc. use historic data which is 3 months or older cyclical points. There is no guarantee they will work in future as markets are highly volatile and swings in prices are also due to macro and micro factors based on actions taken by the company as well as region and global events. Equity investment is subject to risks. I or my clients or family members might have positions in the stocks that we mention in our educational posts. We will not be responsible for any Profit or loss that may occur due to any financial decision taken based on any data provided in this message. Do consult your investment advisor before taking any financial decisions. Stop losses should be an important part of any investment in equity.

Great Closing above Motherline of Daily Chart. Nifty has given a brilliant closing above Mother line of daily chart and key psychological level of 25K at 25077. Supports for Nifty are at Mother line 24899, Trend line support at 24598 and finally Father line support at 24417. Resistances are at 25161, 25316 and 25450 and finally 25640.
Above 25640 there will be a major Bullish breakout which can take us to 26K or even previous All time high or even beyond it. It will be very important for Nifty to hold the levels now and again not go below the Mother or Father line otherwise again all the momentum that has built in favour of the rally will vanish as quickly.
Having said that RSI, MACD and shadow of the candle suggest are oozing with confidence this time let us see what this week and month holds for us, things look good as of now.
Disclaimer: The above information is provided for educational purpose, analysis and paper trading only. Please don't treat this as a buy or sell recommendation for the stock or index. The Techno-Funda analysis is based on data that is more than 3 months old. Supports and Resistances are determined by historic past peaks and Valley in the chart. Many other indicators and patterns like EMA, RSI, MACD, Volumes, Fibonacci, parallel channel etc. use historic data which is 3 months or older cyclical points. There is no guarantee they will work in future as markets are highly volatile and swings in prices are also due to macro and micro factors based on actions taken by the company as well as region and global events. Equity investment is subject to risks. I or my clients or family members might have positions in the stocks that we mention in our educational posts. We will not be responsible for any Profit or loss that may occur due to any financial decision taken based on any data provided in this message. Do consult your investment advisor before taking any financial decisions. Stop losses should be an important part of any investment in equity.
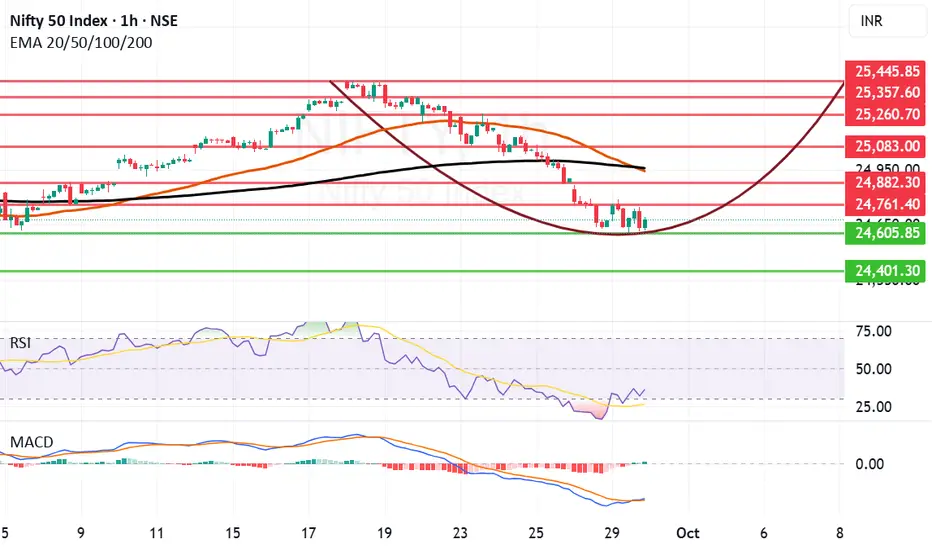
V-Shape recovery in progress for Nifty. Today we will try to study Nifty chart on an hourly scale. Hourly scale means the candles that we see in the chart represent nifty movement for 1 hour each. Each candle represents 1 hour movement of Nifty. Now let us watch closely what happened here.
1) We can see that after reaching a high of 25448 on September 25th. Nifty declined sharply. Then it consolidate in the range of 24587 and 24748. After this it moved upwards and hit the mother line at 24867.
2) As we know when the stock or index is below the Mother line the line acts as a resistance. Next 7 candles could not give closing above this line as it was a strong resistnace.
3) During the last two hours of trade we got a closing above the mother line thus it has now become a support. right now the Mother line is at 24846. So this level will be our immediate support. Below this level other supports will be at 24748 and 24587.
4) The Father line resistnace is at 24922 this level will be our immediate resistance. If we get a closing above this level the next resistances will be at 25032, 25139, 25255, 25358 and 25451. If and when we get a closing above 25451 it will be a strong Bullish breakout.
Supports and resistances other than Mother and Father line are derived by historical peaks and valleys. Mother and Father line/Support and resistance are nothing but exponential Moving averages. Mother line is 50 EMA and Father line 200 EMA.
As this is an hourly chart, Mother line is 50 Hours exponential moving average and Father line is 200 hours exponential moving average. In case of daily, weekly or monthly charts. The EMA will be 50 days, weeks or Months respectively.
To know mover about patterns such as V pattern seen here or Mother Father and Small Child theory (To understand the role of Mother line and Father line) or to be able to draw resistances and supports based on historic peaks and valleys you can read my book THE HAPPY CANDLES WAY TO WEALTH CREATION. The book is available in Amazon in paperback or Kindle version and is rated 4.8/5. This book teaches you Techno-Funda investing. (Techno Funda investing means Knowing which are Fundamentally strong companies and investing / booking profits / staying invested in them based on Technical analysis). The book has some more unique features like rating a stock with the help of Happy Candles Number wherein you can give a stock marks out of 100 based on Techincal and Fundamental analysis you have learned by reading it. Thus you can know if the stock is currently investible or not based on the marks it scores out of 100. The book also covers various aspect of behavioural finance. Lot of people who have read the book consider it as a hand book to equity investing. Buy the book you will not be dissapointed as the book is reasonably priced. Search by the key words The Happy Candles Way to wealth creation and you will get it.
Disclaimer: The above information is provided for educational purpose, analysis and paper trading only. Please don't treat this as a buy or sell recommendation for the stock or index. The Techno-Funda analysis is based on data that is more than 3 months old. Supports and Resistances are determined by historic past peaks and Valley in the chart. Many other indicators and patterns like EMA, RSI, MACD, Volumes, Fibonacci, parallel channel etc. use historic data which is 3 months or older cyclical points. There is no guarantee they will work in future as markets are highly volatile and swings in prices are also due to macro and micro factors based on actions taken by the company as well as region and global events. Equity investment is subject to risks. I or my clients or family members might have positions in the stocks that we mention in our educational posts. We will not be responsible for any Profit or loss that may occur due to any financial decision taken based on any data provided in this message. Do consult your investment advisor before taking any financial decisions. Stop losses should be an important part of any investment in equity.

Temporary Bottom formations seems to be happening in Nifty. It seems that Nifty is trying to form a bottom around 24605 levels. If this level is broken the next support seems to be near 24401. On the upper side the seem to be near 24761 and 24882. If we get a closing above 24882 the most important resistance will be at 24944 and 24960 where we have the Mother and the father line respectively. Bulls will get back in business above 24960 with further resistances at 25083 and 25260. these seem to be the levels to watch out this week.
Mark Mobius veteran investor looks at Sesex reaching 100,000 within 1 year. Corresponding level for Nifty can be close to 27K+ this is the news on the positive side. RSI has started to move in a positive direction. Moving Average Convergence and Divergence has given a slight indication showing the trend might change sooner rather than later.
To learn more about my Mother, Father and Small Child Theory, RSI, MACD, Profit booking averaging and other Techno-Funda aspects of investing you can read my book THE HAPPY CANDLES WAY TO WEALTH CREATION. It is a book considered by many as a hand book to equity investment. Currently the book enjoys 4.8/5 Star rating on Amazon. Paperback edition or Kindle edition can be bought from there or many other sources.
Disclaimer: The above information is provided for educational purpose, analysis and paper trading only. Please don't treat this as a buy or sell recommendation for the stock or index. The Techno-Funda analysis is based on data that is more than 3 months old. Supports and Resistances are determined by historic past peaks and Valley in the chart. Many other indicators and patterns like EMA, RSI, MACD, Volumes, Fibonacci, parallel channel etc. use historic data which is 3 months or older cyclical points. There is no guarantee they will work in future as markets are highly volatile and swings in prices are also due to macro and micro factors based on actions taken by the company as well as region and global events. Equity investment is subject to risks. I or my clients or family members might have positions in the stocks that we mention in our educational posts. We will not be responsible for any Profit or loss that may occur due to any financial decision taken based on any data provided in this message. Do consult your investment advisor before taking any financial decisions. Stop losses should be an important part of any investment in equity.
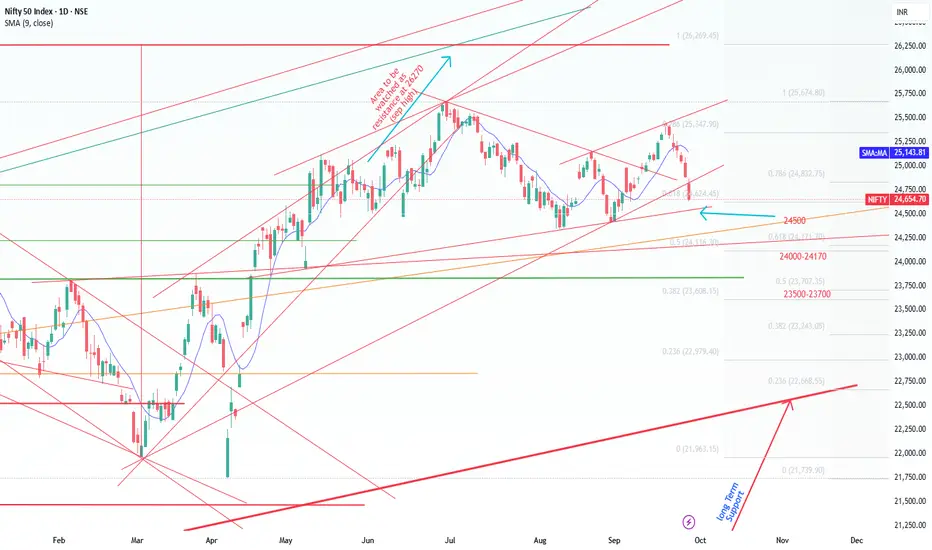
Nifty Short & Medium Term SupportsNifty on a decline mode because of new Tariff's imposed by Trump mainly on Pharma this week.
Primarily New announcement on IT - H1 B Visa and Tax for Outsourcing IT and the recent pharma tarrifs are the concern.
Use the dips (Opportunity) and buy through SIP or through multiple parcel in this uncertain times with a goal of 3-5 years.
Nifty Short Term Supports:
1. 24500 ( Trend Line as shown )
2. 24000-24170 (Fibonacci Retracements Supports- Two Supports in this zone 24116 & 24171 as shown)
Medium Term Support:
3. 23500-23700 ( Fibonacci Retracements Supports- Two Supports in this zone 23608 & 23707 as shown)
4. 23000
Resistance:
1. 25000
2. 25200 ( 25154 Aug 2025 high)
3. 25500 ( 25441 Sep 18th 2025 High )
Medium Term:
1.25670 ( Jun 2025 High)
2.26269 ( Sep 2024 High)
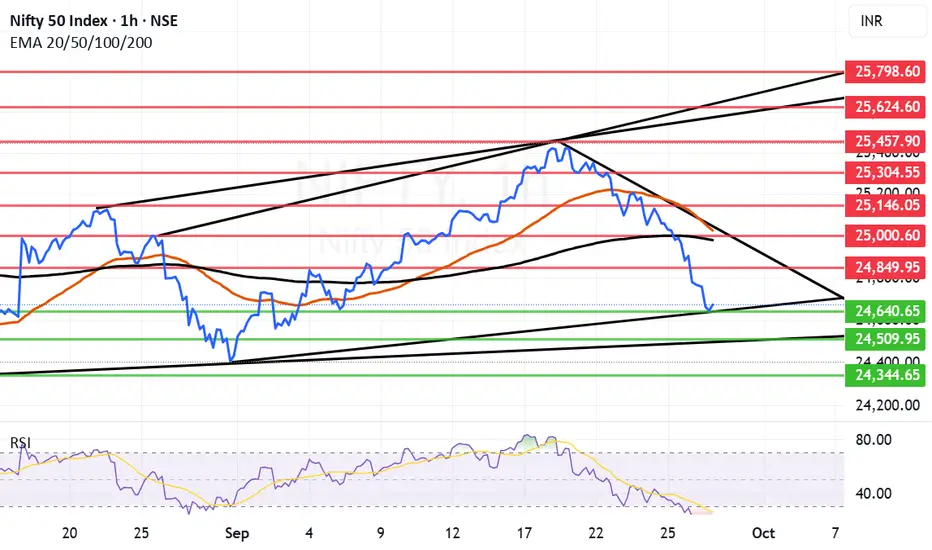
Nifty Short Term Analysis: Nifty Next Week. Nifty on chart looks very close to being oversold. some It and few Pharma companies are reaching the range were they seem oversold but when the chips are down they can stay that way for a long time. So we cant be sure if the fall will continue or persist. But some IT companies are already trading at mouth watering levels irrespective of H1B visa restriction/fee hike announcements. Pharma manufacturers have also taken the fall due to 100% Tariff on pharma announcement. However the point to be noted is that majority of Indian Pharma export to US is generic in nature and generic pharma is exempt from Tariff! Auto sector was still doing quite well in comparison. There is a new related to 20% stake sale to foreign investors in PSU Banks. Additionally there is a news related of Mega-merger of PSU Banks. Most of Auto purchase whether institutional or personal or corporate happens via Auto loans. So those who provide these loans can benefit. With reduction of GST and relief on Income tax front consumption will also increase. There are many NBFC which can also benefit because there is an increasing trend in buying goods on loan along with holidaying and leisure on loans. Defence spending is also set to increase for sure with ongoing tense environment in the neighbourhood. These are the sectors in my opinion which one must look at. With all these things in mind medium term outlook and long term outlook for India still remains positive.
Resistance zone for Nifty with short term perspective seem to be at: 24849, 24980 is the father line, 25000 is an important resistance level and 25026 is the mother line. All the three resistances are close by. So once we get a closing above 25026 things will smoothen out and move towards 25146 or even 25304+ levels.
Support level for Nifty with short term perspective are at: 24640, 24509 and 24344.
Disclaimer: The above information is provided for educational purpose, analysis and paper trading only. Please don't treat this as a buy or sell recommendation for the stock or index. The Techno-Funda analysis is based on data that is more than 3 months old. Supports and Resistances are determined by historic past peaks and Valley in the chart. Many other indicators and patterns like EMA, RSI, MACD, Volumes, Fibonacci, parallel channel etc. use historic data which is 3 months or older cyclical points. There is no guarantee they will work in future as markets are highly volatile and swings in prices are also due to macro and micro factors based on actions taken by the company as well as region and global events. Equity investment is subject to risks. I or my clients or family members might have positions in the stocks that we mention in our educational posts. We will not be responsible for any Profit or loss that may occur due to any financial decision taken based on any data provided in this message. Do consult your investment advisor before taking any financial decisions. Stop losses should be an important part of any investment in equity.