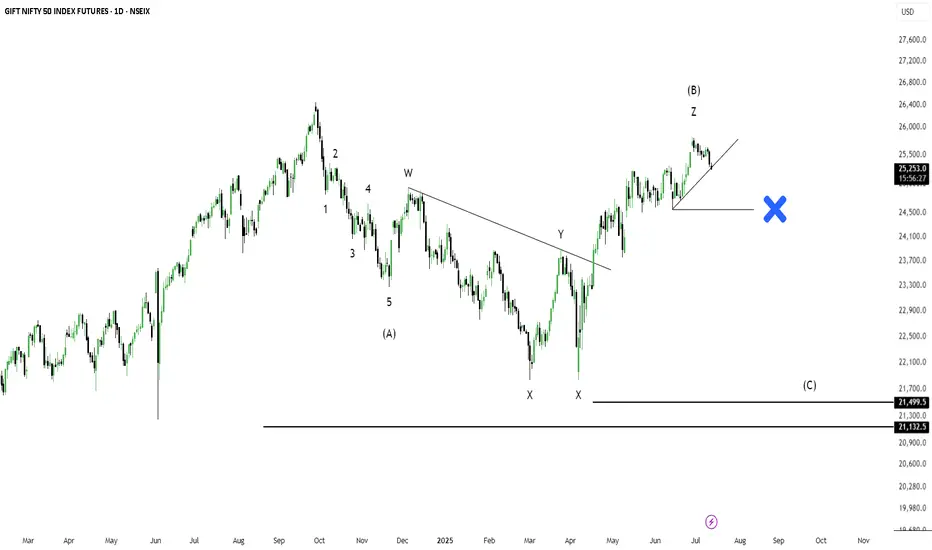
NIFTY : A 5%-6% correction from Higher LevelsNSE:NIFTY
its s Weekly Chart.
26,515 | 26,786
These are the two levels to watch out when the market is showing upside momentum.
These are extensions of the previous upswing.
These are the most prominent levels for Wolfe Wave that is forming currently.
The open of the Calendar Year 2026 being 26,173. This must be respected by the Bulls (+/- 0.5%)
for continuation of the up-move till above mentioned two levels.
Any weakness around any of these two levels (26,515 | 26,786) will trigger Wolfe Wave and the down-side targets are 5% and 6% deep (As mentioned on the chart).
Use price action and SMC while trading around these levels. Macro-economics and Geo-economics (Geo-politics) are quite vulnerable and may surprise both Bulls and Bears.
FII Liquidity is moving towards lower PE regimes and metals are their center point for now. Expect more sectorial churn on a Weekly/Monthly basis.
Niftytrading


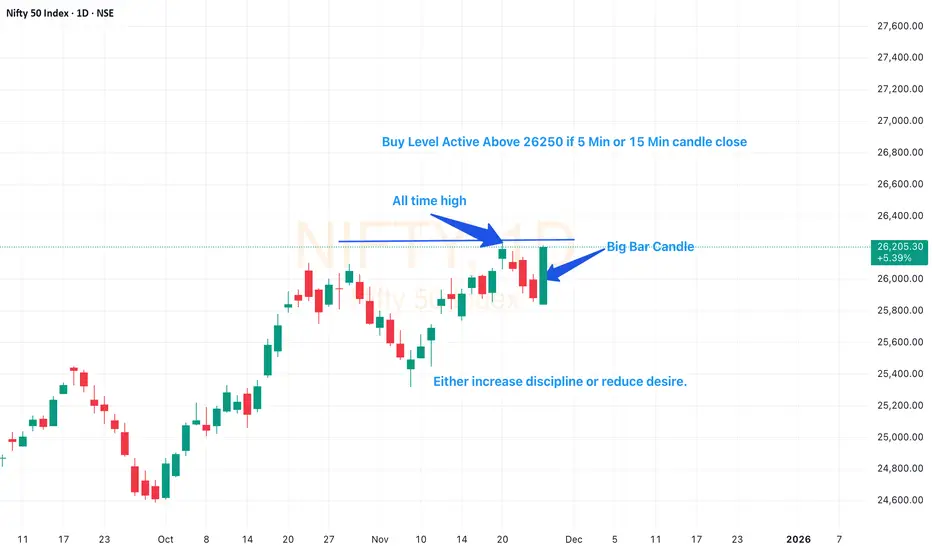
Nifty Plan – Clean Rules, No EmotionNifty is moving strongly toward its 52-week high zone. A clean breakout can provide a high-probability long opportunity.
Conditions
1) If a 5-minute or 15-minute candle closes above 26,250 (Nifty’s all-time high), we can consider initiating long positions.
2) As long as price holds above today’s bullish candle mid-point, avoid looking for shorts.
3) Structure remains bullish as long as higher levels sustain.
Market Psychology
Everyone, especially retail traders, expecting the market to break the 52-week high and good trend, so smart money will make it difficult for them to profit. (by keeping market sideways)
Retail traders often lose money due to theta decay when buying OTM options during breakout conditions.
Strategy Suggestions
Consider selling PE options to benefit from time decay.
Or, trade the direction directly by buying ITM Call options with a proper stop-loss.
Do not protect your ego. Protect your capital.
Nifty Plan – Clean Rules, No EmotionNifty 15-min Chart Outlook
1) Price is moving inside a short-term downtrend, respecting a descending trendline.
2) Previous day high is marked and may act as a strong resistance. A close above trendline breakout can trigger a bullish move target previous day high.
3) Until the resistance zone is taken out, the bias remains bearish on rallies.
4) Immediate support zone highlighted. A clean 15-min candle close below this support can open the door for further downside.
5) Watch for volume confirmation on breakout/breakdown to avoid false moves.
Trading Plan:
Buy above Trendline target previous day high resistance area. (Or can buy near support zone risky trade but risk and reward will be good)
Sell below: Immediate support zone on a strong 15-min close.
Structure currently favours sell-on-rise unless the trendline breaks.


Nifty Analysis EOD – October 27, 2025 – Monday🟢 Nifty Analysis EOD – October 27, 2025 – Monday 🔴
Bulls return after the festive break, eyeing 26,000 with renewed strength
Diwali Greetings and Happy New Year to all Indian followers! ✨
After a long Diwali vacation with family, I’m finally back at the desk. Although I was tracking and trading daily, I couldn’t find time to write notes.
During the holiday stretch (7th–24th Oct), Nifty rallied more than 1000 points, hitting our 25,900 pattern target — a smooth ride for intraday traders, except for a few choppy sessions.
🗞 Nifty Summary
Last week’s candle shaped like an inverted hammer/shooting star, hinting at either a pause or a short-term reversal. But today, backed by positive global cues, Nifty opened gap-up by 48 points, showed no intent to fill the gap, and rallied sharply upward.
The index faced resistance around 25,944–25,977, and after several failed breakout attempts beyond 25,977, it briefly marked a new day high at 26,005 before slipping back into the resistance zone.
The final two hours turned volatile — both bulls and bears fought for control. Eventually, Nifty closed at 25,974, just below the intraday high yet comfortably above the previous day’s high — a sign of bullish continuation with caution ahead.
While the close above PDH is positive, sustained strength will only come if bulls breach and hold 25,977–26,020 on the upcoming monthly expiry session.
🛡 5 Min Intraday Chart with Levels
🛡 Intraday Walk
Nifty opened Gap-Up 48 points above PDH.
Rally extended straight to 25,944–25,977 resistance zone.
26,005 marked as intraday high — brief breakout attempt failed.
Last two hours saw heavy volatility within resistance band.
Closed strong at 25,974, maintaining higher-high structure.
🕯 Daily Candle Breakdown
Open: 25,843.20
High: 26,005.95
Low: 25,827.00
Close: 25,966.05
Change: +170.90 (+0.66%)
🏗️ Structure Breakdown
Green candle with solid momentum.
Body ≈ 122.85 pts → decent bullish body.
Range ≈ 178.95 pts → healthy intraday activity.
Upper wick ≈ 39.9 pts, Lower wick ≈ 16.2 pts.
📚 Interpretation
Market opened gap-up and held gains throughout.
Strong follow-through buying above 25,850.
Close near upper quartile of range → bullish conviction intact.
Minor upper wick shows temporary supply at 26,000 psychological mark.
🕯Candle Type
Bullish Marubozu variant (small top wick).
Indicates buying continuation after breakout-driven rally.
🛡 5 Min Intraday Chart
⚔️ Gladiator Strategy Update
ATR: 204.01
IB Range: 119.70 → Medium
Market Structure: Balanced
Trade Highlights:
09:20 – Long Trade → Target Achieved (R:R 1:1.85)
10:06 – Long Trade → Target Achieved (R:R 1:0.79)
📌 What’s Next? / Bias Direction
Bias: Mildly Bullish
As long as 25,850–25,865 holds, the bias remains positive.
A breakout above 26,020 may extend targets to 26,085–26,150, while failure could lead to a sideways consolidation.
📌 Support & Resistance Levels
Resistance Zones:
25996
26010 ~ 26020
26085 ~ 26100
Support Zones:
25865
25828
25790
25725 ~ 25715
💡 Final Thoughts
“Momentum loves clarity — hesitation builds only where conviction weakens.”
The market tone stays upbeat, but resistance near 26,000 will test whether bulls have the stamina to carry forward the festive rally.
✏️ Disclaimer
This is just my personal viewpoint. Always consult your financial advisor before taking any action.

nifty50 Analysis | be careful from trapMarket Outlook
Support Zone: 24,550 – 24,400
Resistance Levels: 24,750 – 24,790 and 24,960 – 24,990
A falling wedge pattern is currently forming just above the support zone. The key level to watch is 24,590, as a sweep of this low appears likely. However, before a potential breakdown, price may first retest the immediate resistance area and face rejection, leading back toward the support zone.

Nifty Spot Daily Trend Analysis from September 29Nifty spot may find support near 24,530 with a potential rebound toward 25,100, indicating the possibility of a Head and Shoulders formation in the coming sessions.
A gap-up opening on September 29, 2025 cannot be ruled out, which may influence these projected levels. Traders should rely on their own technical assessment before initiating positions.
Adherence to disciplined risk management is strongly recommended.

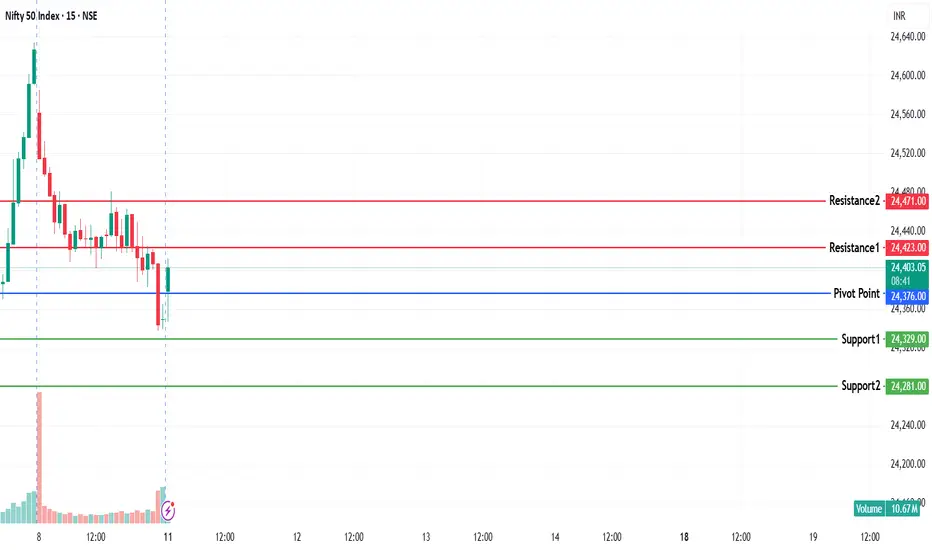
NIFTY KEY LEVELS FOR 11.08.2025NIFTY KEY LEVELS FOR 11.08.2025
If the candle stays above the pivot point, it is considered a bullish bias; if it remains below, it indicates a bearish bias. Price may reverse near Resistance 1 or Support 1. If it moves further, the next potential reversal zone is near Resistance 2 or Support 2. If these levels are also broken, we can expect the trend.
If the range(R2-S2) is narrow, the market may become volatile or trend strongly. If the range is wide, the market is more likely to remain sideways
📢 Disclaimer
I am not a SEBI-registered financial adviser.
The information, views, and ideas shared here are purely for educational and informational purposes only. They are not intended as investment advice or a recommendation to buy, sell, or hold any financial instruments.
Please consult with your SEBI-registered financial advisor before making any trading or investment decisions.
Trading and investing in the stock market involves risk, and you should do your own research and analysis. You are solely responsible for any decisions made based on this research.
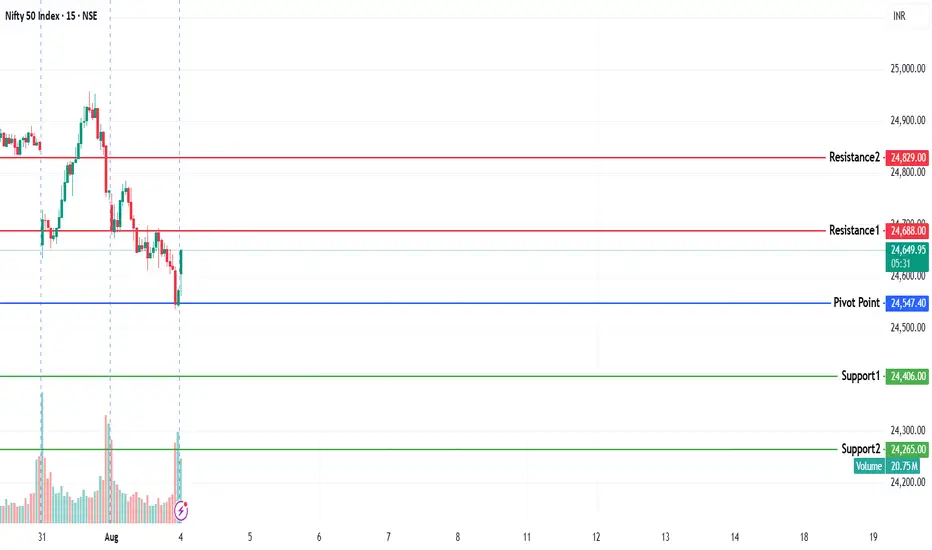
NIFTY KEY LEVELS FOR 04.08.2025NIFTY KEY LEVELS FOR 04.08.2025
If the candle stays above the pivot point, it is considered a bullish bias; if it remains below, it indicates a bearish bias. Price may reverse near Resistance 1 or Support 1. If it moves further, the next potential reversal zone is near Resistance 2 or Support 2. If these levels are also broken, we can expect the trend.
If the range(R2-S2) is narrow, the market may become volatile or trend strongly. If the range is wide, the market is more likely to remain sideways
📢 Disclaimer
I am not a SEBI-registered financial adviser.
The information, views, and ideas shared here are purely for educational and informational purposes only. They are not intended as investment advice or a recommendation to buy, sell, or hold any financial instruments.
Please consult with your SEBI-registered financial advisor before making any trading or investment decisions.
Trading and investing in the stock market involves risk, and you should do your own research and analysis. You are solely responsible for any decisions made based on this research.
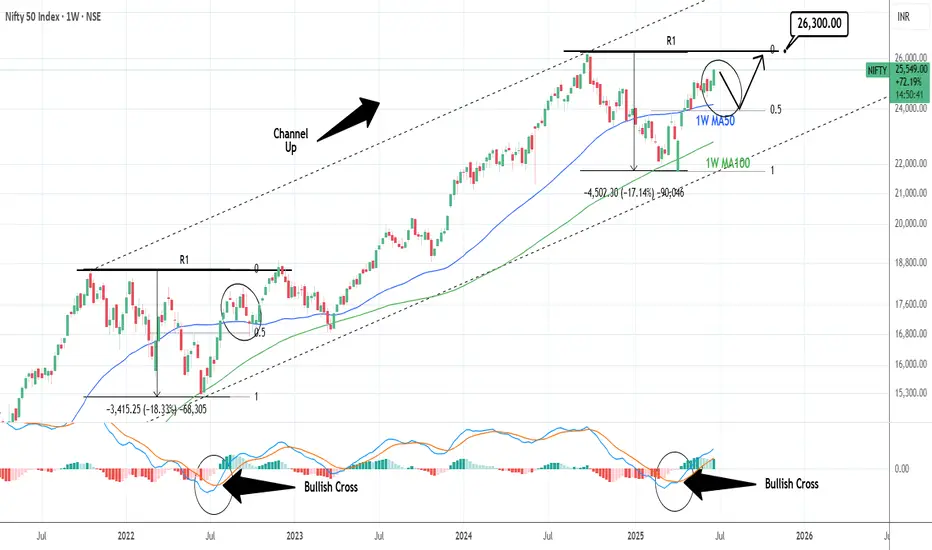
NIFTY: One more opportunity to buy lower.Nifty is on excellent bullish levels on its 1D technical outlook (RSI = 66.330, MACD = 172.380, ADX = 16.480), extending the bullish wave of the 4 year Channel Up. Being close to the R1 already, a pullback to the 0.5 Fib and the 1W MA50 isn't unlikely, as it is what happened in September 2022. That will be our final opportunity to buy low and target the R1 level (TP = 26,300).
## If you like our free content follow our profile to get more daily ideas. ##
## Comments and likes are greatly appreciated. ##
Nifty Analysis EOD – June 18, 2025 – Wednesday🟢 Nifty Analysis EOD – June 18, 2025 – Wednesday 🔴
⚖️ Dhamakedar Start, But Indecisive Close – Weekly Expiry Caution Ahead
Nifty opened with a 65-point gap-down at 24,788.35, but what followed was a power-packed bullish start — within just 25 minutes, it surged over 150 points, hitting a day high of 24,947.55.
However, the euphoria didn’t last.
As the session progressed, the index gradually gave up all its gains, slipped below the previous day’s low, and finally found support at 24,750, a critical level. By the end of the day, Nifty settled around the opening zone at 24,812.05, just +23 points above open, while net change remained −41.35 points from the previous close.
The day showcased both strength and weakness — a typical "everyone-expected-fall-but-it-didn't-fall-enough" kind of day. The long upper wick reflects failed attempts by bulls, while the lack of breakdown keeps the bears in check.
Tomorrow is weekly expiry — caution is advised.
🕯 5 Min Time Frame Chart with Levels
🕯 Daily Time Frame Chart
🕯 Daily Candle Breakdown
Open: 24,788.35
High: 24,947.55
Low: 24,750.45
Close: 24,812.05
Change: −41.35 (−0.17%)
📊 Candle Structure Breakdown
Real Body: 23.70 pts → ✅ Green Candle (tiny body)
Upper Wick: 135.50 pts
Lower Wick: 37.90 pts
🔍 Interpretation
Strong bullish momentum early on, but buyers failed to hold above 24,900.
Long upper wick signals supply or profit-booking at higher levels.
Price closed near open despite wide range → indecision between bulls and bears.
🕯 Candle Type
🟨 Spinning Top – A textbook indecisive candle, often seen at turning points or during pauses in trend.
📌 Key Insight
Buyers couldn’t reclaim or close above 24,950 — resistance strengthened.
Support held at 24,750 — but barely.
Watch 24,950 on upside and 24,750 on downside — a breakout from either may decide expiry-day trend.
🛡 5 Min Intraday Chart
⚔️ Gladiator Strategy Update
ATR: 252.34
IB Range: 170.65 → Medium IB
Market Structure: ⚖️ Balanced
Trades:🚫 Short Trigger at 12:45 : Trapped - SL Hit
📌 Support & Resistance Zones
Resistance Levels
24,894 ~ 24,882
24,972 ~ 25,000
25,060 ~ 25,080
25,102 ~ 25,125
Support Levels
24,825 ~ 24,847
24,725 ~ 24,735
24,660
24,590
💭 Final Thoughts
When price travels 200 points but closes flat, it tells you something: Smart money is waiting.Weekly expiry ahead could bring unexpected moves.✅ Stay nimble. Stay alert.
🧠 “When in doubt, let the market shout — not whisper. Listen for the breakout.”
✏️ Disclaimer
This is just my personal viewpoint. Always consult your financial advisor before taking any action.

Nifty 50 If you find this helpful and want more FREE forecasts in TradingView, Hit the 'BOOST' button
Drop some feedback in the comments below! (e.g., What did you find most useful?
How can we improve?)
Your support is appreciated!
Now, it's your turn!
Be sure to leave a comment; let us know how you see this opportunity and forecast.
Have a successful week
DISCLAIMER: I am NOT a SEBI registered advisor or a financial adviser. All the views are for educational purpose only

Nifty Spot Daily Trend Analysis from April 25, 2025Technical Outlook:
Nifty Spot is approaching a potential resistance near the Gann 720° level at 24,539. A minor correction appears likely, and we are currently awaiting short signal confirmation from one of our proprietary indicators. Should a decline occur, the index may find support around the Sine Wave level of 23,398. A break below this level could suggest a continuation of the bearish momentum.
At present, most indicators are still trending upwards. However, the bar formations on the chart hint at a possible reversal. Once the MastersSignal confirms a short setup, we will reassess confluence around the Gann 720° value to strengthen conviction.
Disclaimer: This is my personal technical view. Traders should conduct their own analysis and implement strict risk management before initiating any trades.

Nifty--Demand Zone and Liquidity @23400 Nifty index is broken the strong resistance at 23800 levels and taken the liquidity at 24220 levels...
now price action is sideways or trading in a range bound market.
expecting some pullback for further continuation....
wait for buyers exhaustion before short...
we have a clear demand zone at 23400 levels...
when price confirms the bullishness here, after the liquidity grab below the demand will observe a strong up move again...
there are bullish gaps @22800 levels...price has to give pullback for further upside move...
the above one is a clear buying plan for the targets of 24800 and 25200 liquidity.
--->>still we have no sign of bearishness is seen in Nifty.

TIME TO BUY NIFTY AGAIN!! NIFTY SEEMS POSITIVEHello All!!
I am back with totally different opinion on Nifty Futures, I had checked with Media and some published articles, most of all are Bearish On Nifty for coming day!!
But I don't think so.......
Today on 04-04-2025, Nifty is negative by more than -1.5%.
I think it is very right time to buy Nifty!!
Nifty futures CMP:22950.00
Nifty has beached its valuable support at 23,270.00
Now, Nifty's next big support is at 22,930.00
RSI is just above it's 40 Mark level!!
If RSI manages to hold that 40 Mark level, Nifty is going to switch it's direction and start moving upwards.
Simple terms: Risk to Reward ratio is most favorable at current market price.
So, if Nifty holds 22,930.00 level and RSI holds it's 40 Mark level, Bulls are back in market.
Target: 24,000.00 with in this month.
Stoploss: Mange as per your risk tolerance capacity.
Let's hope for the best!!
Be cautious, Market is teaching us something which is not so often!!
Note: This is just my attempt to Analyze Nifty chart, I don't recommend any one to trade or invest based on this study. This is just of educational purpose.


NIFTY : Trading Levels and Plan for 28-Mar-2025📌 NIFTY Trading Plan – 28-Mar-2025
📊 Market Overview:
Nifty closed at 23,601, consolidating within a No Trade Zone after a strong uptrend. The market is at a critical juncture, and the price action at key levels will determine the next directional move.
This plan provides clear trade setups for different opening scenarios and helps you navigate market volatility with a structured approach.
🔼 Scenario 1: Gap-Up Opening (100+ points above 23,700)
A gap-up opening above 23,700 will push Nifty closer to the Last Intraday Resistance Zone (23,772). The key factor will be whether Nifty sustains above resistance or faces rejection.
✅ Plan of Action:
If Nifty sustains above 23,772, it can move towards the next resistance at 23,931. A breakout above 23,931 could trigger a rally towards 24,000+, but watch for profit booking at higher levels.
If price faces rejection at 23,772 and reverses, expect a pullback towards 23,650 → 23,600. A strong rejection here could lead to an intraday sell-off.
Avoid fresh longs inside 23,700 – 23,772, as this area may act as a profit-booking zone. Wait for confirmation before taking trades.
🎯 Pro Tip: If the gap-up is quickly filled within the first 15 minutes, it signals weak buying strength and increases the probability of an intraday correction.
⚖ Scenario 2: Flat Opening (Within ±100 points, around 23,600)
A flat opening suggests indecision among traders, and the market will likely take direction after the first few candles. The best strategy is to trade breakouts or breakdowns from key levels.
✅ Plan of Action:
Upside case: If Nifty breaks and sustains above 23,650, it may head towards 23,700 → 23,772. Observe the price action near resistance before taking fresh longs.
Downside case: If Nifty breaks below 23,520, it could test 23,450 → 23,300. A breakdown below 23,300 will turn the trend bearish.
Sideways caution: If Nifty remains inside the No Trade Zone (23,451 – 23,642), avoid taking trades as volatility could trap both buyers and sellers.
🎯 Pro Tip: In a flat opening scenario, wait for a clear 15-minute candle close above or below key levels before entering trades.
🔽 Scenario 3: Gap-Down Opening (100+ points below 23,500)
A gap-down below 23,500 could indicate profit booking or fresh selling pressure. The critical factor will be whether buyers defend key support zones.
✅ Plan of Action:
If price sustains below 23,500, expect a decline towards 23,300. A breakdown below 23,300 may accelerate selling towards the Buyer’s Support Zone (23,136 – 23,300).
If price finds support at 23,300 and rebounds, it may attempt a recovery towards 23,450 → 23,520. A strong close above 23,520 could shift momentum back to the bulls.
Be cautious of bear traps – If the market gaps down but quickly recovers, it could trigger short covering, leading to an upside reversal.
🎯 Pro Tip: If the gap-down occurs near a strong buyer’s support zone, wait for a bullish price action confirmation before entering long trades.
⚠️ Risk Management Tips for Options Traders
🔹 Avoid over-leveraging – Use proper position sizing to manage risk.
🔹 Theta Decay Awareness – If the market consolidates, option premiums will erode rapidly.
🔹 Use Spreads for Protection – Instead of naked options, use spreads to limit risk and improve probability.
🔹 Trade at Key Levels – Avoid impulsive trades; focus on defined support and resistance zones.
📌 Summary & Conclusion
📍 Key Levels to Watch:
🟥 Resistance: 23,772 → 23,931 → 24,000
🟧 No Trade Zone: 23,451 – 23,642
🟩 Support: 23,520 → 23,300 → 23,136
🔸 Bullish Bias: Above 23,772, targeting 23,931 – 24,000
🔸 Bearish Bias: Below 23,500, expecting a fall towards 23,300 – 23,136
🔸 Neutral/Choppy: Inside 23,451 – 23,642, avoid unnecessary trades
🎯 Final Advice:
Stick to the structured trading plan and execute only at key levels.
Avoid emotional trading—wait for confirmation before entering trades.
The first 15-30 minutes after market open will provide better clarity—observe price action before committing to a trade.
📢 Disclaimer
I am not a SEBI-registered analyst. This trading plan is for educational purposes only. Please conduct your own research or consult a financial advisor before making any trades.

Nifty Futures intraday trend for March 25, 2025Nifty Futures broke the key resistance at 23623 and closed higher and the further uptrend is anticipated to take resistance at 23825.
Nifty futures may begin with a gap down opening tomorrow ie March 25th and a down trend in the morning may give us an opportunity to enter long.

Nifty Futures Intraday Trend for March 24, 2025I foresee a bullish trend for the day with a strong support at 23472. The Nifty Futures likely to see the resistance at 23594 and 23672. If breaks 23672, then will move to 23748.
Small traders always trade with Stop-Loss.


BULLISH RSI DIVERGENCE IN NIFTY Bullish rsi divergence in hrly timeframe
Nifty trading on breakout retest zone
Long wicks on bottom indicates buying
On Bigger TF we can see contraction... Big move expected in days/weeks to come
